Explore_temporal_changes_in_variation
Lauren Blake
January 9, 2017
- Global variance trends
- Evaluating global changes in variation
- Characterizing variance trends between days tested at the gene level using F tests
- General functions for reduction/increase in variance
- Number of significant genes and Storey’s pi_0 values for a reduction in variation between days (main paper)
- Number of significant genes and Storey’s pi_0 values for an increase in variation between days (main paper)
- The pairwise changes in variance were robust with respect to p-value cutoff
- Changes in variance in chimp samples (p-value cutoff 0.05)
- Estimates of pi0 and pi1 for reduction of variation in chimps conditioned on significance in humans (p = 0.05)
- Estimates of pi0 and pi1 for increase of variation in chimps conditioned on significance in humans (p = 0.05)
- Changes of variation in humans
- Estimates of pi0 and pi1 for reduction of variation in humans conditioned on significance in chimps (p = 0.05)
- Estimates of pi0 and pi1 for increase of variation in humans conditioned on significance in chimps (p = 0.05)
- Permutation tests (This code should not be run on a laptop computer. Use a HPC instead. For sample results, see Supplemental Data S15 of the Endoderm paper)
- Permutation test to find the null hypothesis of sharing (reduction in chimps | significant in humans for day 0 to 1 with p-value cutoff of 0.05)
- Permutation test to find the null hypothesis of sharing (reduction in humans | significant in chimps for day 0 to 1 with p-value cutoff of 0.05)
- Estimates of pi0 and pi1 for reduction of variation in chimps conditioned on significance in humans (p = 0.01)
- Changes in variance in chimp samples (p-value cutoff 0.01)
- Estimates of pi0 and pi1 for reduction of variation in chimps conditioned on significance in humans (p = 0.01)
- Estimates of pi0 and pi1 for increase of variation in chimps conditioned on significance in humans (p = 0.01)
- Changes of variation in humans (p = 0.01)
- Estimates of pi0 and pi1 for reduction of variation in humans conditioned on significance in chimps (p = 0.01)
- Estimates of pi0 and pi1 for increase of variation in humans conditioned on significance in chimps (p = 0.01)
- Estimates of pi0 and pi1 for reduction of variation in chimps conditioned on significance in humans (p = 0.1)
- Changes in variance in chimp samples (p-value cutoff 0.1)
- Estimates of pi0 and pi1 for reduction of variation in chimps conditioned on significance in humans (p = 0.1)
- Estimates of pi0 and pi1 for increase of variation in chimps conditioned on significance in humans (p = 0.10)
- Changes of variation in humans (p = 0.10)
- Estimates of pi0 and pi1 for reduction of variation in humans conditioned on significance in chimps (p = 0.10)
- Estimates of pi0 and pi1 for increase of variation in humans conditioned on significance in chimps (p = 0.10)
- Sharing estimates (chimps conditioned on humans) for x number of significant genes (p = 0.05 cutoff)
- Sharing estimates (humans conditioned on chimps) for x number of significant genes
- Note: code to make other figures
- Gene names showing reduction (increase) in variance from days 0 to 1 (days 1 to 2)
The goal of this script is to assess the extent of regulatory variation in our cell types.
Global variance trends
Check data
# Load libraries

library("ggplot2")
library("qvalue")
source("~/Desktop/Endoderm_TC/ashlar-trial/analysis/chunk-options.R")
library("RColorBrewer")

# Load colors
pal <- c(brewer.pal(9, "Set1"), brewer.pal(8, "Set2"), brewer.pal(12, "Set3"))

# Functions for plots

bjpm<-
theme(
  panel.border = element_rect(colour = "black", fill = NA, size = 2),
  plot.title = element_text(size = 16, face = "bold"),
  axis.text.y =  element_text(size = 14,face = "bold",color = "black"),
  axis.text.x =  element_text(size = 14,face = "bold",color = "black"),
  axis.title.y = element_text(size = 14,face = "bold"),
  axis.title.x=element_blank(),
  legend.text = element_text(size = 14,face = "bold"),
  legend.title = element_text(size = 14,face = "bold"),
  strip.text.x = element_text(size = 14,face = "bold"),
  strip.text.y = element_text(size = 14,face = "bold"),
  strip.background = element_rect(colour = "black", size = 2))

bjp<-
theme(
  axis.text.y =  element_text(size = 9,face = "bold",color = "black"),
  axis.title.y = element_text(size = 10,face = "bold",color = "black"),
  axis.text.x =  element_text(size = 9,face = "bold",color = "black"),
  axis.title.x = element_text(size = 10,face = "bold",color = "black"),
  plot.title = element_text(size = 13, face = "bold"))


# Load cyclic loess normalized data

cyclicloess_norm <- read.delim("~/Desktop/Endoderm_TC/ashlar-trial/data/cpm_cyclicloess.txt")
Take the mean of technical replicates for each individual and visualize the data
# Take the mean of the technical replicates when available

  # Day 0 technical replicates
D0_28815 <- as.data.frame(apply(cyclicloess_norm[,5:6], 1, mean))
D0_3647 <- as.data.frame(apply(cyclicloess_norm[,8:9], 1, mean))
D0_3649 <- as.data.frame(apply(cyclicloess_norm[,10:11], 1, mean))
D0_40300 <- as.data.frame(apply(cyclicloess_norm[,12:13], 1, mean))
D0_4955 <- as.data.frame(apply(cyclicloess_norm[,14:15], 1, mean))
  # Day 1 technical replicates
D1_20157 <- as.data.frame(apply(cyclicloess_norm[,16:17], 1, mean))
D1_28815 <- as.data.frame(apply(cyclicloess_norm[,21:22], 1, mean))
D1_3647 <- as.data.frame(apply(cyclicloess_norm[,24:25], 1, mean))
D1_3649 <- as.data.frame(apply(cyclicloess_norm[,26:27], 1, mean))
D1_40300 <- as.data.frame(apply(cyclicloess_norm[,28:29], 1, mean))
D1_4955 <- as.data.frame(apply(cyclicloess_norm[,30:31], 1, mean))
  # Day 2 technical replicates
D2_20157 <- as.data.frame(apply(cyclicloess_norm[,32:33], 1, mean))
D2_28815 <- as.data.frame(apply(cyclicloess_norm[,37:38], 1, mean))
D2_3647 <- as.data.frame(apply(cyclicloess_norm[,40:41], 1, mean))
D2_3649 <- as.data.frame(apply(cyclicloess_norm[,42:43], 1, mean))
D2_40300 <- as.data.frame(apply(cyclicloess_norm[,44:45], 1, mean))
D2_4955 <- as.data.frame(apply(cyclicloess_norm[,46:47], 1, mean))
  # Day 3 technical replicates
D3_20157 <- as.data.frame(apply(cyclicloess_norm[,48:49], 1, mean))
D3_28815 <- as.data.frame(apply(cyclicloess_norm[,53:54], 1, mean))
D3_3647 <- as.data.frame(apply(cyclicloess_norm[,56:57], 1, mean))
D3_3649 <- as.data.frame(apply(cyclicloess_norm[,58:59], 1, mean))
D3_40300 <- as.data.frame(apply(cyclicloess_norm[,60:61], 1, mean))
D3_4955 <- as.data.frame(apply(cyclicloess_norm[,62:63], 1, mean))

# Create a new data frame with all of the combined technical replicates
mean_tech_reps <- cbind(cyclicloess_norm[,1:4], D0_28815, cyclicloess_norm[,7], D0_3647, D0_3649, D0_40300, D0_4955, D1_20157, cyclicloess_norm[,18:20], D1_28815, cyclicloess_norm[,23], D1_3647, D1_3649, D1_40300, D1_4955, D2_20157, cyclicloess_norm[,34:36], D2_28815, cyclicloess_norm[,39], D2_3647, D2_3649, D2_40300, D2_4955, D3_20157, cyclicloess_norm[,50:52], D3_28815, cyclicloess_norm[,55], D3_3647, D3_3649, D3_40300, D3_4955)


colnames(mean_tech_reps) <- c("D0_20157", "D0_20961", "D0_21792", "D0_28162", "D0_28815", "D0_29089", "D0_3647", "D0_3649", "D0_40300", "D0_4955", "D1_20157", "D1_20961", "D1_21792", "D1_28162", "D1_28815", "D1_29089", "D1_3647", "D1_3649", "D1_40300", "D1_4955", "D2_20157", "D2_20961", "D2_21792", "D2_28162", "D2_28815", "D2_29089", "D2_3647", "D2_3649", "D2_40300", "D2_4955", "D3_20157", "D3_20961", "D3_21792", "D3_28162", "D3_28815", "D3_29089", "D3_3647", "D3_3649", "D3_40300", "D3_4955")

dim(mean_tech_reps)
[1] 10304 40#write.table(mean_tech_reps, file="~/Desktop/Endoderm_TC/ashlar-trial/data/cpm_cyclicloess_40.txt",sep="\t", col.names = T, row.names = T)
# Make a column for which are averaged or not
averaged_status <- c(1,1,1,1,2,1,2,2,2,2,2,1,1,1,2,1,2,2,2,2,2,1,1,1,2,1,2,2,2,2,2,1,1,1,2,1,2,2,2,2)
# Find the technical factors for the biological replicates (no technical replicates)
bio_rep_samplefactors <- read.delim("~/Desktop/Endoderm_TC/ashlar-trial/data/samplefactors-filtered.txt", stringsAsFactors=FALSE)
day <- bio_rep_samplefactors$Day
species <- bio_rep_samplefactors$Species
# Make PCA plots with the factors colored by day
pca_genes <- prcomp(t(mean_tech_reps), scale = T, retx = TRUE, center = TRUE)
matrixpca <- pca_genes$x
pc1 <- matrixpca[,1]
pc2 <- matrixpca[,2]
pc3 <- matrixpca[,3]
pc4 <- matrixpca[,4]
pc5 <- matrixpca[,5]
pcs <- data.frame(pc1, pc2, pc3, pc4, pc5)
summary <- summary(pca_genes)
#dev.off()
ggplot(data=pcs, aes(x=pc1, y=pc2, color=as.factor(day+1), shape=as.factor(averaged_status), size=2)) + geom_point() + xlab(paste("PC1 (",(summary$importance[2,1]*100), "% of variance)")) + ylab(paste("PC2 (",(summary$importance[2,2]*100), "% of variance)")) + theme_minimal() + guides(color = guide_legend(order=1), size = FALSE, shape = guide_legend(order=3)) + scale_color_discrete(name ="Day", labels = c("0", "1", "2", "3")) + scale_shape_manual(values = c(5, 7)) + scale_shape_discrete(name ="Replicate status", labels = c("Single" ,"Averaged")) + labs(title = "PCs 1 and 2 from global normalized expression")Scale for 'shape' is already present. Adding another scale for 'shape',
which will replace the existing scale.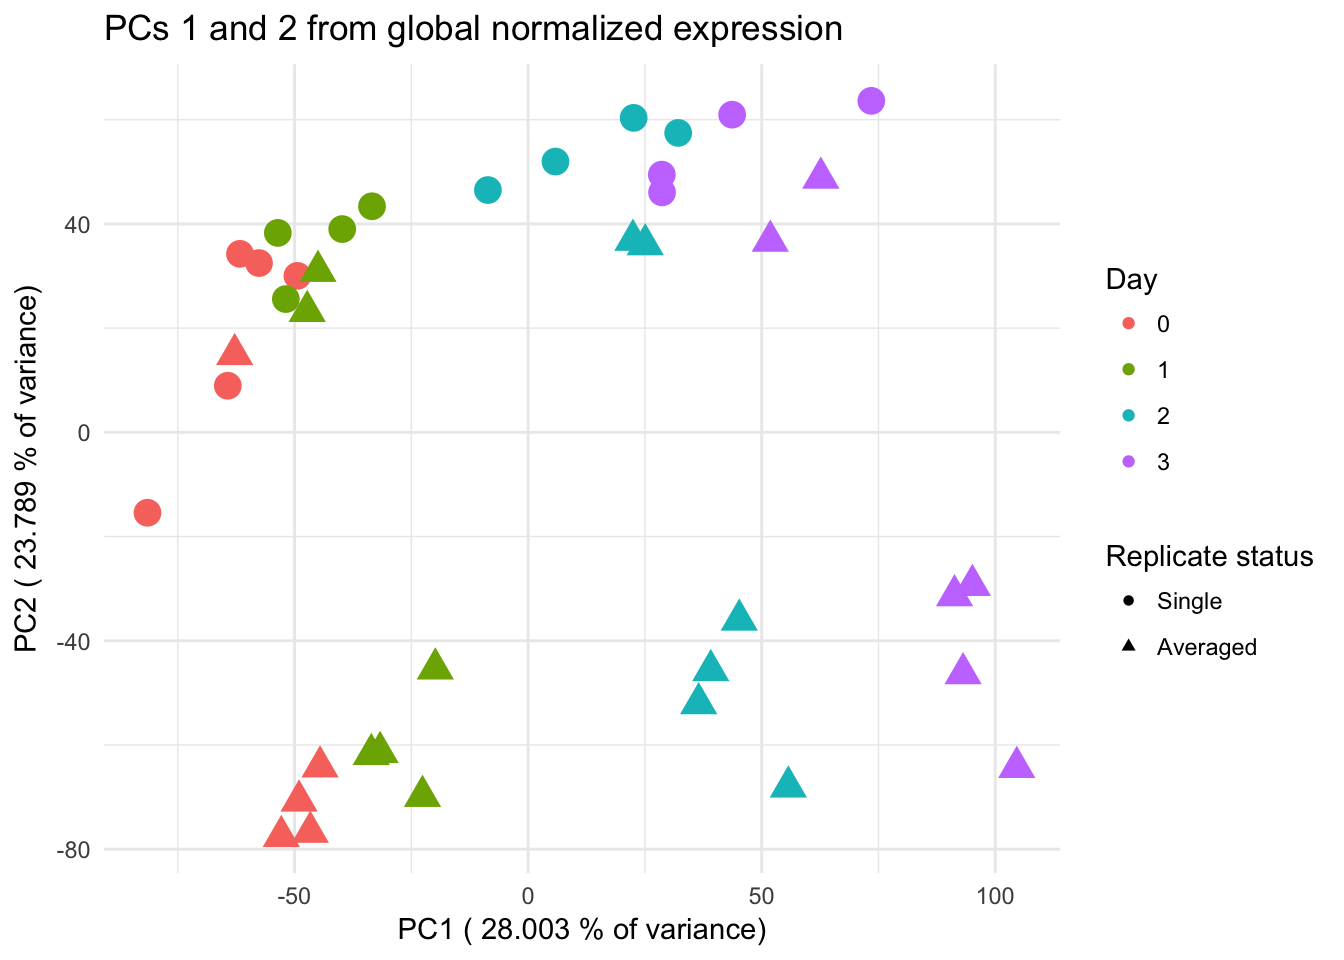
#ggplot(data=pcs, aes(x=pc1, y=pc2, color=as.factor(day+1), shape=as.factor(averaged_status), size=2)) + geom_point() + xlab(paste("PC1 (",(summary$importance[2,1]*100), "% of variance)")) + ylab(paste("PC2 (",(summary$importance[2,2]*100), "% of variance)")) + scale_shape_manual(values = c(5, 8)) + scale_color_discrete(name  ="Day", labels = c("0", "1", "2", "3"))  + labs(title = "PCs 1 and 2 from global normalized gene expression (Averaged bet. technical replicates)")

#ggplotly()
Examine the means and the variances for each day-species pairs
# Calculate the variance for each species-time pair

humans_day0_var <- as.data.frame(apply(as.data.frame(mean_tech_reps[,1:6]),1, var) )
colnames(humans_day0_var) <- c("Variance")
chimps_day0_var <- as.data.frame(apply(as.data.frame(mean_tech_reps[,7:10]),1, var))
colnames(chimps_day0_var) <- c("Variance")
humans_day1_var <- as.data.frame(apply(as.data.frame(mean_tech_reps[,11:16]),1, var))
colnames(humans_day1_var) <- c("Variance")
chimps_day1_var <- as.data.frame(apply(as.data.frame(mean_tech_reps[,17:20]),1, var))
colnames(chimps_day1_var) <- c("Variance")
humans_day2_var <- as.data.frame(apply(as.data.frame(mean_tech_reps[,21:26]),1, var))
colnames(humans_day2_var) <- c("Variance")
chimps_day2_var <- as.data.frame(apply(as.data.frame(mean_tech_reps[,27:30]),1, var))
colnames(chimps_day2_var) <- c("Variance")
humans_day3_var <- as.data.frame(apply(as.data.frame(mean_tech_reps[,31:36]),1, var))
colnames(humans_day3_var) <- c("Variance")
chimps_day3_var <- as.data.frame(apply(as.data.frame(mean_tech_reps[,37:40]),1, var))
colnames(chimps_day3_var) <- c("Variance")

# Calculate the mean for each species-time pair
humans_day0_mean <-  as.data.frame(apply(as.data.frame(mean_tech_reps[,1:6]),1, mean))
colnames(humans_day0_mean) <- c("Mean")
chimps_day0_mean <- as.data.frame(apply(as.data.frame(mean_tech_reps[,7:10]),1, mean))
colnames(chimps_day0_mean) <- c("Mean")
humans_day1_mean <- as.data.frame(apply(as.data.frame(mean_tech_reps[,11:16]),1, mean))
colnames(humans_day1_mean) <- c("Mean")
chimps_day1_mean <- as.data.frame(apply(as.data.frame(mean_tech_reps[,17:20]),1, mean))
colnames(chimps_day1_mean) <- c("Mean")
humans_day2_mean <- as.data.frame(apply(as.data.frame(mean_tech_reps[,21:26]),1, mean))
colnames(humans_day2_mean) <- c("Mean")
chimps_day2_mean <- as.data.frame(apply(as.data.frame(mean_tech_reps[,27:30]),1, mean))
colnames(chimps_day2_mean) <- c("Mean")
humans_day3_mean <- as.data.frame(apply(as.data.frame(mean_tech_reps[,31:36]),1, mean))
colnames(humans_day3_mean) <- c("Mean")
chimps_day3_mean <- as.data.frame(apply(as.data.frame(mean_tech_reps[,37:40]),1, mean))
colnames(chimps_day3_mean) <- c("Mean")

# Make arrays with all the means

labels1 <- array("Chimp Day 0", dim = c(10304, 1))
labels2 <- array("Chimp Day 1", dim = c(10304, 1))
labels3 <- array("Chimp Day 2", dim = c(10304, 1))
labels4 <- array("Chimp Day 3", dim = c(10304, 1))
labels5 <- array("Human Day 0", dim = c(10304, 1))
labels6 <- array("Human Day 1", dim = c(10304, 1))
labels7 <- array("Human Day 2", dim = c(10304, 1))
labels8 <- array("Human Day 3", dim = c(10304, 1))

# Make species-day labels
labels9 <- rbind(labels1, labels2, labels3, labels4, labels5, labels6, labels7, labels8)
labels <- as.numeric(as.factor(labels9))
# Make labels so same days from different species are the same color
labels10 <- rbind(labels1, labels2, labels3, labels4, labels1, labels2, labels3, labels4)
labels10 <- as.numeric(as.factor(labels10))

# Make species labels

labels11 <- array("Chimpanzee", dim = c(41216, 1))
labels12 <- array("Human", dim = c(41216, 1))
labels13 <- rbind(labels11, labels12)

#1 Overall trend across genes

# Boxplot of means gives general trend

# Combine means
HC_mean <- rbind(as.data.frame(chimps_day0_mean), as.data.frame(chimps_day1_mean), as.data.frame(chimps_day2_mean), as.data.frame(chimps_day3_mean), as.data.frame(humans_day0_mean), as.data.frame(humans_day1_mean), as.data.frame(humans_day2_mean), as.data.frame(humans_day3_mean))

HC_mean_labels <- cbind(HC_mean, labels, labels10)

m <- ggplot(HC_mean_labels, aes(x = factor(labels), y = HC_mean))
m <- m + geom_violin(aes(fill = factor(labels10)), show.legend = FALSE) + geom_boxplot(aes(fill = factor(labels10)), show.legend = FALSE, outlier.shape = NA,width=0.2) + theme_bw() +  ggtitle("Mean for each gene by species and day") + xlab("Species-Day Pair") + ylab("Mean for each gene")
m <- m + scale_x_discrete(labels=c("1" = "C Day 0", "2" = "C Day 1", "3" = "C Day 2", "4" = "C Day 3", "5" = "H Day 0", "6" = "H Day 1", "7" = "H Day 2", "8" = "H Day 3")) + bjp
m
Don't know how to automatically pick scale for object of type data.frame. Defaulting to continuous.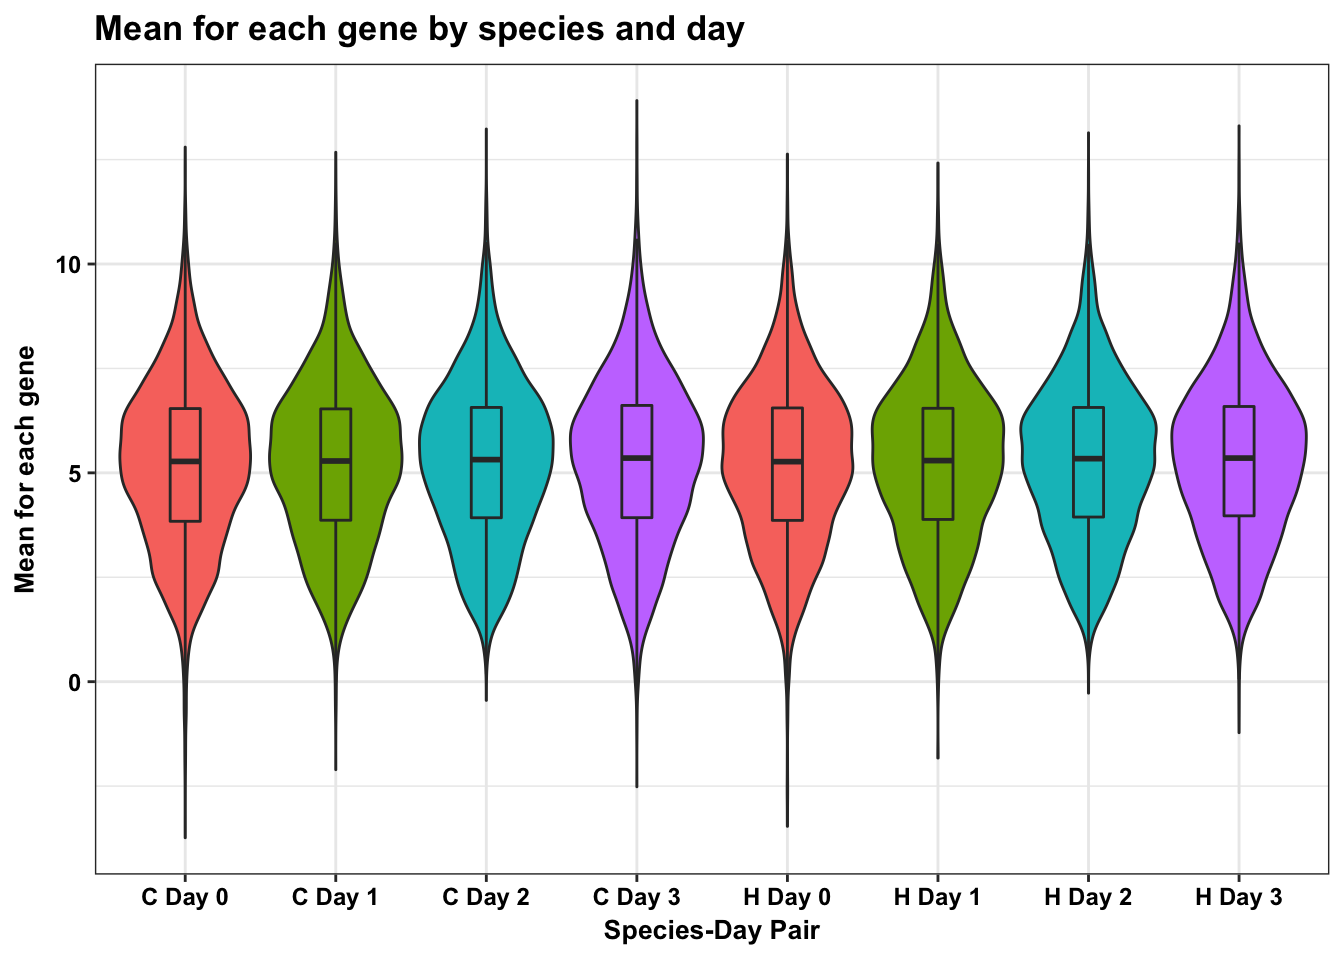
# Take log2 of each data frame

log_chimps_day0_var <- log2(chimps_day0_var)
log_chimps_day1_var <- log2(chimps_day1_var)
log_chimps_day2_var <- log2(chimps_day2_var)
log_chimps_day3_var <- log2(chimps_day3_var)
log_humans_day0_var <- log(humans_day0_var)
log_humans_day1_var <- log2(humans_day1_var)
log_humans_day2_var <- log2(humans_day2_var)
log_humans_day3_var <- log2(humans_day3_var)


# Boxplot of variances gives general trend
HC_var <- rbind(as.data.frame(log_chimps_day0_var), as.data.frame(log_chimps_day1_var), as.data.frame(log_chimps_day2_var), as.data.frame(log_chimps_day3_var), as.data.frame(log_humans_day0_var), as.data.frame(log_humans_day1_var), as.data.frame(log_humans_day2_var), as.data.frame(log_humans_day3_var))


# Make a boxplot of log2(variance of gene expression levels)

HC_var_labels <- cbind(HC_var, labels, labels10)

dim(HC_var_labels)
[1] 82432 3p <- ggplot(HC_var_labels, aes(x = factor(labels), y = HC_var))
p <- p + geom_violin(aes(fill = factor(labels10)), show.legend = FALSE) + geom_boxplot(aes(fill = factor(labels10)), show.legend = FALSE, outlier.shape = NA,width=0.2) + theme_bw() + xlab("Species-Day Pair") + ylab("log2 variance of gene expression") + ggtitle("Log2 variance for each gene by species and day")
p <- p + scale_x_discrete(labels=c("1" = "C Day 0", "2" = "C Day 1", "3" = "C Day 2", "4" = "C Day 3", "5" = "H Day 0", "6" = "H Day 1", "7" = "H Day 2", "8" = "H Day 3"))
p + bjpDon't know how to automatically pick scale for object of type data.frame. Defaulting to continuous.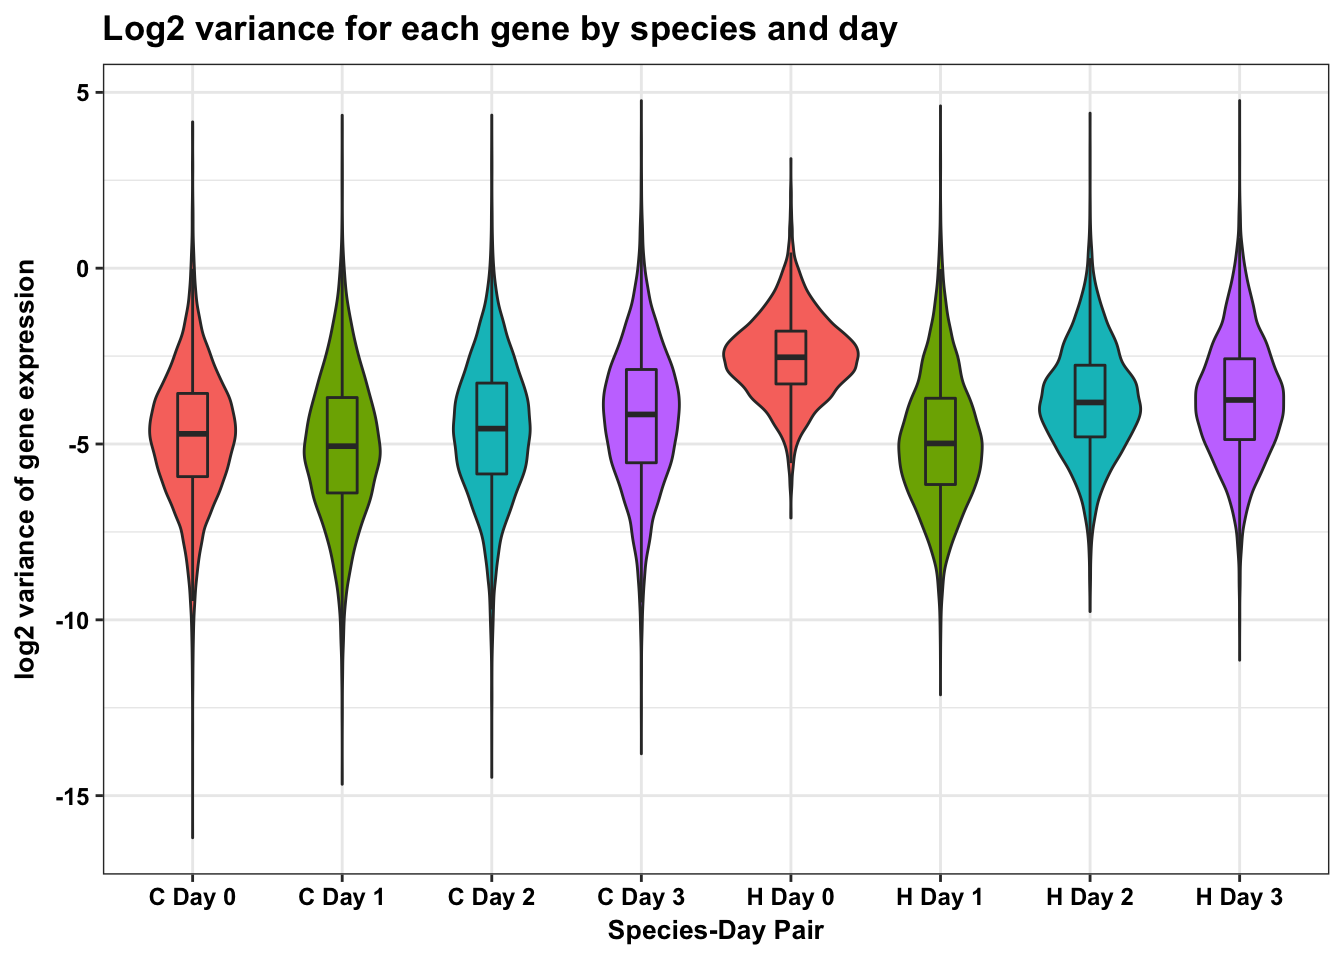
# Make boxplots that are not violin plots
HC_var_labels <- cbind(HC_var, labels, labels10, labels13)
colnames(HC_var_labels) <- c("Variance", "SpeciesDay", "Day", "Species")

p <- ggplot(HC_var_labels, aes(x = factor(Species), y = Variance)) + geom_boxplot(aes(fill = as.factor(Day)),width=0.4) + xlab("Species") + ylab(expression(bold('log'[2]*' variance in gene expression'))) + scale_fill_discrete(name= "Day", labels=c("Day 0","Day 1","Day 2", "Day 3"))
p + bjp + theme(legend.text=element_text(size=7), legend.title=element_text(size=7, face = "bold" ))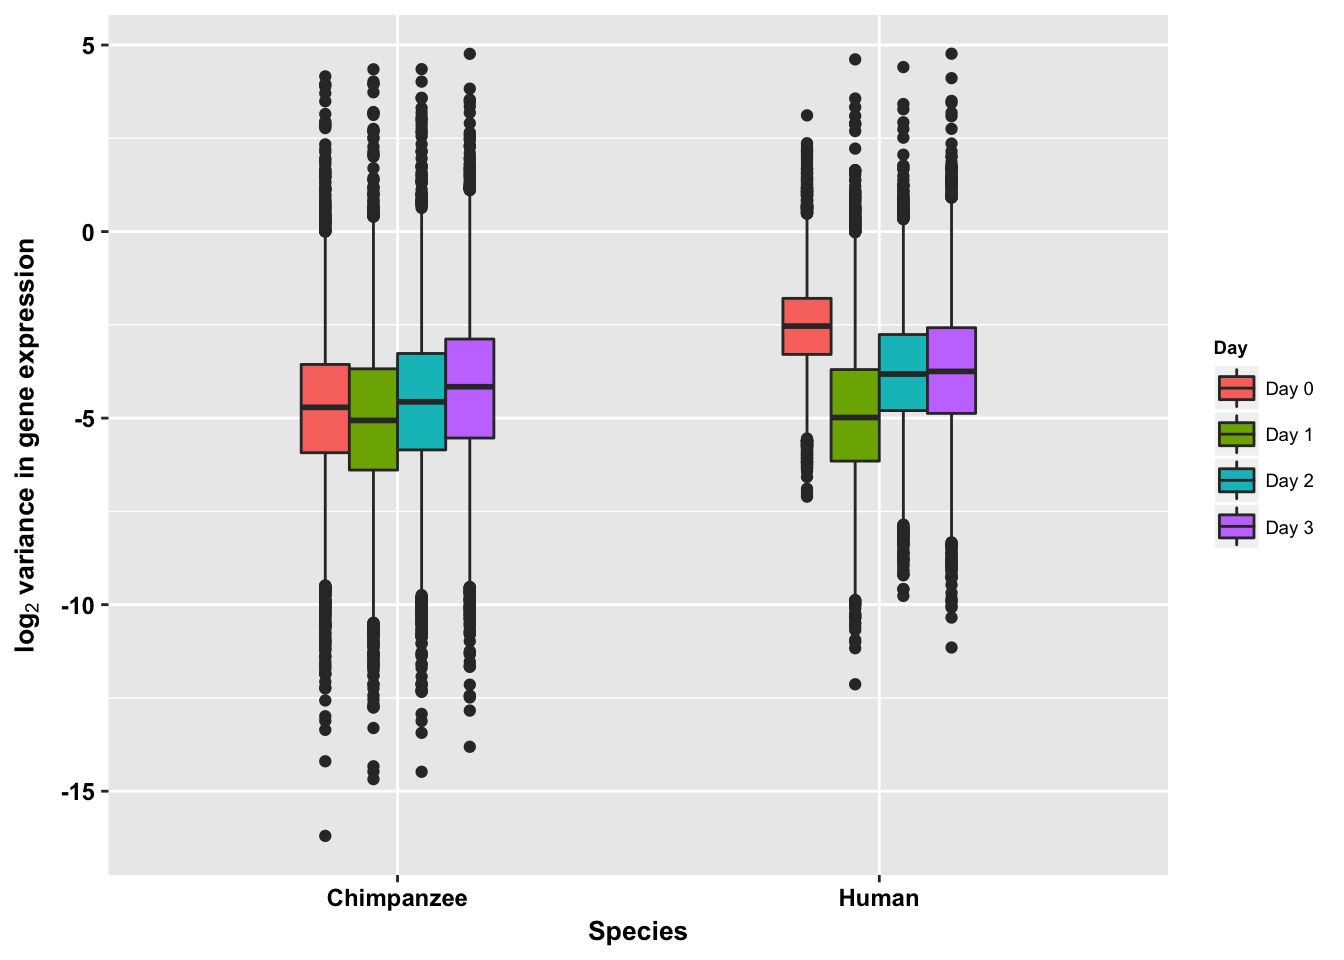
Evaluating global changes in variation
No global reduction in means between day 0 and day 1 in both species
Check to see if differences between means (of all gene expression values) within humans and chimps between days
########## Within chimps ##########

# Test at least one of the means is different
group <- rbind(labels1, labels2, labels3, labels4)

mean_day_species <- rbind(chimps_day0_mean,chimps_day1_mean, chimps_day2_mean, chimps_day3_mean)

aov_groups <- cbind(mean_day_species, group)

dim(aov_groups)
[1] 41216 2aov_bet <- oneway.test(aov_groups$Mean ~ aov_groups$group)
aov_bet
    One-way analysis of means (not assuming equal variances)

data:  aov_groups$Mean and aov_groups$group
F = 3.8146, num df = 3, denom df = 22892, p-value = 0.009564
#F = 4.4683, num df = 3, denom df = 22893, p-value = 0.003845F = 3.8146, num df = 3, denom df = 22892, p-value = 0.009564
# Test groups individually
# Day 0 and Day 1
t.test(chimps_day0_mean, chimps_day1_mean) # 0.1716
    Welch Two Sample t-test

data:  chimps_day0_mean and chimps_day1_mean
t = -1.3672, df = 20583, p-value = 0.1716
alternative hypothesis: true difference in means is not equal to 0
95 percent confidence interval:
 -0.08994855  0.01602921
sample estimates:
mean of x mean of y
 5.191453  5.228413
# Day 1 and Day 2
t.test(chimps_day1_mean, chimps_day2_mean) # 0.2033
    Welch Two Sample t-test

data:  chimps_day1_mean and chimps_day2_mean
t = -1.2721, df = 20606, p-value = 0.2033
alternative hypothesis: true difference in means is not equal to 0
95 percent confidence interval:
 -0.08578381  0.01825800
sample estimates:
mean of x mean of y
 5.228413  5.262176
# Day 2 and Day 3
t.test(chimps_day2_mean, chimps_day3_mean) # 0.6032
    Welch Two Sample t-test

data:  chimps_day2_mean and chimps_day3_mean
t = -0.51978, df = 20565, p-value = 0.6032
alternative hypothesis: true difference in means is not equal to 0
95 percent confidence interval:
 -0.06724364  0.03905490
sample estimates:
mean of x mean of y
 5.262176  5.276270
########## Within humans ##########
# Test at least one of the means is different
group <- rbind(labels5, labels6, labels7, labels8)
mean_day_species <- rbind(humans_day0_mean,humans_day1_mean, humans_day2_mean, humans_day3_mean)
aov_groups <- cbind(mean_day_species, group)
dim(aov_groups)[1] 41216 2aov_bet <- oneway.test(aov_groups$Mean ~ aov_groups$group)
aov_bet
    One-way analysis of means (not assuming equal variances)

data:  aov_groups$Mean and aov_groups$group
F = 6.3119, num df = 3, denom df = 22893, p-value = 0.0002829
# F = 5.5523, num df = 3, denom df = 22893, p-value = 0.0008336
# Test groups individually
# Day 0 and Day 1
t.test(humans_day0_mean, humans_day1_mean) # 0.2702
    Welch Two Sample t-test

data:  humans_day0_mean and humans_day1_mean
t = -1.1027, df = 20596, p-value = 0.2702
alternative hypothesis: true difference in means is not equal to 0
95 percent confidence interval:
 -0.08260299  0.02312380
sample estimates:
mean of x mean of y
 5.211648  5.241388
# Day 1 and Day 2
t.test(humans_day1_mean, humans_day2_mean) # 0.02824
    Welch Two Sample t-test

data:  humans_day1_mean and humans_day2_mean
t = -2.1941, df = 20598, p-value = 0.02824
alternative hypothesis: true difference in means is not equal to 0
95 percent confidence interval:
 -0.109737567 -0.006181887
sample estimates:
mean of x mean of y
 5.241388  5.299347
# Day 2 and Day 3
t.test(humans_day2_mean, humans_day3_mean) # 0.628
    Welch Two Sample t-test

data:  humans_day2_mean and humans_day3_mean
t = -0.48453, df = 20602, p-value = 0.628
alternative hypothesis: true difference in means is not equal to 0
95 percent confidence interval:
 -0.06437644  0.03885704
sample estimates:
mean of x mean of y
 5.299347  5.312107
Conclusion: For both species, there is at least 1 mean that is different; however, when testing between the humans and chimps day 0 and 1, there is not enough statistical evidence to suggest a difference in the means of the variances.
The effect size for the global reduction in variance between day 0 and 1 in chimpanzees is small but larger in humans.
Check to see if differences variances of all of the genes between humans and chimps
# Untransformed variances have a range of 0 to infinity. Therefore, we will log transform the variance values so that there is a range of negative infinity to positive infinity. Then we can use a t-test.


########## Within chimps ##########

t.test(log2((unlist(chimps_day0_var))), log2((unlist(chimps_day1_var))), alternative = c("greater"))
    Welch Two Sample t-test

data:  log2((unlist(chimps_day0_var))) and log2((unlist(chimps_day1_var)))
t = 10.235, df = 20439, p-value < 2.2e-16
alternative hypothesis: true difference in means is greater than 0
95 percent confidence interval:
 0.2388908       Inf
sample estimates:
mean of x mean of y
-4.751923 -5.036558
2^(5.036558 - 4.751923)[1] 1.218102# t = 10.235, df = 20439, p-value < 2.2e-16
# Is Day 1 to 2 or 2 to 3 greater?
# Day 1 and Day 2
t.test(log2((unlist(chimps_day1_var))), log2((unlist(chimps_day2_var))), alternative = c("greater")) # p-value = 1
    Welch Two Sample t-test

data:  log2((unlist(chimps_day1_var))) and log2((unlist(chimps_day2_var)))
t = -15.864, df = 20550, p-value = 1
alternative hypothesis: true difference in means is greater than 0
95 percent confidence interval:
 -0.4955952        Inf
sample estimates:
mean of x mean of y
-5.036558 -4.587522
# Day 2 and Day 3
t.test(log2((unlist(chimps_day2_var))), log2((unlist(chimps_day3_var))), alternative = c("greater")) # p-value = 1
    Welch Two Sample t-test

data:  log2((unlist(chimps_day2_var))) and log2((unlist(chimps_day3_var)))
t = -12.813, df = 20595, p-value = 1
alternative hypothesis: true difference in means is greater than 0
95 percent confidence interval:
 -0.4030692        Inf
sample estimates:
mean of x mean of y
-4.587522 -4.230311
########## Within humans ##########
# Day 0 and Day 1
t.test(log2((unlist(humans_day0_var))), log2((unlist(humans_day1_var))), alternative = c("greater"))
    Welch Two Sample t-test

data:  log2((unlist(humans_day0_var))) and log2((unlist(humans_day1_var)))
t = 49.053, df = 20465, p-value < 2.2e-16
alternative hypothesis: true difference in means is greater than 0
95 percent confidence interval:
 1.189854      Inf
sample estimates:
mean of x mean of y
-3.636568 -4.867707 2^(4.867707-3.636568)[1] 2.347523# Day 1 and Day 2
t.test(log2((unlist(humans_day1_var))), log2((unlist(humans_day2_var))), alternative = c("greater")) # p-value = 1
    Welch Two Sample t-test

data:  log2((unlist(humans_day1_var))) and log2((unlist(humans_day2_var)))
t = -45.735, df = 19997, p-value = 1
alternative hypothesis: true difference in means is greater than 0
95 percent confidence interval:
 -1.141847       Inf
sample estimates:
mean of x mean of y
-4.867707 -3.765502
# Day 2 and Day 3
t.test(log2((unlist(humans_day2_var))), log2((unlist(humans_day3_var))), alternative = c("greater")) # p-value = 0.9986
    Welch Two Sample t-test

data:  log2((unlist(humans_day2_var))) and log2((unlist(humans_day3_var)))
t = -2.9879, df = 20393, p-value = 0.9986
alternative hypothesis: true difference in means is greater than 0
95 percent confidence interval:
 -0.107056       Inf
sample estimates:
mean of x mean of y
-3.765502 -3.696457
Conclusion: For both species, there is at least 1 mean (of the variances) that is different; however, when testing between the chimps day 0 and 1, there is not enough statistical evidence to suggest a difference in the means of the variances in the chimpanzees. Even if you make the argument that biologically we expect a reduction in variance between day 0 an day 1 (due to cannalization, for example) and therefore try a one-sided t-test, the p-value is still not statistically significant.
Characterizing variance trends between days tested at the gene level using F tests
We are interested in the genes that experience either an increase or reduction in variance between days in both species. We are going to use a parametric test.
General functions for reduction/increase in variance
## Original code for the qqplots provided by Bryce van de Geijn.
#Output:
#adds a set of qq points to an existing graph

addqqplot=function(pvals, always.plot,density, col_designated){
  len = length(pvals)
  res=qqplot(-log10((1:len)/(1+len)),pvals,plot.it=F)
  return(res)
}

#newqqplot creates a new plot with a set of qq points
#Output:
#creates a new qq plot

newqqplot=function(pvals, always.plot,density){
  len = length(pvals)
  res=qqplot(-log10((1:len)/(1+len)),pvals,plot.it=F)
}
# 1A) Reduction in variation. Enrichment in chimps given that the gene was significant in humans
# We need 4 values for each species: day t-1 start and end values and day t start and end values.
find_qqplot_red_chimps <- function(chimp_begin_column_tm1, chimp_end_column_tm1, chimp_begin_column_t, chimp_end_column_t, human_begin_column_tm1, human_end_column_tm1, human_begin_column_t, human_end_column_t, p_val_cutoff){
# Make an array to store the Chimp p-values
chimp_var_pval <- array(NA, dim = c(10304, 1))
for(i in 1:10304){
x <- t(mean_tech_reps[i,chimp_begin_column_tm1:chimp_end_column_tm1])
y <- t(mean_tech_reps[i,chimp_begin_column_t:chimp_end_column_t])
htest <- var.test(x, y, alternative = c("greater"))
chimp_var_pval[i,1] <- htest$p.value
}
hist(chimp_var_pval)
# Test
# chimp_var_pval <- array(NA, dim = c(10304, 1))
# for(i in 1:10304){
# x <- t(mean_tech_reps[i,7:10])
# y <- t(mean_tech_reps[i,17:20])
# htest <- var.test(x, y, alternative = c("greater"))
# chimp_var_pval[i,1] <- htest$p.value
# }
# hist(chimp_var_pval)
# q_chimp_var_adj_pval <- qvalue(chimp_var_pval)
# length(q_chimp_var_adj_pval[which(q_chimp_var_adj_pval < 0.05) , ])
############## For humans
human_var_pval <- array(NA, dim = c(10304, 1))
for(i in 1:10304){
x <- t(mean_tech_reps[i,human_begin_column_tm1:human_end_column_tm1])
y <- t(mean_tech_reps[i,human_begin_column_t:human_end_column_t])
htest <- var.test(x, y, alternative = c("greater"))
human_var_pval[i,1] <- htest$p.value
}
hist(human_var_pval)
# human_var_pval <- array(NA, dim = c(10304, 1))
# for(i in 1:10304){
# x <- t(mean_tech_reps[i,1:6])
# y <- t(mean_tech_reps[i,11:16])
# htest <- var.test(x, y, alternative = c("greater"))
# human_var_pval[i,1] <- htest$p.value
# }
# hist(human_var_pval)
# q_human_var_adj_pval <- qvalue(human_var_pval)$qvalues
# length(q_human_var_adj_pval[which(q_human_var_adj_pval < 0.05) , ])
# 3498
############ Find p-values of the F_statistics
# Make one data frame for corrected pvalues
# chimp_var_adj_pval <- qvalue(chimp_var_pval)
# human_var_adj_pval <- qvalue(human_var_pval)$qvalues
# human_var_pval_adj_pval <- as.data.frame(cbind(human_var_pval, human_var_adj_pval))
# human_var_pval_adj_pval_order <- human_var_pval_adj_pval[order(human_var_pval_adj_pval[,2]),]
# Set p-value (for FDR)
# p_val <- human_var_pval_adj_pval_order[max(which(human_var_pval_adj_pval_order[,2] < 0.05)), 1]
p_val <- p_val_cutoff
var_pval <- as.data.frame(cbind(chimp_var_pval, human_var_pval))
rownames(var_pval) <- rownames(mean_tech_reps)
colnames(var_pval) <- c("Chimpanzee", "Human")
summary(var_pval)
# Make one data frame for uncorrected pvalues
var_pval <- as.data.frame(cbind(chimp_var_pval, human_var_pval))
rownames(var_pval) <- rownames(mean_tech_reps)
colnames(var_pval) <- c("Chimpanzee", "Human")
summary(var_pval)
dim(var_pval)
# Set p-value
# p_val <- 0.05
# P-val < 0.05 for chimps only
num_var_pval_chimps <- var_pval[ which(var_pval[,1] < p_val), ]
# P-val < 0.05 for humans only
num_var_pval_humans <- var_pval[ which(var_pval[,2] < p_val), ]
# A data frame with the # of genes with significant p-values
sig_p_val <- as.data.frame(rbind(dim(num_var_pval_chimps), dim(num_var_pval_humans)))[,1]
# Run for the chimps
num_var_pval_chimps_neg_log <- -log10(var_pval[,1])
res_chimp <- newqqplot(num_var_pval_chimps_neg_log, -1, 100)
# Run for the shared
# Find the p-values of the chimps given that it was significant in the humans
subset_var <- as.data.frame(var_pval[ which(var_pval[,2] < p_val), 1:2])
num_var_pval_chimp_given_human_no_df <- subset_var[,1]
num_var_pval_chimp_given_human <- as.data.frame(subset_var[,1])
num_var_pval_shared_neg_log <- -log10(num_var_pval_chimp_given_human)
res_shared <- addqqplot(num_var_pval_shared_neg_log[,1], -1, 100, pal[3])
# Information for plotting
list_values = list(chimp_var_pval, num_var_pval_chimp_given_human_no_df, sig_p_val, res_chimp$x, res_chimp$y, res_shared$x, res_shared$y, max(res_chimp$x), max(res_chimp$y), max(res_shared$x), max(res_shared$y))
return(list_values)
}
# 2A) Increase in variation. Enrichment in chimps given that the gene was significant in humans
# We need 4 values for each species: day t-1 start and end values and day t start and end values.
find_qqplot_inc_chimps <- function(chimp_begin_column_tm1, chimp_end_column_tm1, chimp_begin_column_t, chimp_end_column_t, human_begin_column_tm1, human_end_column_tm1, human_begin_column_t, human_end_column_t, p_val_cutoff){
# Make an array to store the Chimp p-values
chimp_var_pval <- array(NA, dim = c(10304, 1))
for(i in 1:10304){
x <- t(mean_tech_reps[i,chimp_begin_column_tm1:chimp_end_column_tm1])
y <- t(mean_tech_reps[i,chimp_begin_column_t:chimp_end_column_t])
htest <- var.test(x, y, alternative = c("less"))
chimp_var_pval[i,1] <- htest$p.value
}
hist(chimp_var_pval)
############## For humans
human_var_pval <- array(NA, dim = c(10304, 1))
for(i in 1:10304){
x <- t(mean_tech_reps[i,human_begin_column_tm1:human_end_column_tm1])
y <- t(mean_tech_reps[i,human_begin_column_t:human_end_column_t])
htest <- var.test(x, y, alternative = c("less"))
human_var_pval[i,1] <- htest$p.value
}
hist(human_var_pval)
############ Find p-values of the F_statistics
# Make one data frame
var_pval <- as.data.frame(cbind(chimp_var_pval, human_var_pval))
rownames(var_pval) <- rownames(mean_tech_reps)
colnames(var_pval) <- c("Chimpanzee", "Human")
summary(var_pval)
dim(var_pval)
# Set p-value
p_val <- p_val_cutoff
# P-val < 0.05 for chimps only
num_var_pval_chimps <- var_pval[ which(var_pval[,1] < p_val), ]
# P-val < 0.05 for humans only
num_var_pval_humans <- var_pval[ which(var_pval[,2] < p_val), ]
# A data frame with the # of genes with significant p-values
sig_p_val <- as.data.frame(rbind(dim(num_var_pval_chimps), dim(num_var_pval_humans)))[,1]
# Run for the chimps
num_var_pval_chimps_neg_log <- -log10(var_pval[,1])
res_chimp <- newqqplot(num_var_pval_chimps_neg_log, -1, 100)
# Run for the shared
# Find the p-values of the chimps given that it was significant in the humans
subset_var <- as.data.frame(var_pval[ which(var_pval[,2] < p_val), 1:2])
num_var_pval_chimp_given_human_no_df <- subset_var[,1]
num_var_pval_chimp_given_human <- as.data.frame(subset_var[,1])
num_var_pval_shared_neg_log <- -log10(num_var_pval_chimp_given_human)
res_shared <- addqqplot(num_var_pval_shared_neg_log[,1], -1, 100, pal[3])
# Information for plotting
list_values = list(chimp_var_pval, num_var_pval_chimp_given_human_no_df, sig_p_val, res_chimp$x, res_chimp$y, res_shared$x, res_shared$y, max(res_chimp$x), max(res_chimp$y), max(res_shared$x), max(res_shared$y))
return(list_values)
}
# 1B) Reduction in variation. Enrichment in humans given that the gene was significant in chimps
# We need 4 values for each species: day t-1 start and end values and day t start and end values.
find_qqplot_red_humans <- function(chimp_begin_column_tm1, chimp_end_column_tm1, chimp_begin_column_t, chimp_end_column_t, human_begin_column_tm1, human_end_column_tm1, human_begin_column_t, human_end_column_t, p_val_cutoff){
# Make an array to store the Chimp p-values
chimp_var_pval <- array(NA, dim = c(10304, 1))
for(i in 1:10304){
x <- t(mean_tech_reps[i,chimp_begin_column_tm1:chimp_end_column_tm1])
y <- t(mean_tech_reps[i,chimp_begin_column_t:chimp_end_column_t])
htest <- var.test(x, y, alternative = c("greater"))
chimp_var_pval[i,1] <- htest$p.value
}
hist(chimp_var_pval)
############## For humans
human_var_pval <- array(NA, dim = c(10304, 1))
for(i in 1:10304){
x <- t(mean_tech_reps[i,human_begin_column_tm1:human_end_column_tm1])
y <- t(mean_tech_reps[i,human_begin_column_t:human_end_column_t])
htest <- var.test(x, y, alternative = c("greater"))
human_var_pval[i,1] <- htest$p.value
}
hist(human_var_pval)
############ Find p-values of the F_statistics
# Make one data frame
var_pval <- as.data.frame(cbind(chimp_var_pval, human_var_pval))
rownames(var_pval) <- rownames(mean_tech_reps)
colnames(var_pval) <- c("Chimpanzee", "Human")
summary(var_pval)
dim(var_pval)
# Set p-value
p_val <- p_val_cutoff
# P-val < 0.05 for chimps only
num_var_pval_chimps <- var_pval[ which(var_pval[,1] < p_val), ]
# P-val < 0.05 for humans only
num_var_pval_humans <- var_pval[ which(var_pval[,2] < p_val), ]
# A data frame with the # of genes with significant p-values
sig_p_val <- as.data.frame(rbind(dim(num_var_pval_chimps), dim(num_var_pval_humans)))[,1]
# Run for the humans
num_var_pval_chimps_neg_log <- -log10(var_pval[,2])
res_chimp <- newqqplot(num_var_pval_chimps_neg_log, -1, 100)
# Run for the shared
# Find the p-values of the humans given that it was significant in the chimps
subset_var <- as.data.frame(var_pval[ which(var_pval[,1] < p_val), 1:2])
num_var_pval_human_given_chimp_no_df <- subset_var[,2]
num_var_pval_human_given_chimp <- as.data.frame(subset_var[,2])
num_var_pval_shared_neg_log <- -log10(num_var_pval_human_given_chimp)
res_shared <- addqqplot(num_var_pval_shared_neg_log[,1], -1, 100, pal[3])
# Information for plotting
list_values = list(human_var_pval, num_var_pval_human_given_chimp_no_df, sig_p_val, res_chimp$x, res_chimp$y, res_shared$x, res_shared$y, max(res_chimp$x), max(res_chimp$y), max(res_shared$x), max(res_shared$y))
return(list_values)
}
# 2B) Increase in variation. Enrichment in humans given that the gene was significant in chimps
# We need 4 values for each species: day t-1 start and end values and day t start and end values.
find_qqplot_inc_humans <- function(chimp_begin_column_tm1, chimp_end_column_tm1, chimp_begin_column_t, chimp_end_column_t, human_begin_column_tm1, human_end_column_tm1, human_begin_column_t, human_end_column_t, p_val_cutoff){
# Make an array to store the Chimp p-values
chimp_var_pval <- array(NA, dim = c(10304, 1))
for(i in 1:10304){
x <- t(mean_tech_reps[i,chimp_begin_column_tm1:chimp_end_column_tm1])
y <- t(mean_tech_reps[i,chimp_begin_column_t:chimp_end_column_t])
htest <- var.test(x, y, alternative = c("less"))
chimp_var_pval[i,1] <- htest$p.value
}
hist(chimp_var_pval)
############## For humans
human_var_pval <- array(NA, dim = c(10304, 1))
for(i in 1:10304){
x <- t(mean_tech_reps[i,human_begin_column_tm1:human_end_column_tm1])
y <- t(mean_tech_reps[i,human_begin_column_t:human_end_column_t])
htest <- var.test(x, y, alternative = c("less"))
human_var_pval[i,1] <- htest$p.value
}
hist(human_var_pval)
############ Find p-values of the F_statistics
# Make one data frame
var_pval <- as.data.frame(cbind(chimp_var_pval, human_var_pval))
rownames(var_pval) <- rownames(mean_tech_reps)
colnames(var_pval) <- c("Chimpanzee", "Human")
summary(var_pval)
dim(var_pval)
# Set p-value
p_val <- p_val_cutoff
# P-val < 0.05 for chimps only
num_var_pval_chimps <- var_pval[ which(var_pval[,1] < p_val), ]
# P-val < 0.05 for humans only
num_var_pval_humans <- var_pval[ which(var_pval[,2] < p_val), ]
# A data frame with the # of genes with significant p-values
sig_p_val <- as.data.frame(rbind(dim(num_var_pval_chimps), dim(num_var_pval_humans)))[,1]
# Run for the humans
num_var_pval_chimps_neg_log <- -log10(var_pval[,2])
res_chimp <- newqqplot(num_var_pval_chimps_neg_log, -1, 100)
# Run for the shared
# Find the p-values of the humans given that it was significant in the chimps
subset_var <- as.data.frame(var_pval[ which(var_pval[,1] < p_val), 1:2])
num_var_pval_human_given_chimp_no_df <- subset_var[,2]
num_var_pval_human_given_chimp <- as.data.frame(subset_var[,2])
num_var_pval_shared_neg_log <- -log10(num_var_pval_human_given_chimp)
res_shared <- addqqplot(num_var_pval_shared_neg_log[,1], -1, 100, pal[3])
# Information for plotting
list_values = list(human_var_pval, num_var_pval_human_given_chimp_no_df, sig_p_val, res_chimp$x, res_chimp$y, res_shared$x, res_shared$y, max(res_chimp$x), max(res_chimp$y), max(res_shared$x), max(res_shared$y))
return(list_values)
}
# Make multiple ggplots on the same page
# Multiplot function (from http://www.cookbook-r.com/Graphs/Multiple_graphs_on_one_page_%28ggplot2%29/)
multiplot <- function(..., plotlist=NULL, file, cols=1, layout=NULL) {
library(grid)
# Make a list from the ... arguments and plotlist
plots <- c(list(...), plotlist)
numPlots = length(plots)
# If layout is NULL, then use 'cols' to determine layout
if (is.null(layout)) {
# Make the panel
# ncol: Number of columns of plots
# nrow: Number of rows needed, calculated from # of cols
layout <- matrix(seq(1, cols * ceiling(numPlots/cols)),
ncol = cols, nrow = ceiling(numPlots/cols))
}
if (numPlots==1) {
print(plots[[1]])
} else {
# Set up the page
grid.newpage()
pushViewport(viewport(layout = grid.layout(nrow(layout), ncol(layout))))
# Make each plot, in the correct location
for (i in 1:numPlots) {
# Get the i,j matrix positions of the regions that contain this subplot
matchidx <- as.data.frame(which(layout == i, arr.ind = TRUE))
print(plots[[i]], vp = viewport(layout.pos.row = matchidx$row,
layout.pos.col = matchidx$col))
}
}
}Number of significant genes and Storey’s pi_0 values for a reduction in variation between days (main paper)
Chimpanzees
Testing chimps reduction in variance from days 0 to 1
chimp_var_pval <- array(NA, dim = c(10304, 1))
for(i in 1:10304){
     x <- t(mean_tech_reps[i,7:10])
     y <- t(mean_tech_reps[i,17:20])
      htest <- var.test(x, y, alternative = c("greater"))
     chimp_var_pval[i,1] <- htest$p.value
 }

chimp_var_pval_red01 <- as.data.frame(chimp_var_pval)
length(which(chimp_var_pval < 0.05))
[1] 664# Make a histogram of the unadjusted p-values
hist(chimp_var_pval)
# Go from unadjusted to B.H. adjusted p-values
fdr_adj <- p.adjust(chimp_var_pval, method = c("fdr") )
summary(fdr_adj) Min. 1st Qu. Median Mean 3rd Qu. Max.
0.3703 0.8591 0.8835 0.8793 0.9167 0.9999 # How many B.H. adjusted p-values < 0.05?
which(fdr_adj < 0.05)integer(0)# Plot the unadjusted versus adjusted p-values
plot(chimp_var_pval, fdr_adj, xlim = c(0,1), ylim = c(0,1), xlab = c("p-value of the F-test"), ylab = c("BH-adj p-value"), main = c("F test results from Chimp samples Day 0 to 1"))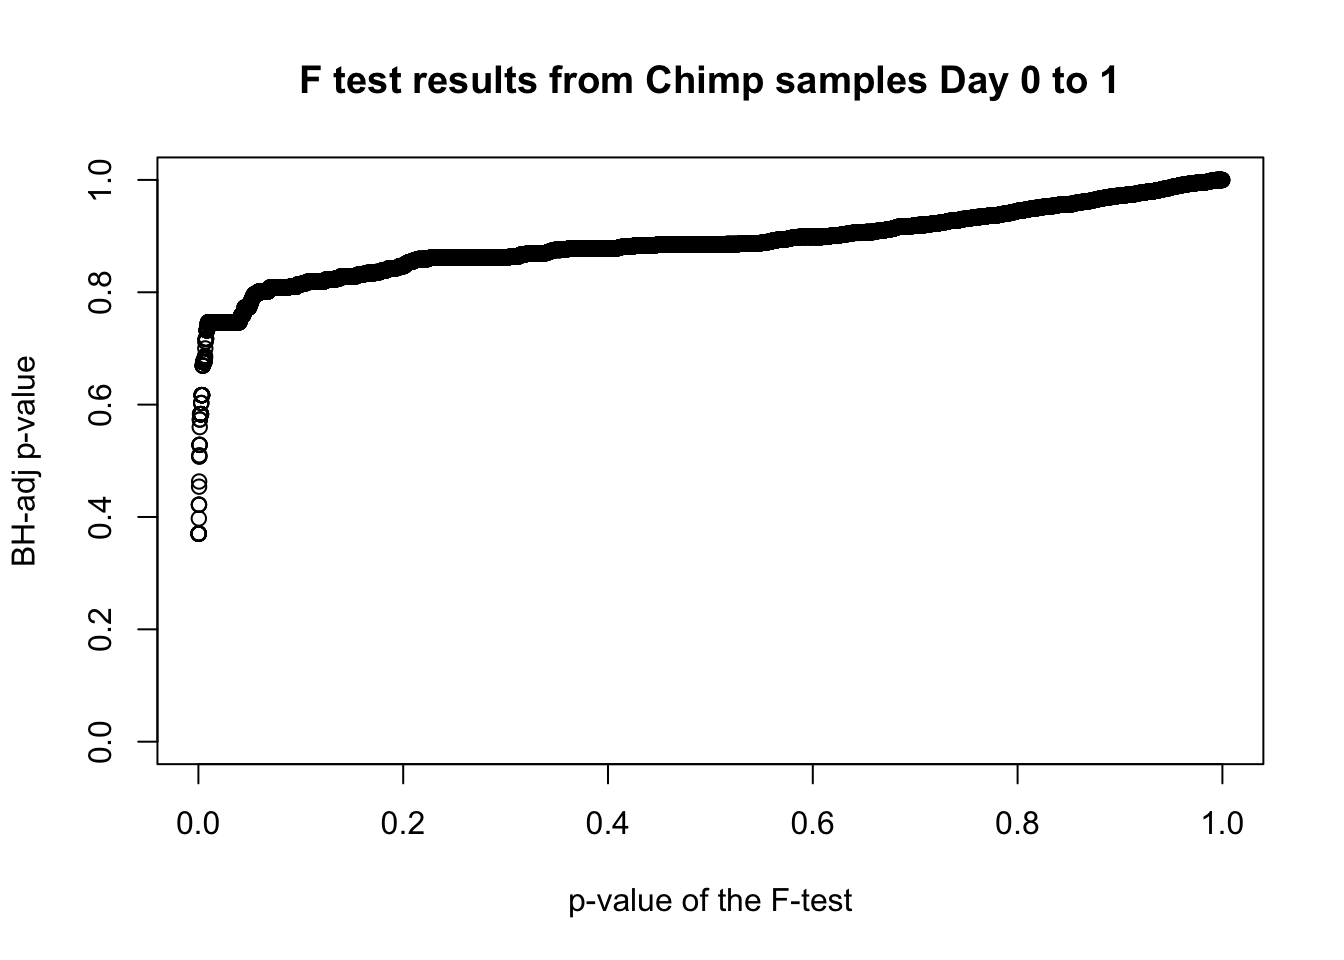
# Obtain Storey's pi_0
qvalue(p=chimp_var_pval, pi0.method="bootstrap", fdr.level=NULL, robust=TRUE)$pi0[1] 0.7440476boot_pi0 <- qvalue(p=chimp_var_pval, pi0.method="bootstrap", fdr.level=NULL, robust=TRUE)$pi0
qvalue(p=chimp_var_pval, pi0.method="smoother", fdr.level=NULL, robust=TRUE)$pi0[1] 0.7259161boot_pi0s <- qvalue(p=chimp_var_pval, pi0.method="smoother", fdr.level=NULL, robust=TRUE)$pi0
# Obtain pi_1 based on Storey's pi_0
1-qvalue(p=chimp_var_pval, pi0.method="bootstrap", fdr.level=NULL, robust=TRUE)$pi0[1] 0.25595241-qvalue(p=chimp_var_pval, pi0.method="smoother", fdr.level=NULL, robust=TRUE)$pi0[1] 0.2740839length(which(chimp_var_pval < 0.05))*(1-qvalue(p=chimp_var_pval, pi0.method="bootstrap", fdr.level=NULL, robust=TRUE)$pi0)[1] 169.9524# Make a histogram of the p-value distribution
scaleFUN <- function(x) sprintf("%.1f", x)
p1 <- ggplot(chimp_var_pval_red01, aes(chimp_var_pval_red01[,1])) + geom_histogram(aes(y = ..density..), fill="white", colour="black", breaks=seq(0, 1, by = 0.02)) + theme_bw() +
scale_x_continuous(limits = c(0,1)) + ggtitle("Days 0 to 1") + theme(plot.title = element_text(face = "bold")) + labs(x = "Unadjusted p-values") + labs(y = "Density") + scale_y_continuous(labels=scaleFUN) +
geom_hline(yintercept = boot_pi0, size=2.5, colour = "#E77642") +
annotate("text", label='bold(bolditalic(hat(pi)[0][", chimp"])=="0.74")', parse=TRUE, x=0.8, y=(1.25), size = 9, colour = "#E77642")
p1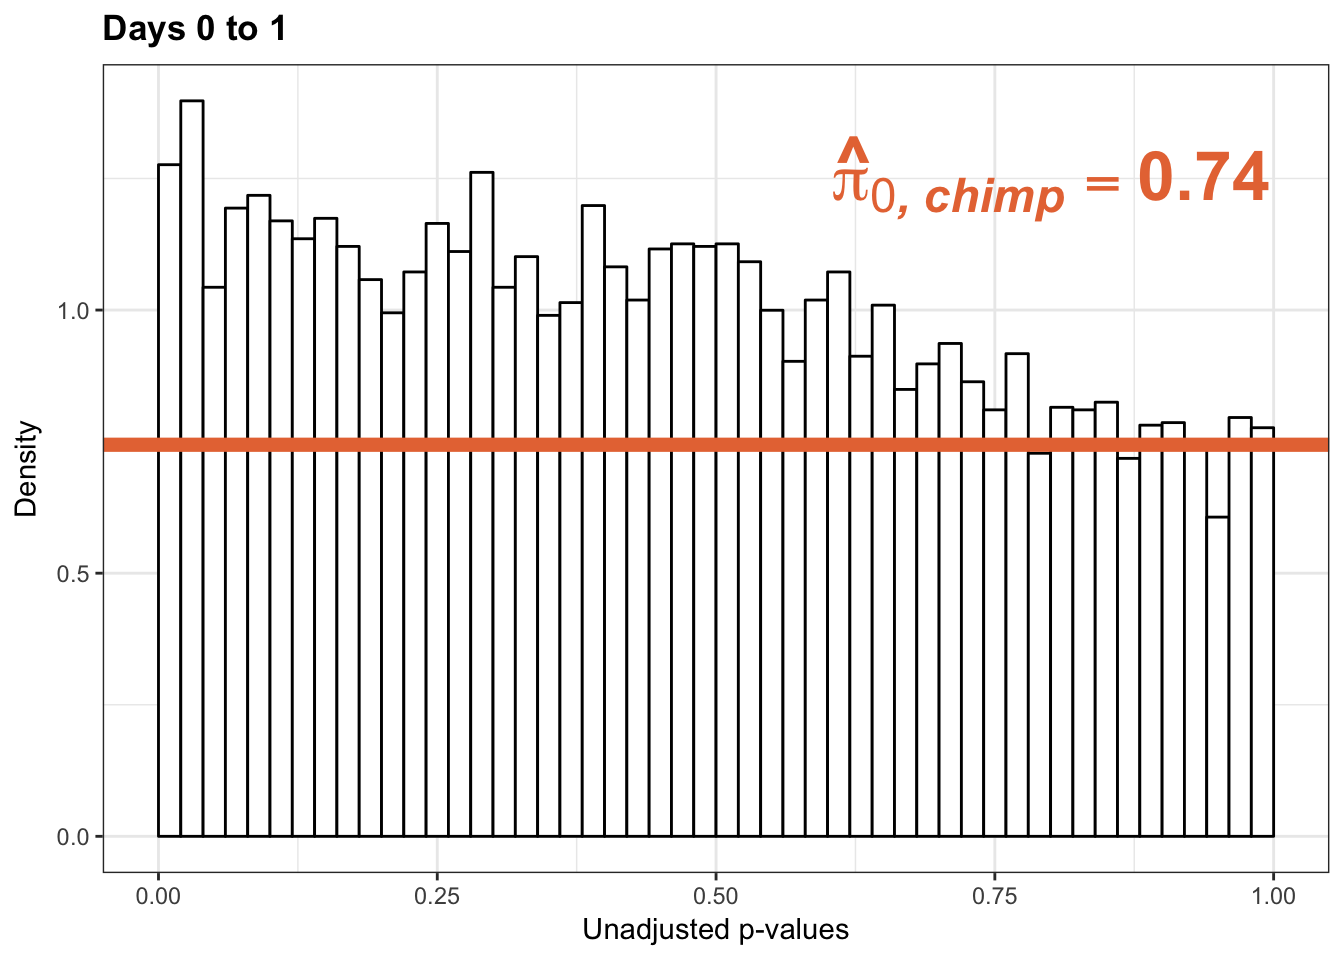
p1s <- ggplot(chimp_var_pval_red01, aes(chimp_var_pval_red01[,1])) + geom_histogram(aes(y = ..density..), fill="white", colour="black", breaks=seq(0, 1, by = 0.02)) + theme_bw() +
scale_x_continuous(limits = c(0,1)) + ggtitle("Days 0 to 1") + theme(plot.title = element_text(face = "bold")) + labs(x = "Unadjusted p-values") + labs(y = "Density") + geom_hline(yintercept = boot_pi0s, size=2.5, colour = "#E77642") + scale_y_continuous(labels=scaleFUN) +
annotate("text", label='bold(bolditalic(hat(pi)[0][", chimp"])=="0.73")', parse=TRUE, x=0.80, y=(1.25), size = 9, colour = "#E77642") +bjp
p1s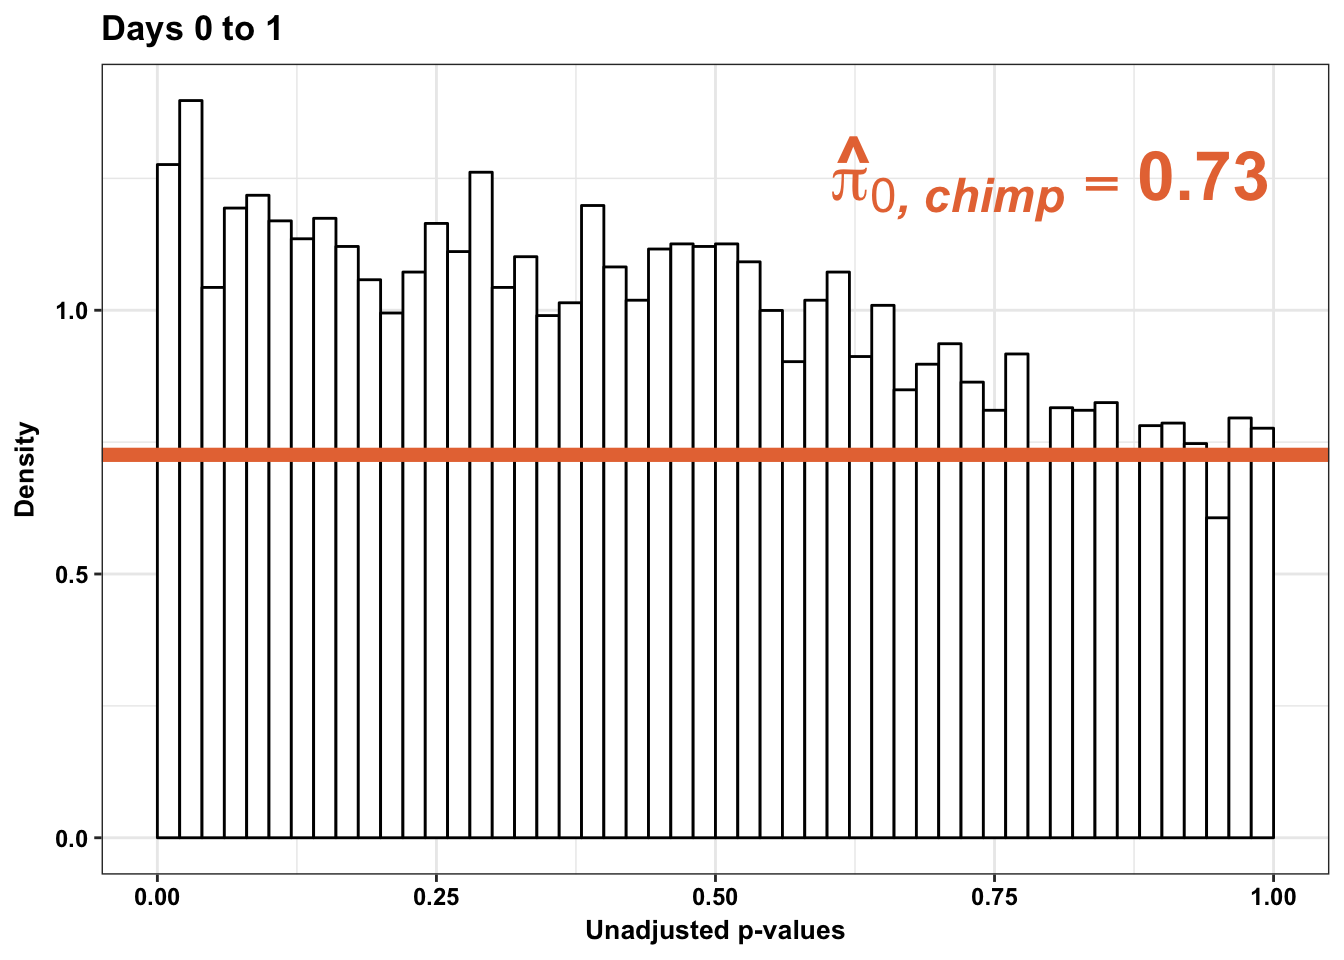
pval <- chimp_var_pval_red01[,1]
resp <- rep(c("Days 0 to 1"), times = 10304)
line <- rep(c("0.73"), times = 10304)
figS12A <- cbind(pval, resp, line)Testing chimps reduction in variance from days 1 to 2
chimp_var_pval <- array(NA, dim = c(10304, 1))
for(i in 1:10304){
x <- t(mean_tech_reps[i,17:20])
y <- t(mean_tech_reps[i,27:30])
htest <- var.test(x, y, alternative = c("greater"))
chimp_var_pval[i,1] <- htest$p.value
}
chimp_var_pval_red12 <- as.data.frame(chimp_var_pval)
length(which(chimp_var_pval < 0.05))[1] 272# Make a histogram of the unadjusted p-values
hist(chimp_var_pval)
# Go from unadjusted to B.H. adjusted p-values
fdr_adj <- p.adjust(chimp_var_pval, method = c("fdr") )
summary(fdr_adj) Min. 1st Qu. Median Mean 3rd Qu. Max.
0.2234 0.9998 0.9998 0.9997 0.9998 0.9999 # How many B.H. adjusted p-values < 0.05?
which(fdr_adj < 0.05)integer(0)# Plot the unadjusted versus adjusted p-values
plot(chimp_var_pval, fdr_adj, xlim = c(0,1), ylim = c(0,1), xlab = c("p-value of the F-test"), ylab = c("BH-adj p-value"), main = c("F test results from Chimp samples Day 1 to 2"))
# Obtain Storey's pi_0
boot_pi0 <- qvalue(p=chimp_var_pval, pi0.method="bootstrap", fdr.level=NULL, robust=TRUE)$pi0
qvalue(p=chimp_var_pval, pi0.method="bootstrap", fdr.level=NULL, robust=TRUE)$pi0[1] 1boot_pi0s <- qvalue(p=chimp_var_pval, pi0.method="smoother", fdr.level=NULL, robust=TRUE)$pi0
qvalue(p=chimp_var_pval, pi0.method="smoother", fdr.level=NULL, robust=TRUE)$pi0[1] 1# Obtain pi_1 based on Storey's pi_0
1-qvalue(p=chimp_var_pval, pi0.method="bootstrap", fdr.level=NULL, robust=TRUE)$pi0[1] 01-qvalue(p=chimp_var_pval, pi0.method="smoother", fdr.level=NULL, robust=TRUE)$pi0[1] 0length(which(chimp_var_pval < 0.05))*(1-qvalue(p=chimp_var_pval, pi0.method="bootstrap", fdr.level=NULL, robust=TRUE)$pi0)[1] 0# Make a histogram of the p-value distribution
# Since there is no apparent enrichment of small p-values, we won't apply Storey's pi0
p2 <- ggplot(chimp_var_pval_red12, aes(chimp_var_pval_red12[,1])) + geom_histogram(aes(y = ..density..), fill="white", colour="black", breaks=seq(0, 1, by = 0.02)) + theme_bw() +
scale_x_continuous(limits = c(0,1)) + labs(x = "Unadjusted p-values") + labs(y = "Density") + scale_y_continuous(labels=scaleFUN) + theme(plot.title = element_text(face = "bold"))
p2
p2s <- ggplot(chimp_var_pval_red12, aes(chimp_var_pval_red12[,1])) + geom_histogram(aes(y = ..density..), fill="white", colour="black", breaks=seq(0, 1, by = 0.02)) + theme_bw() +
scale_x_continuous(limits = c(0,1)) + labs(x = "Unadjusted p-values") + labs(y = "Density") + scale_y_continuous(labels=scaleFUN) + theme(plot.title = element_text(face = "bold")) +bjp + ggtitle("Days 1 to 2") + theme(plot.title = element_text(face = "bold"))
p2s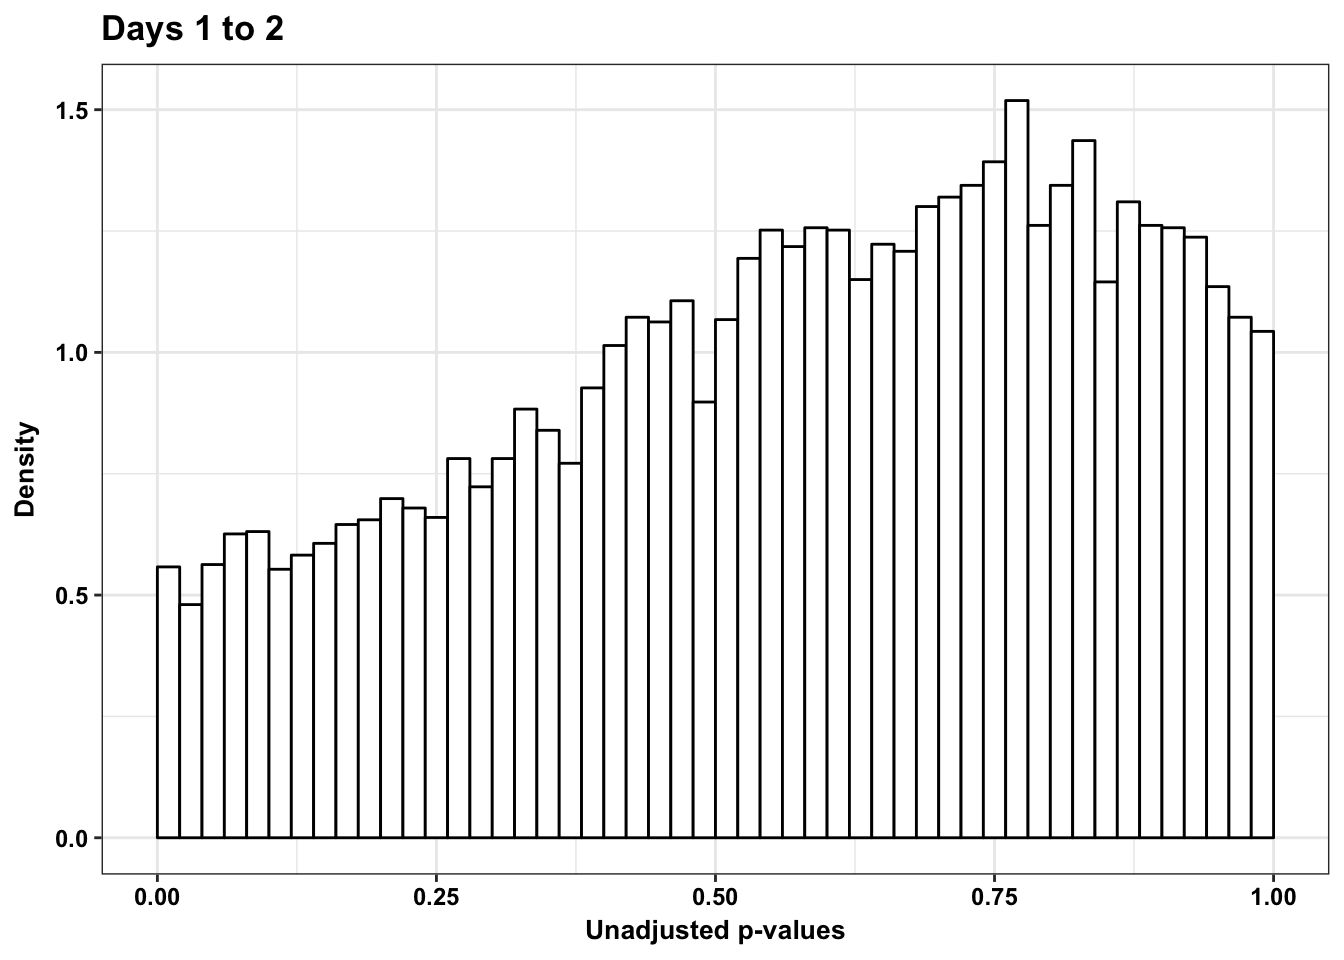
pval <- chimp_var_pval_red12[,1]
resp <- rep(c("Days 1 to 2"), times = 10304)
line <- rep(c("NA"), times = 10304)
figS12A_fig <- cbind(pval, resp, line)
figS12A <- rbind(figS12A, figS12A_fig)Testing chimps reduction in variance from days 2 to 3
chimp_var_pval <- array(NA, dim = c(10304, 1))
for(i in 1:10304){
x <- t(mean_tech_reps[i,27:30])
y <- t(mean_tech_reps[i,37:40])
htest <- var.test(x, y, alternative = c("less"))
chimp_var_pval[i,1] <- htest$p.value
}
chimp_var_pval_red23 <- as.data.frame(chimp_var_pval)
length(which(chimp_var_pval < 0.05))[1] 452# Make a histogram of the unadjusted p-values
hist(chimp_var_pval, breaks = 500, main = c("Chimpanzees days 2 to 3"))
# Go from unadjusted to B.H. adjusted p-values
fdr_adj <- p.adjust(chimp_var_pval, method = c("fdr") )
summary(fdr_adj) Min. 1st Qu. Median Mean 3rd Qu. Max.
0.3806 0.8308 0.8308 0.8455 0.8344 0.9999 # How many B.H. adjusted p-values < 0.05?
which(fdr_adj < 0.05)integer(0)# Plot the unadjusted versus adjusted p-values
plot(chimp_var_pval, fdr_adj, xlim = c(0,1), ylim = c(0,1), xlab = c("p-value of the F-test"), ylab = c("BH-adj p-value"), main = c("F test results from Chimp samples Day 2 to 3"))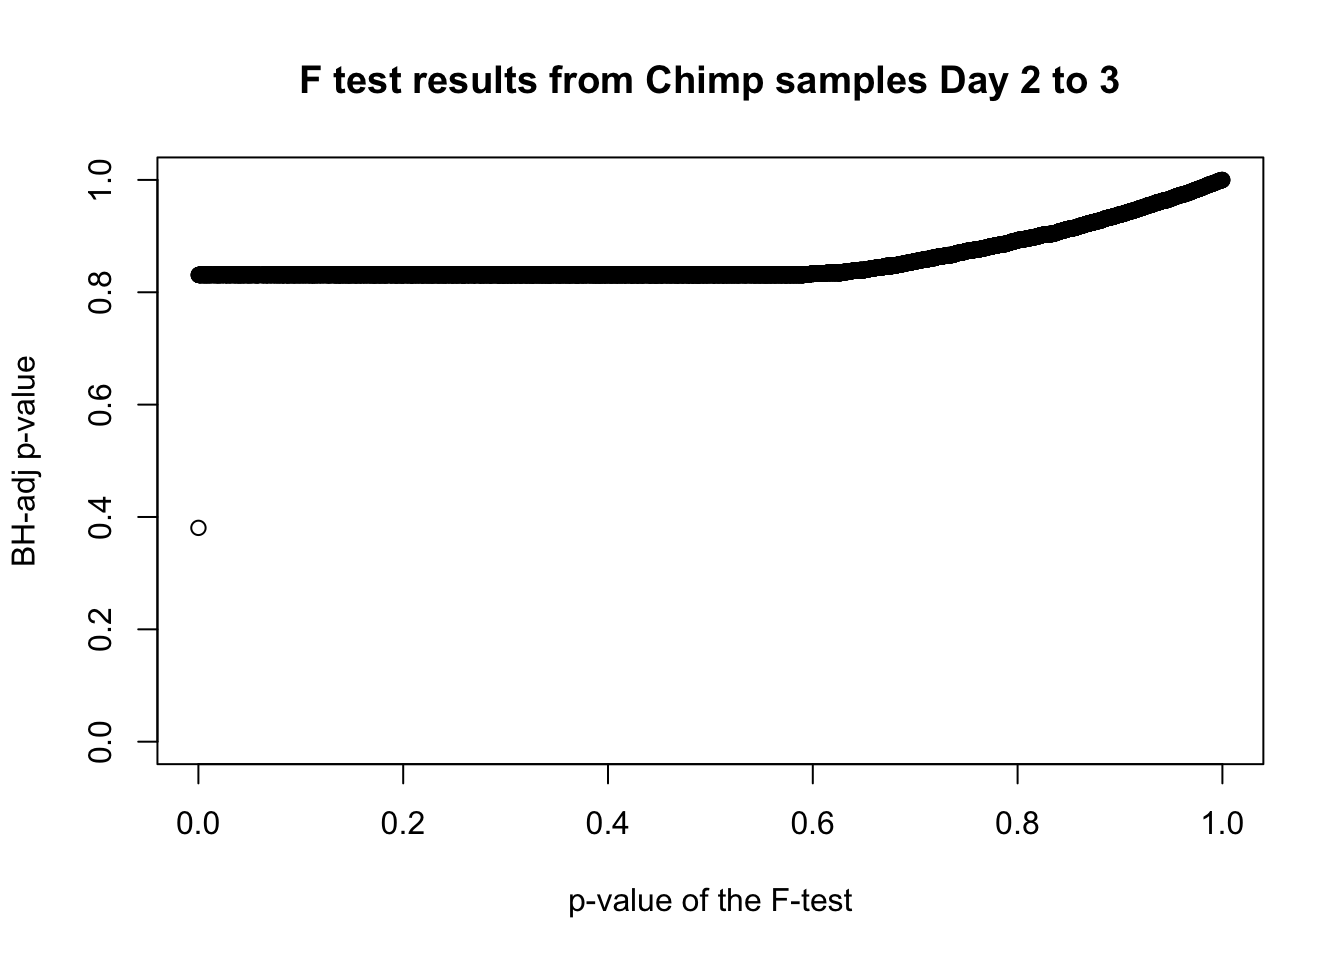
# Obtain Storey's pi_0
boot_pi0 <- qvalue(p=chimp_var_pval, pi0.method="bootstrap", fdr.level=NULL, robust=TRUE)$pi0
qvalue(p=chimp_var_pval, pi0.method="bootstrap", fdr.level=NULL, robust=TRUE)$pi0[1] 0.4600155boot_pi0s <- qvalue(p=chimp_var_pval, pi0.method="smoother", fdr.level=NULL, robust=TRUE)$pi0
qvalue(p=chimp_var_pval, pi0.method="smoother", fdr.level=NULL, robust=TRUE)$pi0[1] 0.3652978# Obtain pi_1 based on Storey's pi_0
1-qvalue(p=chimp_var_pval, pi0.method="bootstrap", fdr.level=NULL, robust=TRUE)$pi0[1] 0.53998451-qvalue(p=chimp_var_pval, pi0.method="smoother", fdr.level=NULL, robust=TRUE)$pi0[1] 0.6347022length(which(chimp_var_pval < 0.05))*(1-qvalue(p=chimp_var_pval, pi0.method="bootstrap", fdr.level=NULL, robust=TRUE)$pi0)[1] 244.073p3 <- ggplot(chimp_var_pval_red23, aes(chimp_var_pval_red23[,1])) + geom_histogram(aes(y = ..density..), fill="white", colour="black", breaks=seq(0, 1, by = 0.02)) + theme_bw() +
scale_x_continuous(limits = c(0,1)) + ggtitle("Days 2 to 3") + theme_bw() +
scale_x_continuous(limits = c(0,1)) + labs(x = "Unadjusted p-values") + labs(y = "Density") + scale_y_continuous(labels=scaleFUN) + theme(plot.title = element_text(face = "bold"))Scale for 'x' is already present. Adding another scale for 'x', which
will replace the existing scale.p3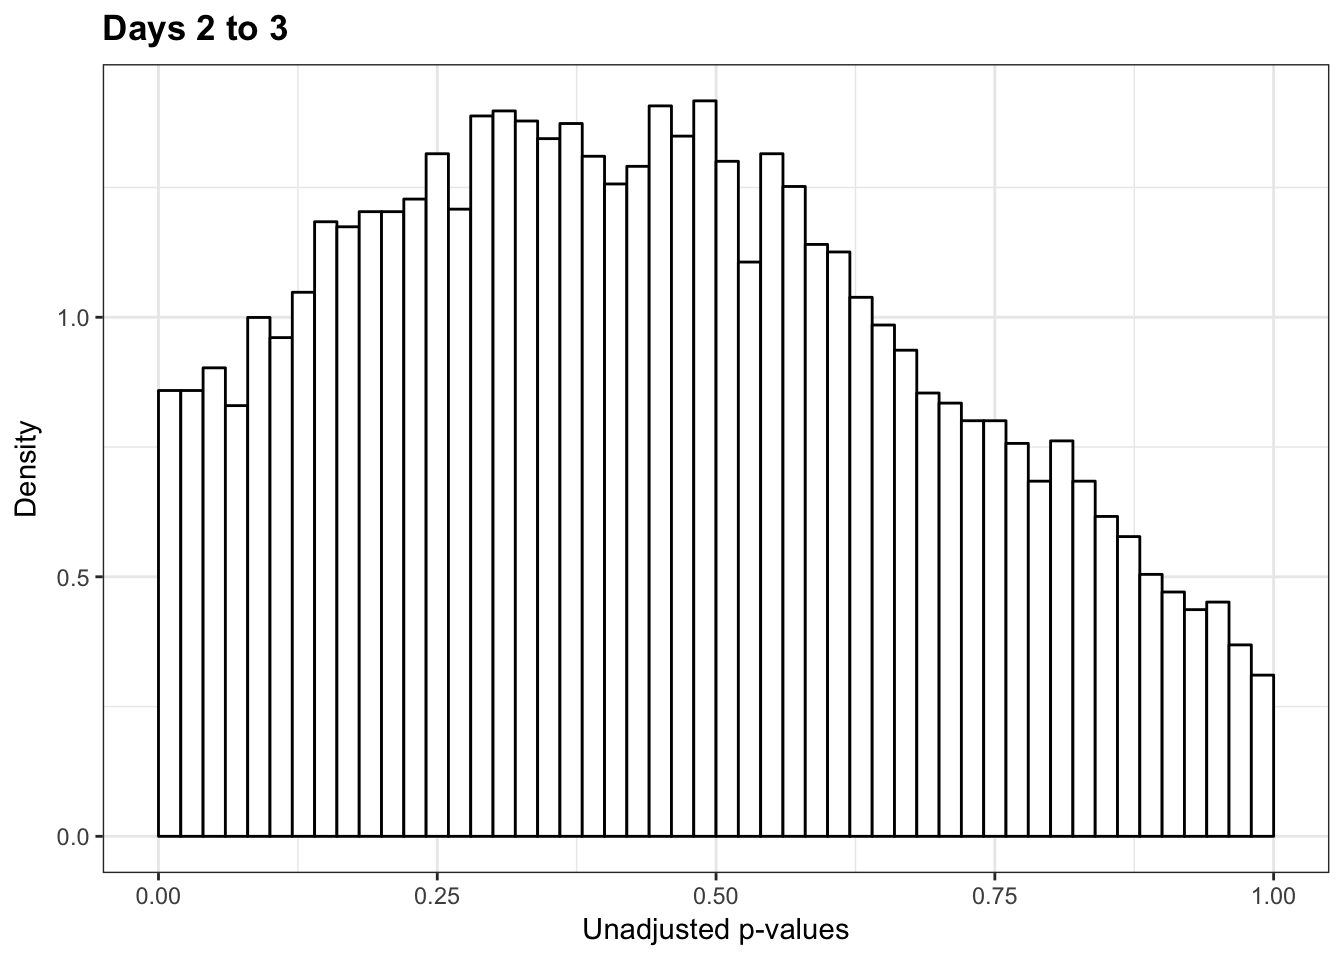
p3s <- ggplot(chimp_var_pval_red23, aes(chimp_var_pval_red23[,1])) + geom_histogram(aes(y = ..density..), fill="white", colour="black", breaks=seq(0, 1, by = 0.02)) + theme_bw() +
scale_x_continuous(limits = c(0,1)) + ggtitle("Days 2 to 3") + theme_bw() + labs(x = "Unadjusted p-values") + labs(y = "Density") + scale_y_continuous(labels=scaleFUN) + theme(plot.title = element_text(face = "bold")) + bjp
p3s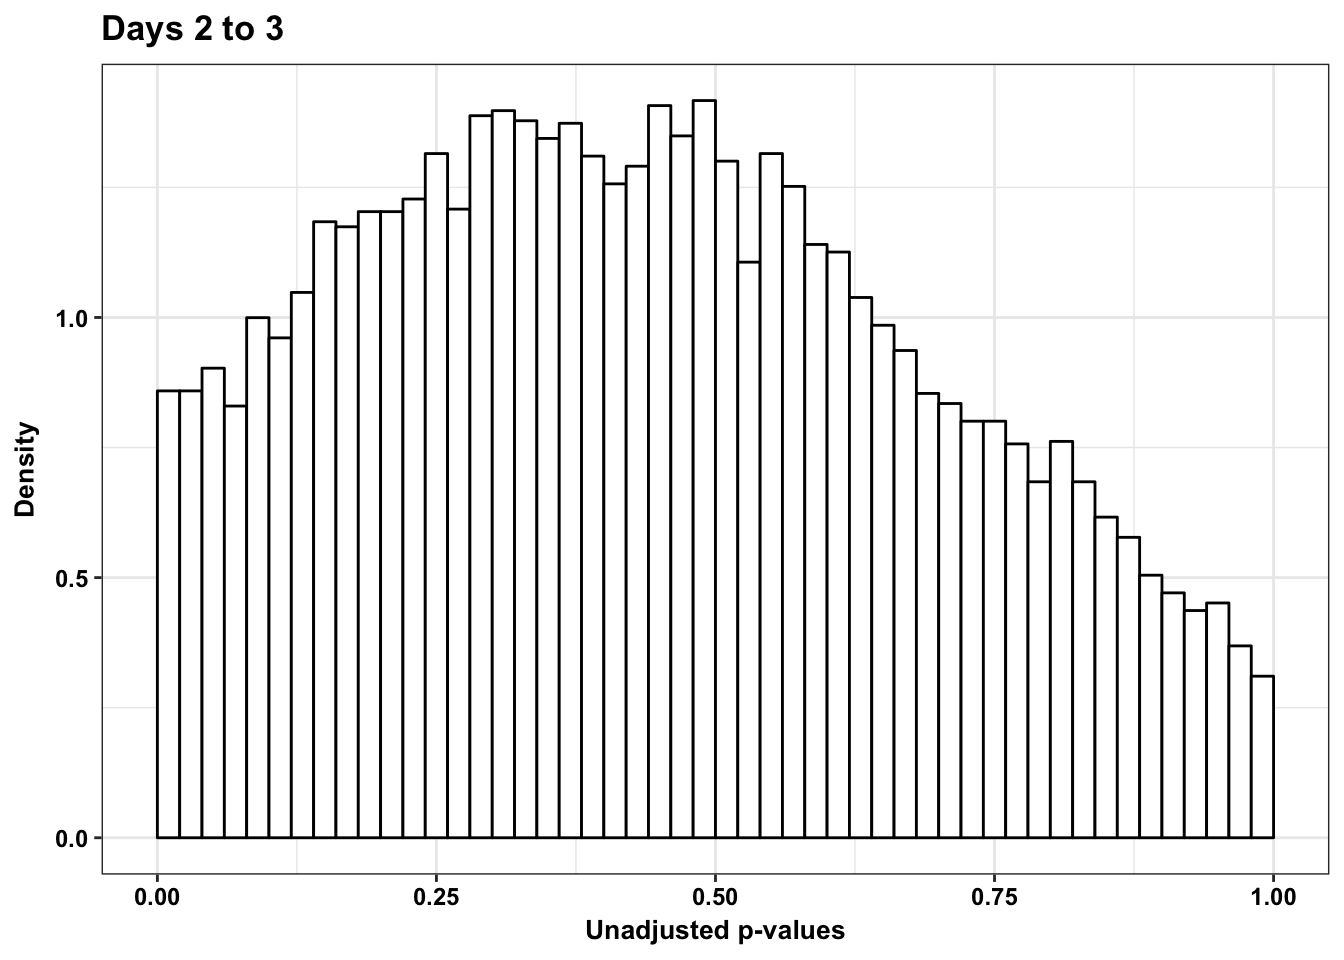
pval <- chimp_var_pval_red23[,1]
resp <- rep(c("Days 2 to 3"), times = 10304)
line <- rep(c("NA"), times = 10304)
figS12A_fig <- cbind(pval, resp, line)
figS12A <- rbind(figS12A, figS12A_fig)Testing chimps reduction in variance from days 1 to 3
chimp_var_pval <- array(NA, dim = c(10304, 1))
for(i in 1:10304){
x <- t(mean_tech_reps[i,17:20])
y <- t(mean_tech_reps[i,37:40])
htest <- var.test(x, y, alternative = c("greater"))
chimp_var_pval[i,1] <- htest$p.value
}
chimp_var_pval_red13 <- as.data.frame(chimp_var_pval)
# Make a histogram of the unadjusted p-values
hist(chimp_var_pval, main = c("Chimpanzees days 1 to 3"))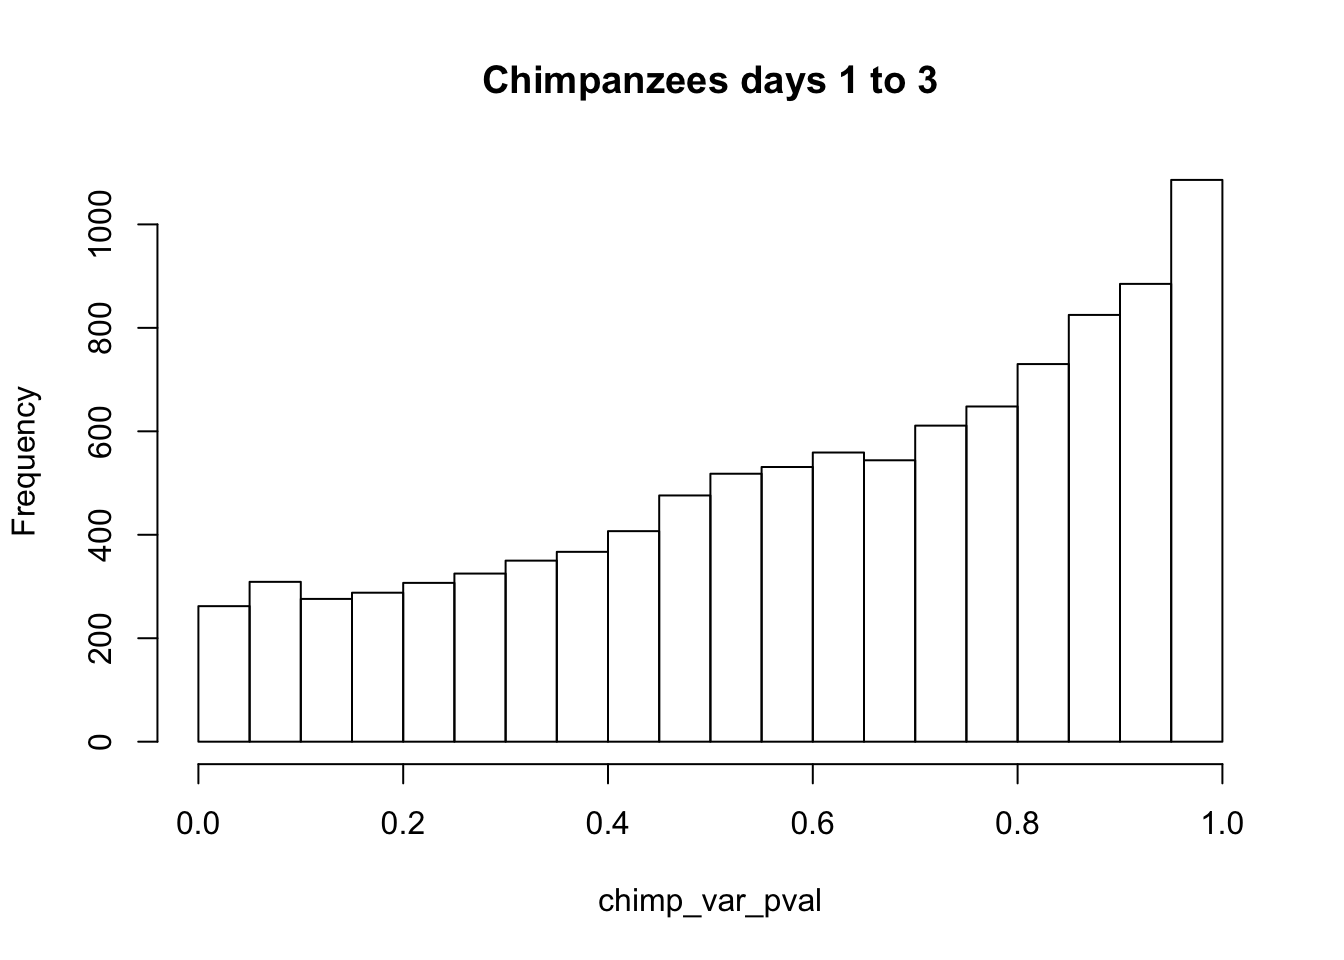
# Go from unadjusted to B.H. adjusted p-values
fdr_adj <- p.adjust(chimp_var_pval, method = c("fdr") )
summary(fdr_adj) Min. 1st Qu. Median Mean 3rd Qu. Max.
0.9999 0.9999 0.9999 0.9999 0.9999 0.9999 # How many B.H. adjusted p-values < 0.05?
which(fdr_adj < 0.05)integer(0)# Plot the unadjusted versus adjusted p-values
plot(chimp_var_pval, fdr_adj, xlim = c(0,1), ylim = c(0,1), xlab = c("p-value of the F-test"), ylab = c("BH-adj p-value"), main = c("F test results from Chimp samples Day 1 to 3"))
# Obtain Storey's pi_0
boot_pi0 <- qvalue(p=chimp_var_pval, pi0.method="bootstrap", fdr.level=NULL, robust=TRUE)$pi0
qvalue(p=chimp_var_pval, pi0.method="bootstrap", fdr.level=NULL, robust=TRUE)$pi0[1] 1boot_pi0s <- qvalue(p=chimp_var_pval, pi0.method="smoother", fdr.level=NULL, robust=TRUE)$pi0
qvalue(p=chimp_var_pval, pi0.method="smoother", fdr.level=NULL, robust=TRUE)$pi0[1] 1# Obtain pi_1 based on Storey's pi_0
1-qvalue(p=chimp_var_pval, pi0.method="bootstrap", fdr.level=NULL, robust=TRUE)$pi0[1] 01-qvalue(p=chimp_var_pval, pi0.method="smoother", fdr.level=NULL, robust=TRUE)$pi0[1] 0length(which(chimp_var_pval < 0.05))*(1-qvalue(p=chimp_var_pval, pi0.method="bootstrap", fdr.level=NULL, robust=TRUE)$pi0)[1] 0p3_13 <- ggplot(chimp_var_pval_red13, aes(chimp_var_pval_red13[,1])) + geom_histogram(aes(y = ..density..), fill="white", colour="black", breaks=seq(0, 1, by = 0.02)) + theme_bw() +
scale_x_continuous(limits = c(0,1)) + ggtitle("Days 1 to 3") + theme_bw() +
scale_x_continuous(limits = c(0,1)) + labs(x = "Unadjusted p-values") + labs(y = "Density") + ggtitle("Days 1 to 2") + scale_y_continuous(labels=scaleFUN) + theme(plot.title = element_text(face = "bold")) Scale for 'x' is already present. Adding another scale for 'x', which
will replace the existing scale.p3_13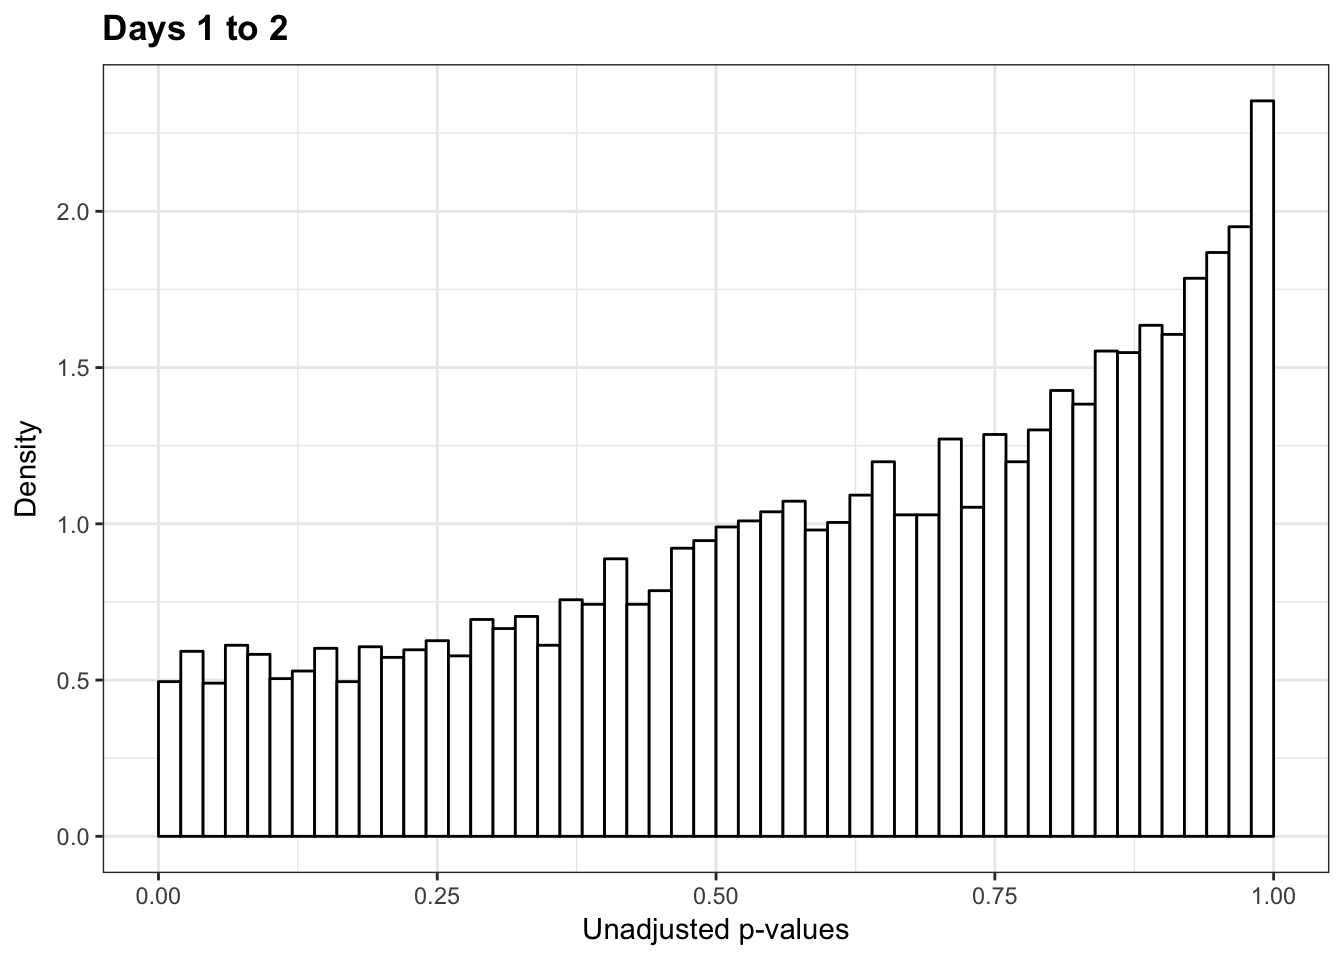
p3_13s <- ggplot(chimp_var_pval_red13, aes(chimp_var_pval_red13[,1])) + geom_histogram(aes(y = ..density..), fill="white", colour="black", breaks=seq(0, 1, by = 0.02)) + theme_bw() +
scale_x_continuous(limits = c(0,1)) + ggtitle("Days 1 to 3") + theme_bw() +
labs(x = "Unadjusted p-values") + labs(y = "Density") + ggtitle("Days 1 to 3") + scale_y_continuous(labels=scaleFUN) + theme(plot.title = element_text(face = "bold")) + bjp
p3_13s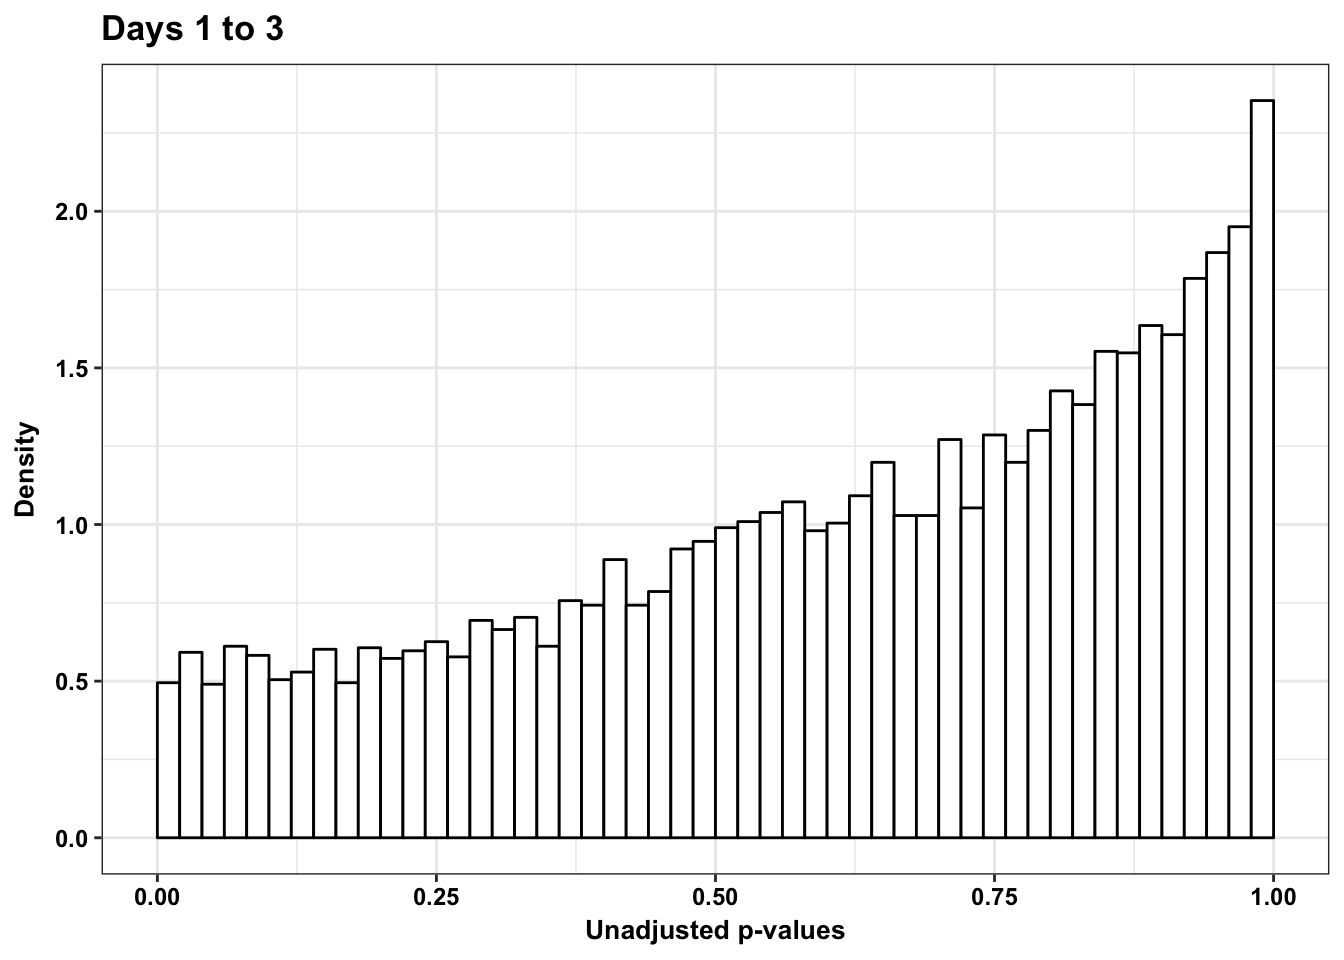
pval <- chimp_var_pval_red13[,1]
resp <- rep(c("Days 1 to 3"), times = 10304)
line <- rep(c("NA"), times = 10304)
figS12A_fig <- cbind(pval, resp, line)
figS12A <- rbind(figS12A, figS12A_fig)
colnames(figS12A) <- c("pval", "days", "line_value")
write.table(figS12A, "/Users/laurenblake/Dropbox/Endoderm TC/Draft versions/Resubmit1_Genome Biology/Supplemental/Data_figS12A.txt", quote = FALSE, row.names = FALSE)Testing humans reduction in variance from days 0 to 1
human_var_pval <- array(NA, dim = c(10304, 1))
for(i in 1:10304){
x <- t(mean_tech_reps[i,1:6])
y <- t(mean_tech_reps[i,11:16])
htest <- var.test(x, y, alternative = c("greater"))
human_var_pval[i,1] <- htest$p.value
}
human_var_pval_red01 <- as.data.frame(human_var_pval)
# Make a histogram of the unadjusted p-values
hist(human_var_pval, main = c("Humans days 0 to 1"))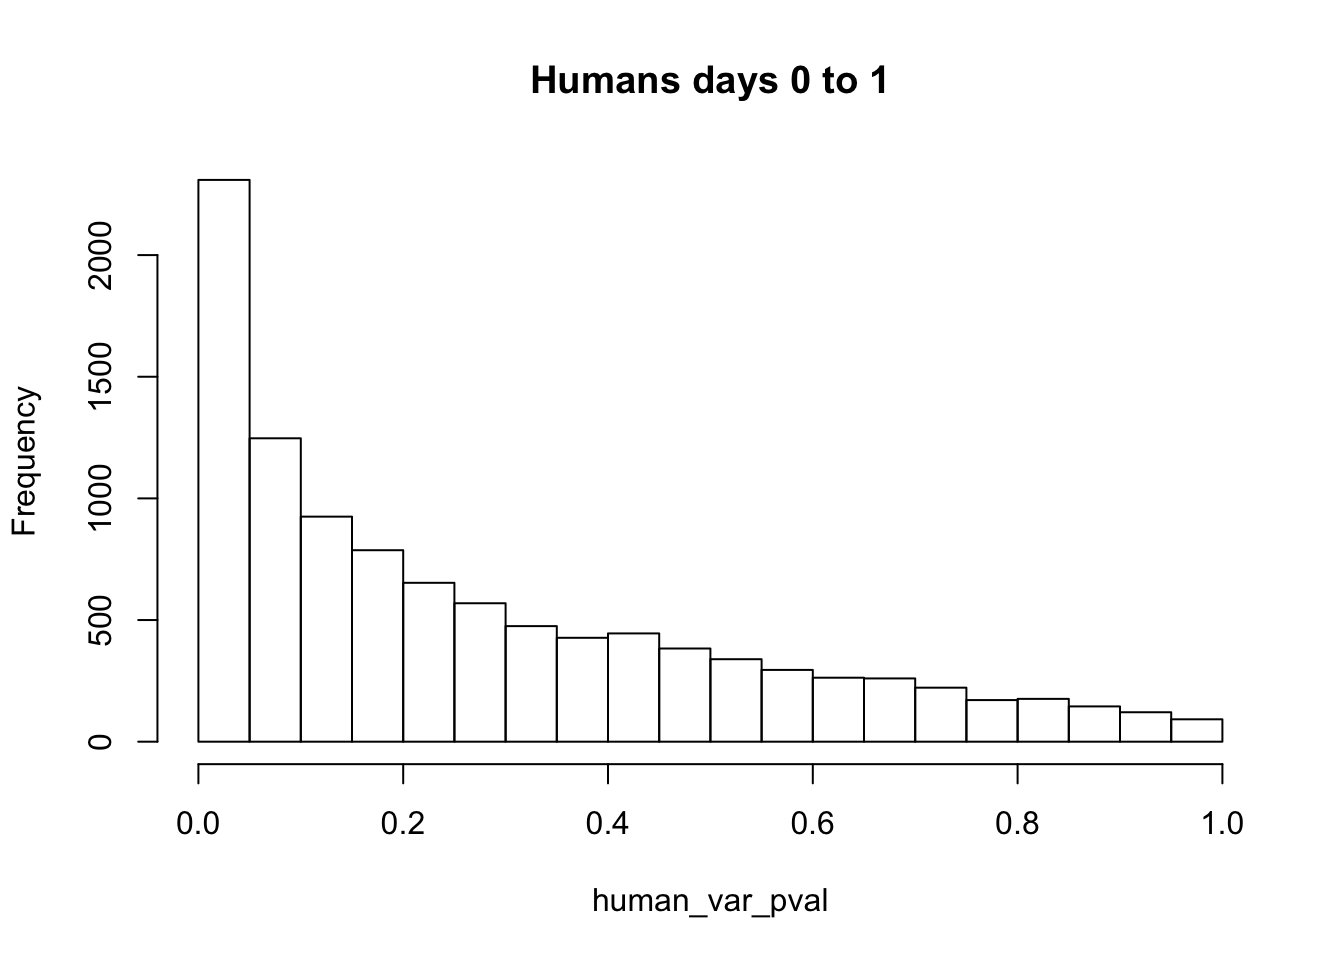
length(which(human_var_pval < 0.05))[1] 2309# Go from unadjusted to B.H. adjusted p-values
fdr_adj <- p.adjust(human_var_pval, method = c("fdr") )
summary(fdr_adj) Min. 1st Qu. Median Mean 3rd Qu. Max.
0.02558 0.23606 0.38498 0.42280 0.58436 0.99874 # How many B.H. adjusted p-values < 0.05?
length(which(fdr_adj < 0.05))[1] 22# Plot the unadjusted versus adjusted p-values
plot(human_var_pval, fdr_adj, xlim = c(0,1), ylim = c(0,1), xlab = c("p-value of the F-test"), ylab = c("BH-adj p-value"), main = c("F test results from Human samples Day 0 to 1"))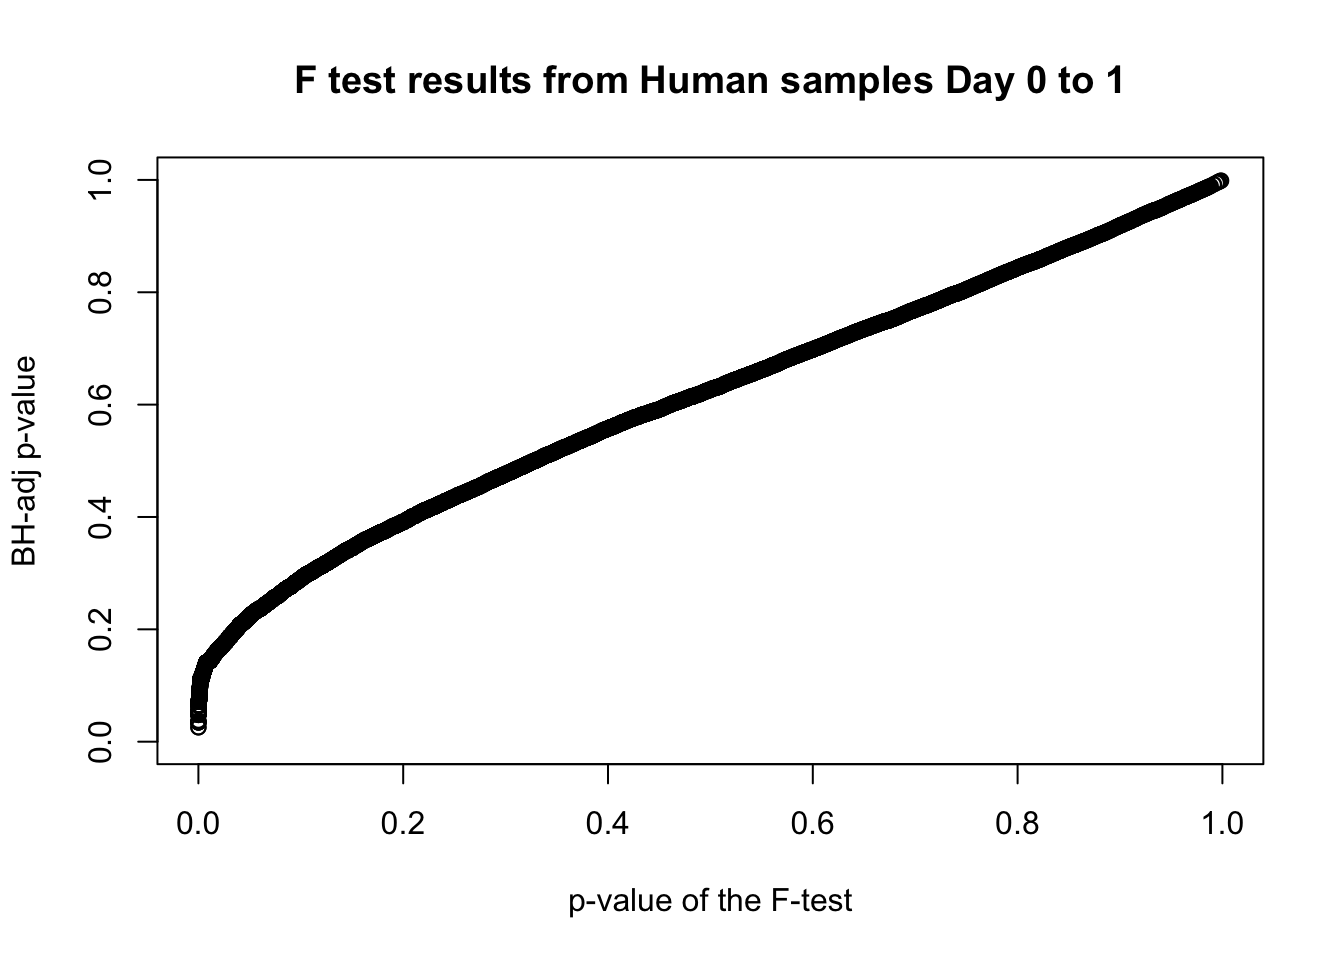
# Obtain Storey's pi_0
boot_pi0 <- qvalue(p=human_var_pval, pi0.method="bootstrap", fdr.level=NULL, robust=TRUE)$pi0
qvalue(p=human_var_pval, pi0.method="bootstrap", fdr.level=NULL, robust=TRUE)$pi0[1] 0.2316253boot_pi0s <- qvalue(p=human_var_pval, pi0.method="smoother", fdr.level=NULL, robust=TRUE)$pi0
qvalue(p=human_var_pval, pi0.method="smoother", fdr.level=NULL, robust=TRUE)$pi0[1] 0.174912# Obtain pi_1 based on Storey's pi_0
1-qvalue(p=human_var_pval, pi0.method="bootstrap", fdr.level=NULL, robust=TRUE)$pi0[1] 0.76837471-qvalue(p=human_var_pval, pi0.method="smoother", fdr.level=NULL, robust=TRUE)$pi0[1] 0.825088length(which(human_var_pval < 0.05))*(1-qvalue(p=human_var_pval, pi0.method="bootstrap", fdr.level=NULL, robust=TRUE)$pi0)[1] 1774.177p4 <- ggplot(human_var_pval_red01, aes(human_var_pval_red01[,1])) + geom_histogram(aes(y = ..density..), fill="white", colour="black", breaks=seq(0, 1, by = 0.02)) + theme_bw() + ggtitle("Days 0 to 1") + theme(plot.title = element_text(face = "bold")) +
scale_x_continuous(limits = c(0,1)) + labs(x = "Unadjusted p-values") + labs(y = "Density") +
geom_hline(yintercept = boot_pi0, size=2.5, colour = "#00A4F4") + scale_y_continuous(labels=scaleFUN) +
annotate("text", label='bold(bolditalic(hat(pi)[0][", human"])=="0.23")', parse=TRUE, x=0.80, y=(2), size = 6, colour = "#00A4F4")
p4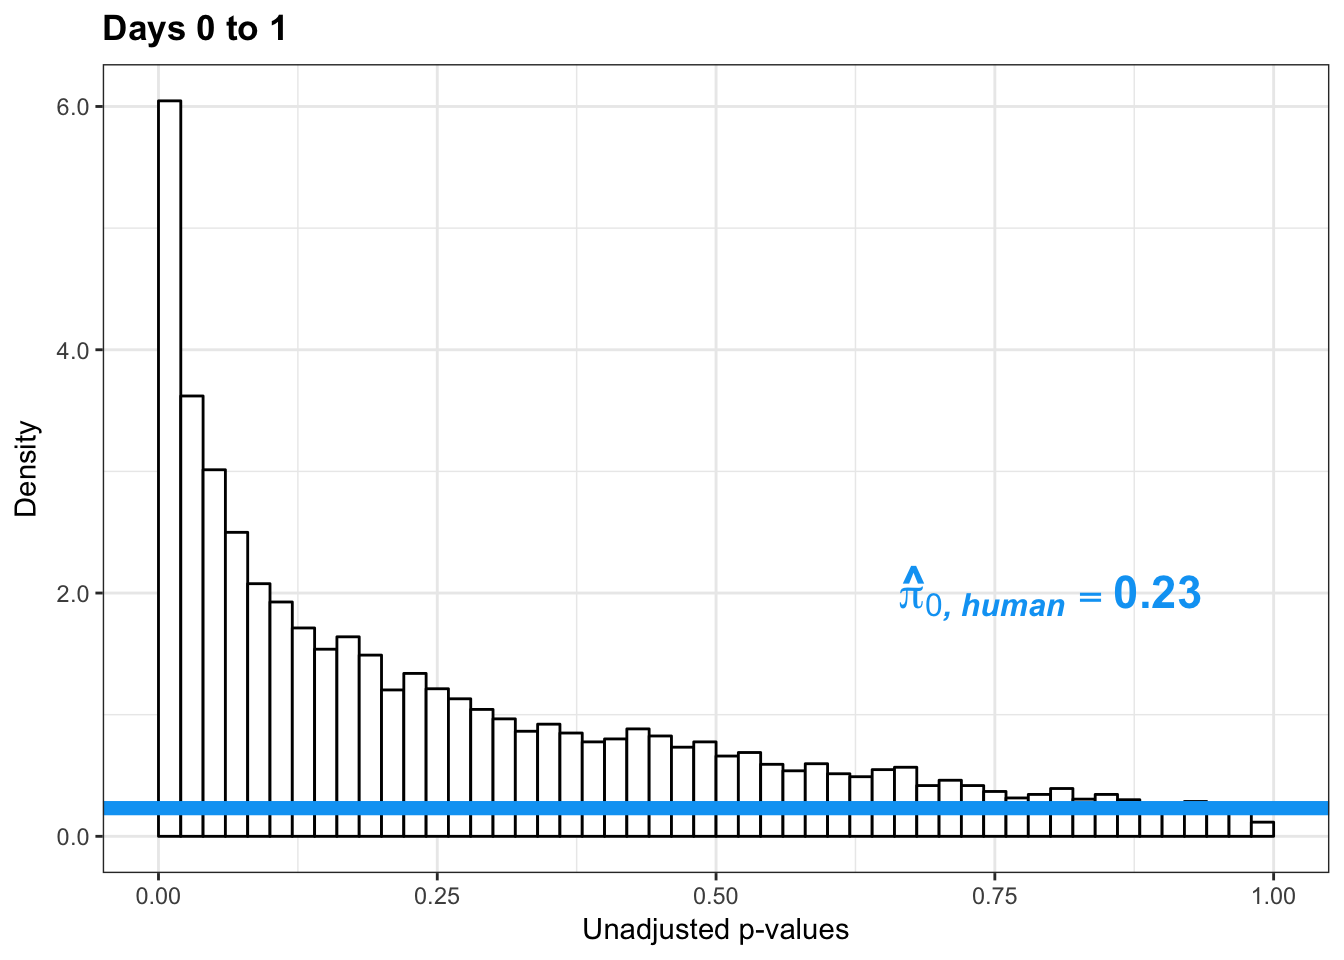
p4s <- ggplot(human_var_pval_red01, aes(human_var_pval_red01[,1])) + geom_histogram(aes(y = ..density..), fill="white", colour="black", breaks=seq(0, 1, by = 0.02)) + theme_bw() + ggtitle("Days 0 to 1") + theme(plot.title = element_text(face = "bold")) +
scale_x_continuous(limits = c(0,1)) + labs(x = "Unadjusted p-values") + labs(y = "Density") + geom_hline(yintercept = boot_pi0s, size=2.5, colour = "#00A4F4") + scale_y_continuous(labels=scaleFUN) +
annotate("text", label='bold(bolditalic(hat(pi)[0][", human"])=="0.17")', parse=TRUE, x=0.80, y=(2), size = 6, colour = "#00A4F4") + bjp
p4s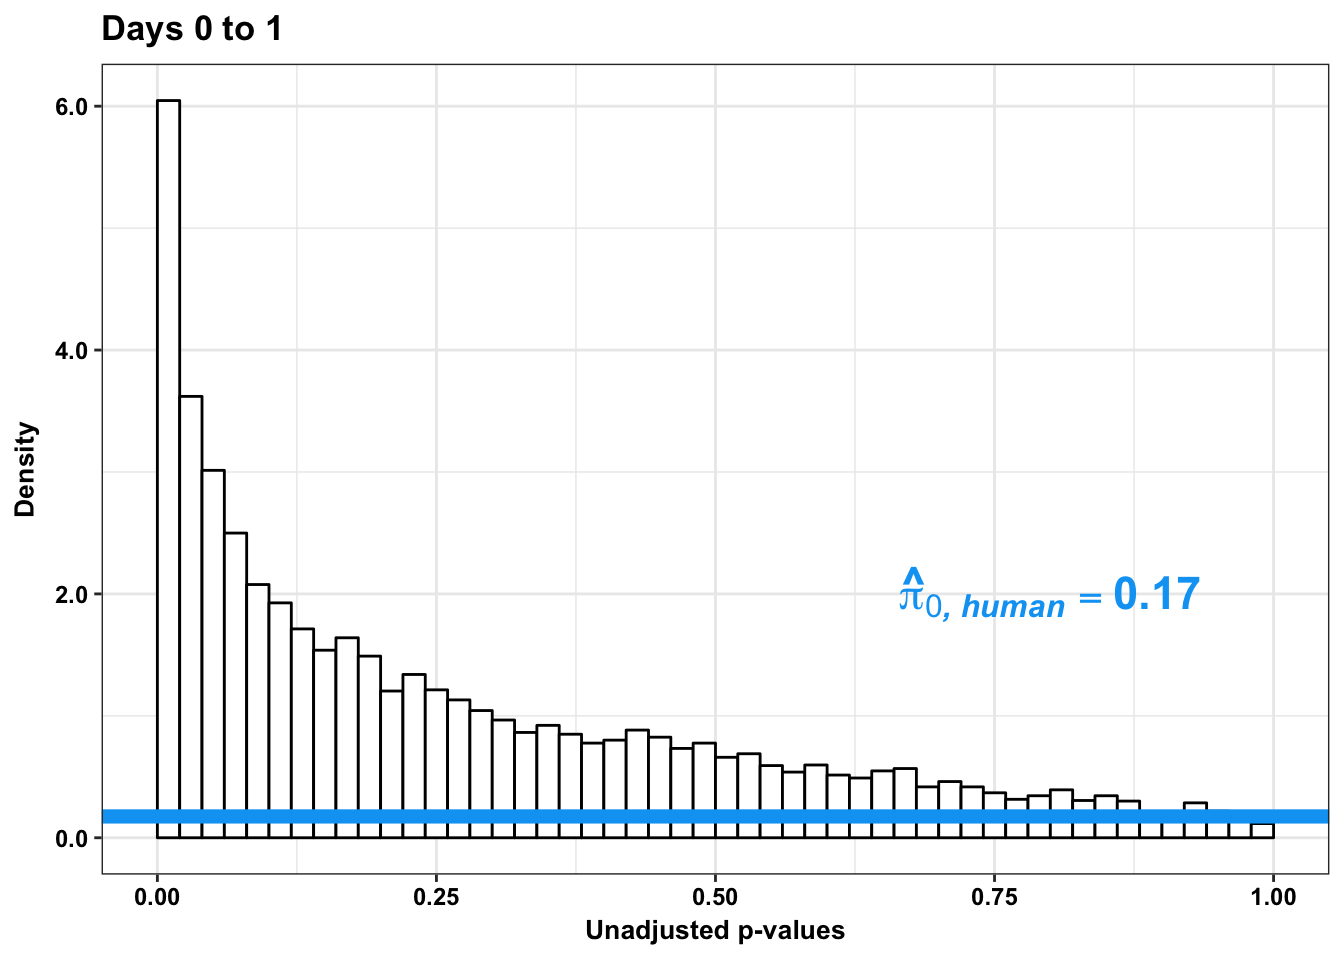
pval <- human_var_pval_red01[,1]
resp <- rep(c("Days 0 to 1"), times = 10304)
line <- rep(c("0.23"), times = 10304)
figS12A <- cbind(pval, resp, line)Testing humans reduction in variance from days 1 to 2
human_var_pval <- array(NA, dim = c(10304, 1))
for(i in 1:10304){
x <- t(mean_tech_reps[i,11:16])
y <- t(mean_tech_reps[i,21:26])
htest <- var.test(x, y, alternative = c("greater"))
human_var_pval[i,1] <- htest$p.value
}
human_var_pval_red12 <- as.data.frame(human_var_pval)
# Make a histogram of the unadjusted p-values
hist(human_var_pval, main = c("Humans days 1 to 2"))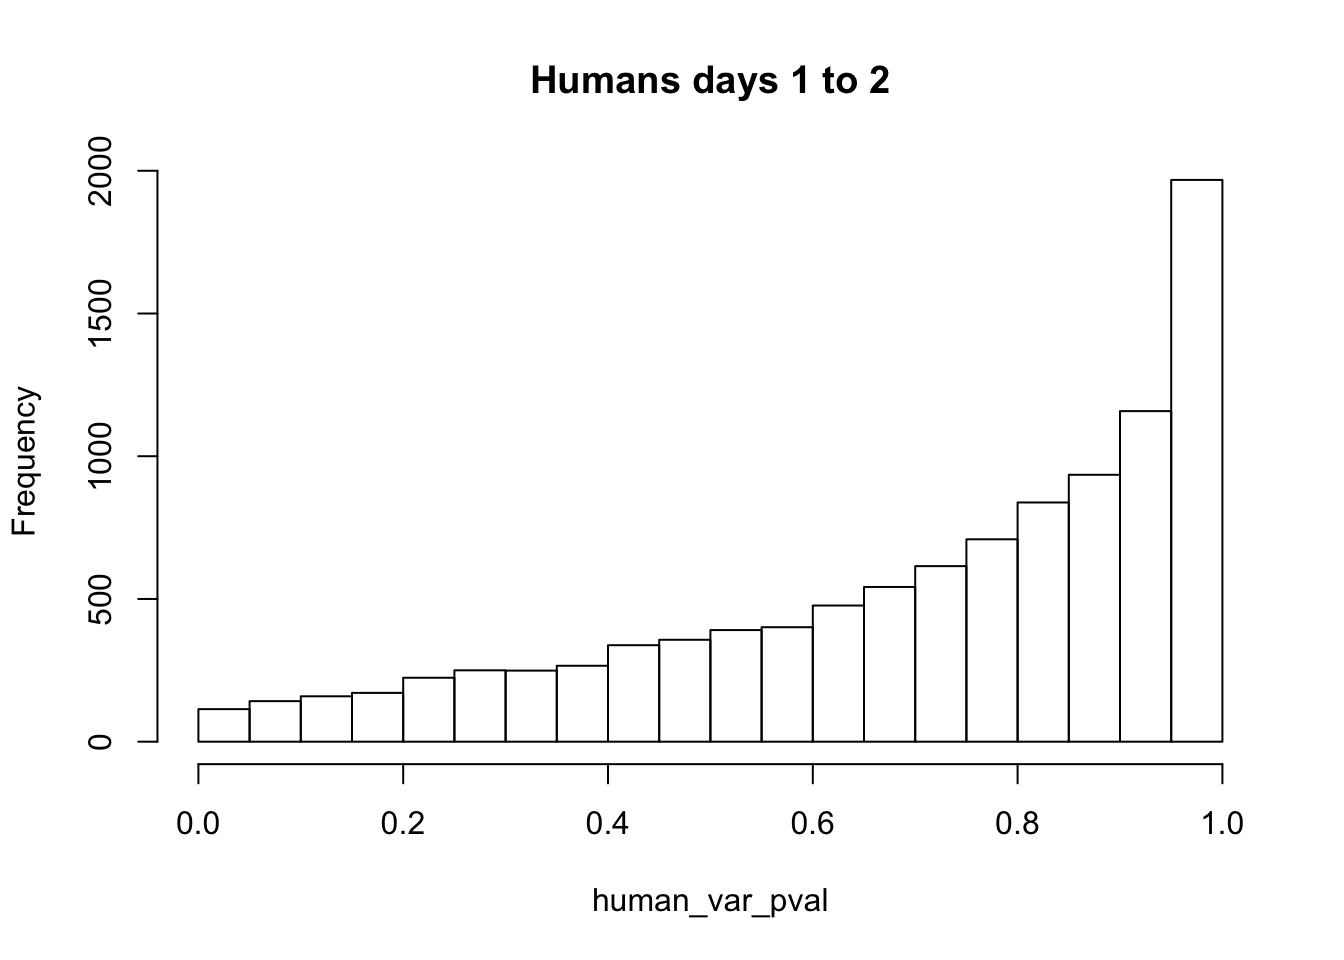
length(which(human_var_pval < 0.05))[1] 114# Go from unadjusted to B.H. adjusted p-values
fdr_adj <- p.adjust(human_var_pval, method = c("fdr") )
summary(fdr_adj) Min. 1st Qu. Median Mean 3rd Qu. Max.
1 1 1 1 1 1 # How many B.H. adjusted p-values < 0.05?
length(which(fdr_adj < 0.05))[1] 0# Plot the unadjusted versus adjusted p-values
plot(human_var_pval, fdr_adj, xlim = c(0,1), ylim = c(0,1), xlab = c("p-value of the F-test"), ylab = c("BH-adj p-value"), main = c("F test results from Human samples Day 1 to 2"))
# Obtain Storey's pi_0
boot_pi0 <- qvalue(p=human_var_pval, pi0.method="bootstrap", fdr.level=NULL, robust=TRUE)$pi0
qvalue(p=human_var_pval, pi0.method="bootstrap", fdr.level=NULL, robust=TRUE)$pi0[1] 1boot_pi0s <- qvalue(p=human_var_pval, pi0.method="smoother", fdr.level=NULL, robust=TRUE)$pi0
qvalue(p=human_var_pval, pi0.method="smoother", fdr.level=NULL, robust=TRUE)$pi0[1] 1# Obtain pi_1 based on Storey's pi_0
1-qvalue(p=human_var_pval, pi0.method="bootstrap", fdr.level=NULL, robust=TRUE)$pi0[1] 01-qvalue(p=human_var_pval, pi0.method="smoother", fdr.level=NULL, robust=TRUE)$pi0[1] 0length(which(human_var_pval < 0.05))*(1-qvalue(p=human_var_pval, pi0.method="bootstrap", fdr.level=NULL, robust=TRUE)$pi0)[1] 0p5 <- ggplot(human_var_pval_red12, aes(human_var_pval_red12[,1])) + geom_histogram(aes(y = ..density..), fill="white", colour="black", breaks=seq(0, 1, by = 0.02)) + theme_bw() + ggtitle("Days 1 to 2") + theme_bw() +
scale_x_continuous(limits = c(0,1)) + labs(x = "Unadjusted p-values") + labs(y = "Density") + scale_y_continuous(labels=scaleFUN) + theme(plot.title = element_text(face = "bold"))
p5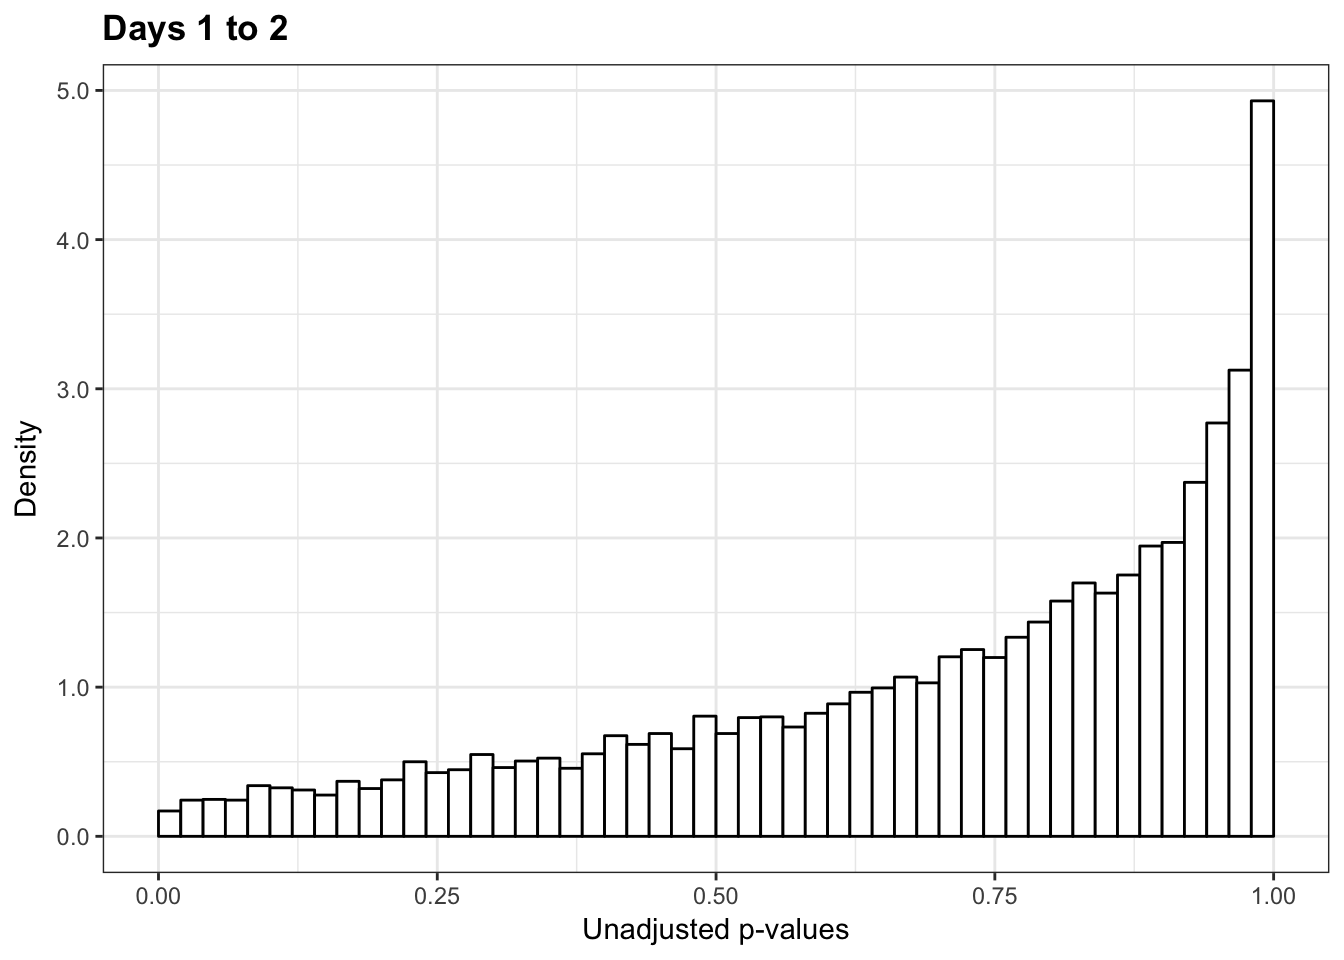
p5s <- ggplot(human_var_pval_red12, aes(human_var_pval_red12[,1])) + geom_histogram(aes(y = ..density..), fill="white", colour="black", breaks=seq(0, 1, by = 0.02)) + theme_bw() + ggtitle("Days 1 to 2") + theme_bw() +
scale_x_continuous(limits = c(0,1)) + labs(x = "Unadjusted p-values") + labs(y = "Density") + scale_y_continuous(labels=scaleFUN) + theme(plot.title = element_text(face = "bold")) + bjp
p5s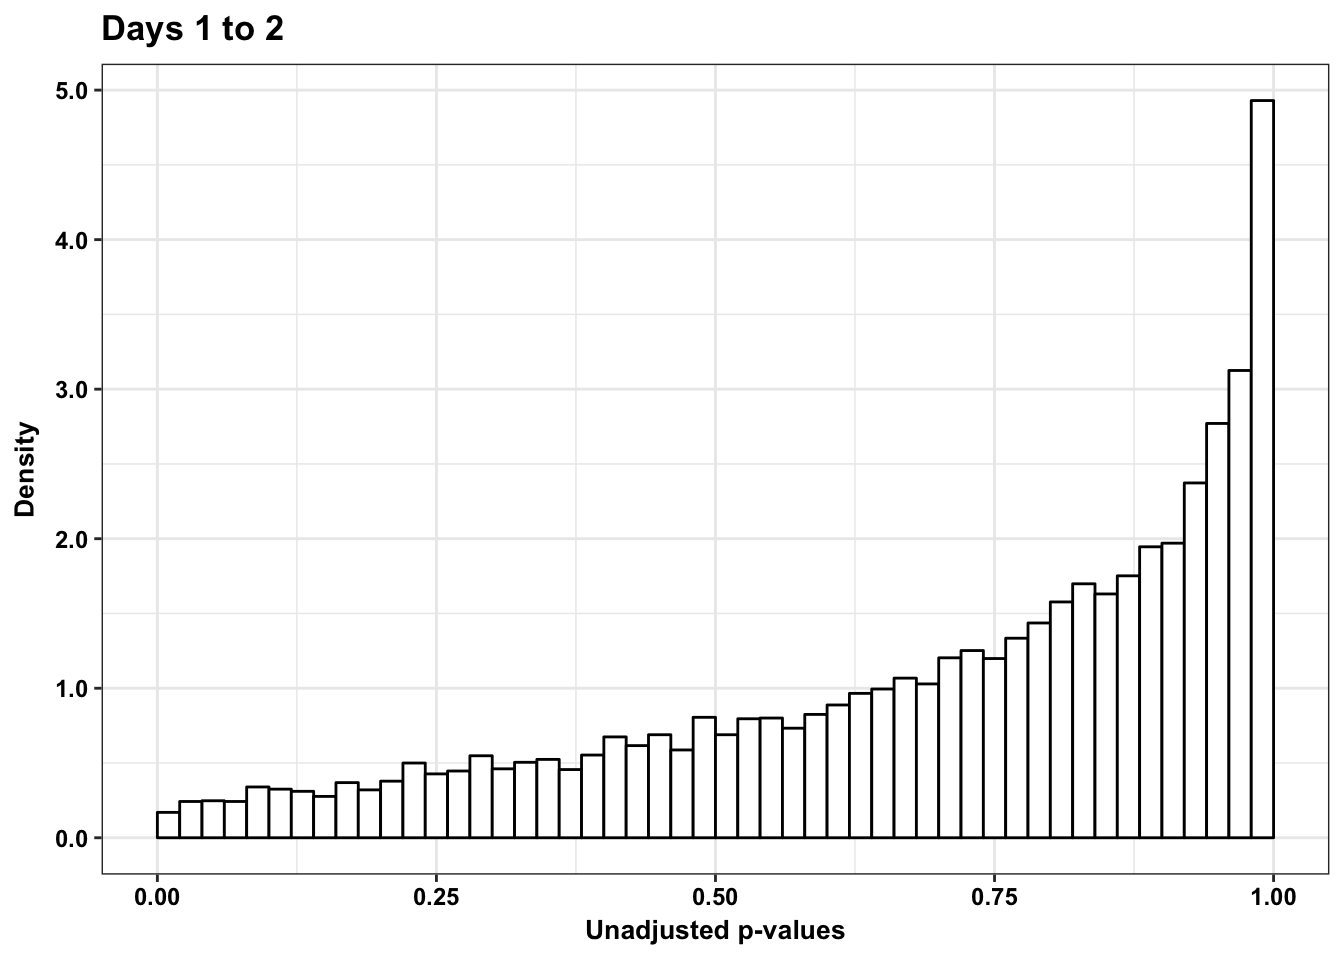
pval <- human_var_pval_red12[,1]
resp <- rep(c("Days 1 to 2"), times = 10304)
line <- rep(c("NA"), times = 10304)
figS12A_fig <- cbind(pval, resp, line)
figS12A <- rbind(figS12A, figS12A_fig)Testing humans reduction in variance from days 2 to 3
human_var_pval <- array(NA, dim = c(10304, 1))
for(i in 1:10304){
x <- t(mean_tech_reps[i,21:26])
y <- t(mean_tech_reps[i,31:36])
htest <- var.test(x, y, alternative = c("greater"))
human_var_pval[i,1] <- htest$p.value
}
human_var_pval_red23 <- as.data.frame(human_var_pval)
# Make a histogram of the unadjusted p-values
hist(human_var_pval, main = c("Humans days 0 to 1"))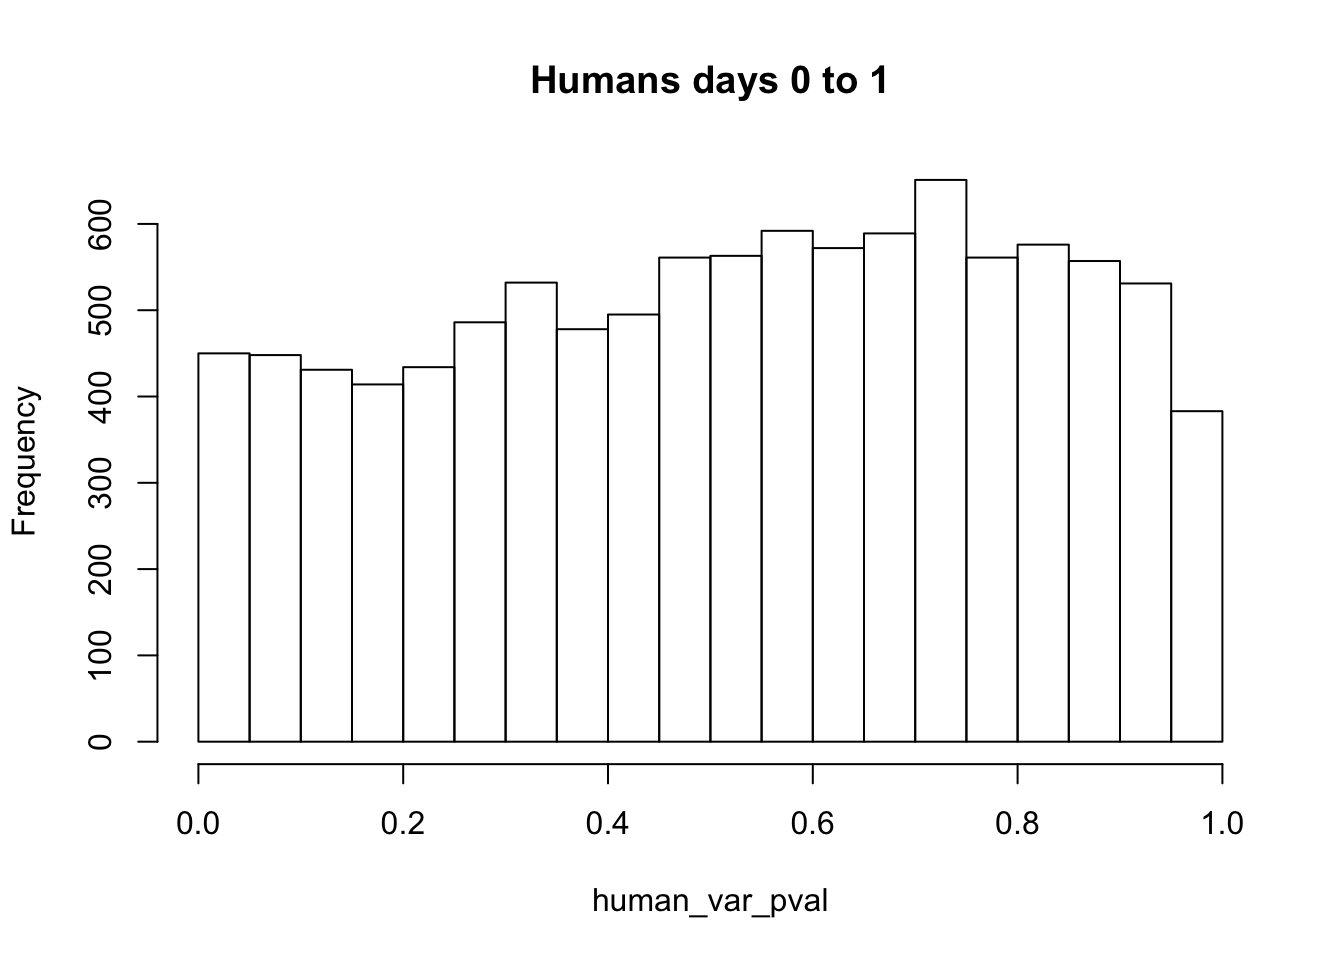
length(which(human_var_pval < 0.05))[1] 450# Go from unadjusted to B.H. adjusted p-values
fdr_adj <- p.adjust(human_var_pval, method = c("fdr") )
summary(fdr_adj) Min. 1st Qu. Median Mean 3rd Qu. Max.
0.2764 0.9855 0.9855 0.9850 0.9855 0.9997 # How many B.H. adjusted p-values < 0.05?
length(which(fdr_adj < 0.05))[1] 0# Plot the unadjusted versus adjusted p-values
plot(human_var_pval, fdr_adj, xlim = c(0,1), ylim = c(0,1), xlab = c("p-value of the F-test"), ylab = c("BH-adj p-value"), main = c("F test results from Human samples Day 2 to 3"))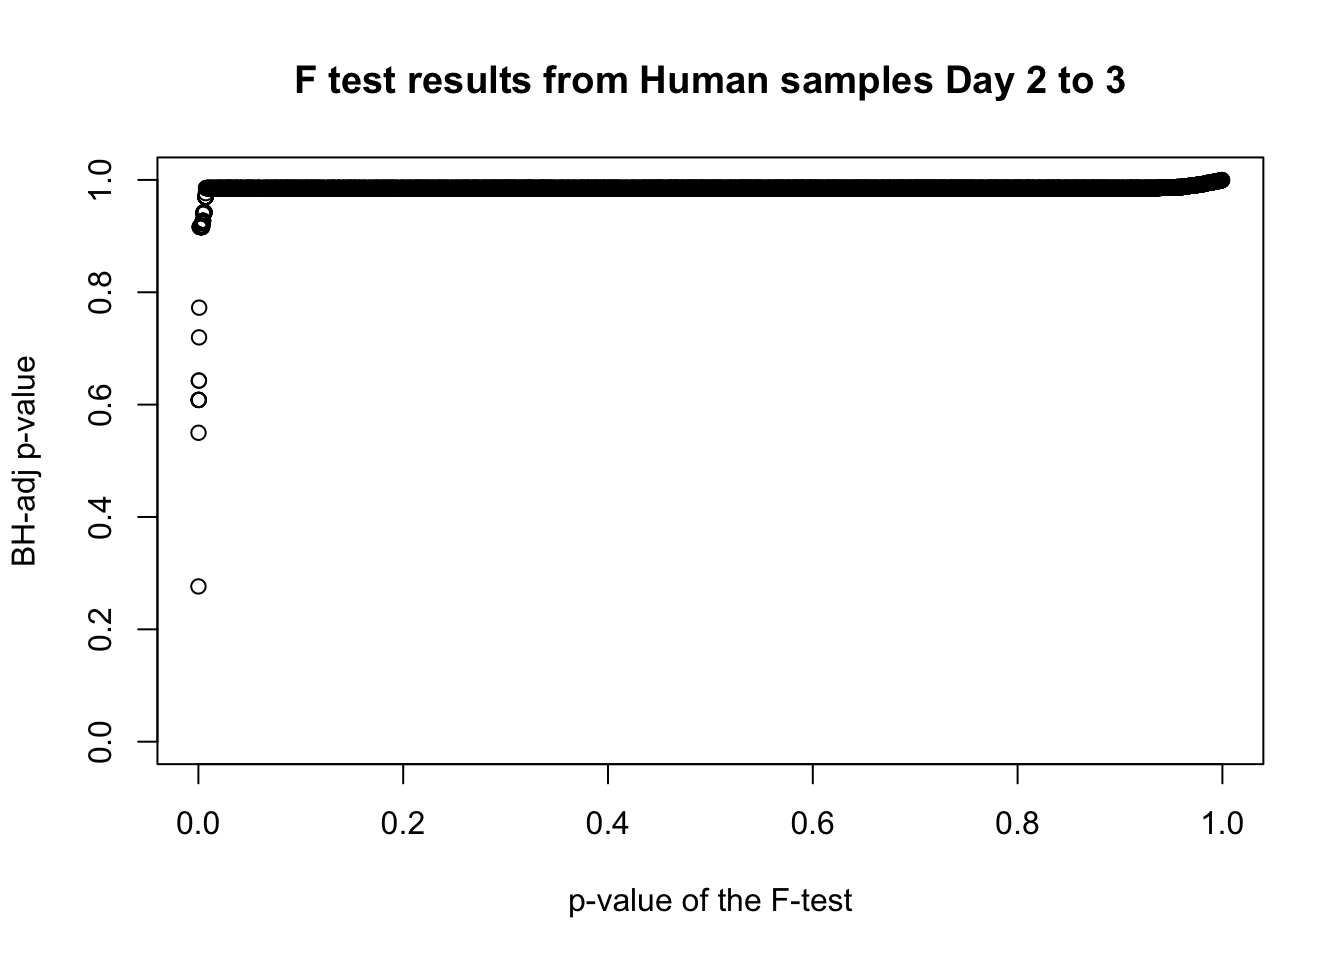
# Obtain Storey's pi_0
boot_pi0 <- qvalue(p=human_var_pval, pi0.method="bootstrap", fdr.level=NULL, robust=TRUE)$pi0
qvalue(p=human_var_pval, pi0.method="bootstrap", fdr.level=NULL, robust=TRUE)$pi0[1] 0.951734boot_pi0s <- qvalue(p=human_var_pval, pi0.method="smoother", fdr.level=NULL, robust=TRUE)$pi0
qvalue(p=human_var_pval, pi0.method="smoother", fdr.level=NULL, robust=TRUE)$pi0[1] 0.8664877# Obtain pi_1 based on Storey's pi_0
1-qvalue(p=human_var_pval, pi0.method="bootstrap", fdr.level=NULL, robust=TRUE)$pi0[1] 0.048266051-qvalue(p=human_var_pval, pi0.method="smoother", fdr.level=NULL, robust=TRUE)$pi0[1] 0.1335123length(which(human_var_pval < 0.05))*(1-qvalue(p=human_var_pval, pi0.method="bootstrap", fdr.level=NULL, robust=TRUE)$pi0)[1] 21.71972p6 <- ggplot(human_var_pval_red23, aes(human_var_pval_red23[,1])) + geom_histogram(aes(y = ..density..), fill="white", colour="black", breaks=seq(0, 1, by = 0.02)) + theme_bw() + ggtitle("Days 2 to 3") + theme(plot.title = element_text(face = "bold")) + scale_y_continuous(labels=scaleFUN) +
scale_x_continuous(limits = c(0,1)) + labs(x = "Unadjusted p-values") + labs(y = "Density")
p6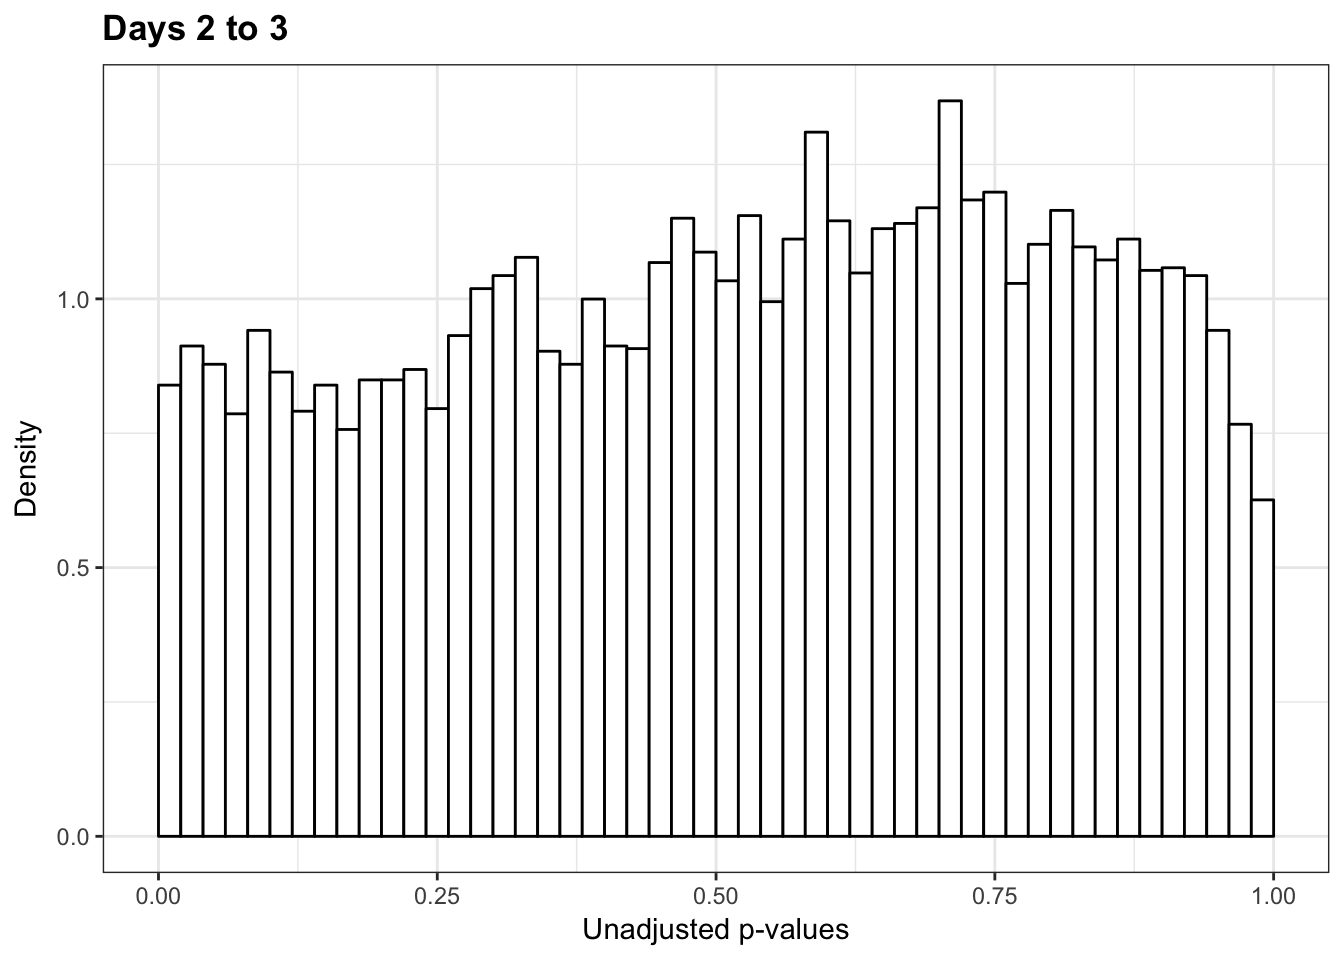
p6s <- ggplot(human_var_pval_red23, aes(human_var_pval_red23[,1])) + geom_histogram(aes(y = ..density..), fill="white", colour="black", breaks=seq(0, 1, by = 0.02)) + theme_bw() + ggtitle("Days 2 to 3") + theme(plot.title = element_text(face = "bold")) +
scale_x_continuous(limits = c(0,1)) + labs(x = "Unadjusted p-values") + labs(y = "Density") + scale_y_continuous(labels=scaleFUN) + bjp
p6s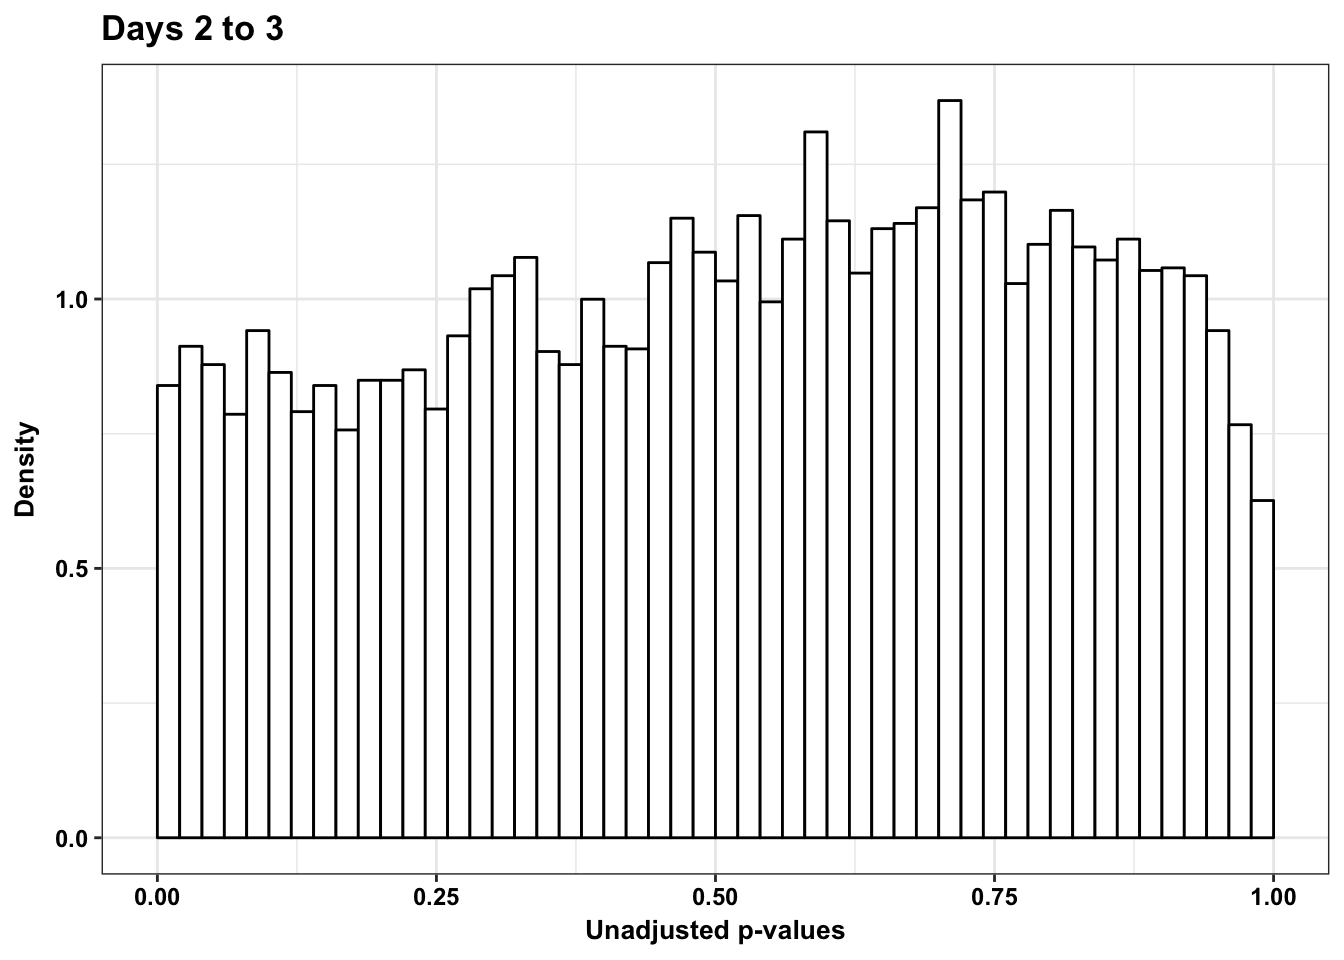
pval <- human_var_pval_red23[,1]
resp <- rep(c("Days 2 to 3"), times = 10304)
line <- rep(c("NA"), times = 10304)
figS12A_fig <- cbind(pval, resp, line)
figS12A <- rbind(figS12A, figS12A_fig)Testing humans reduction in variance from days 1 to 3
human_var_pval <- array(NA, dim = c(10304, 1))
for(i in 1:10304){
x <- t(mean_tech_reps[i,11:16])
y <- t(mean_tech_reps[i,31:36])
htest <- var.test(x, y, alternative = c("greater"))
human_var_pval[i,1] <- htest$p.value
}
human_var_pval_red13 <- as.data.frame(human_var_pval)
# Make a histogram of the unadjusted p-values
hist(human_var_pval, main = c("Humans days 0 to 1"))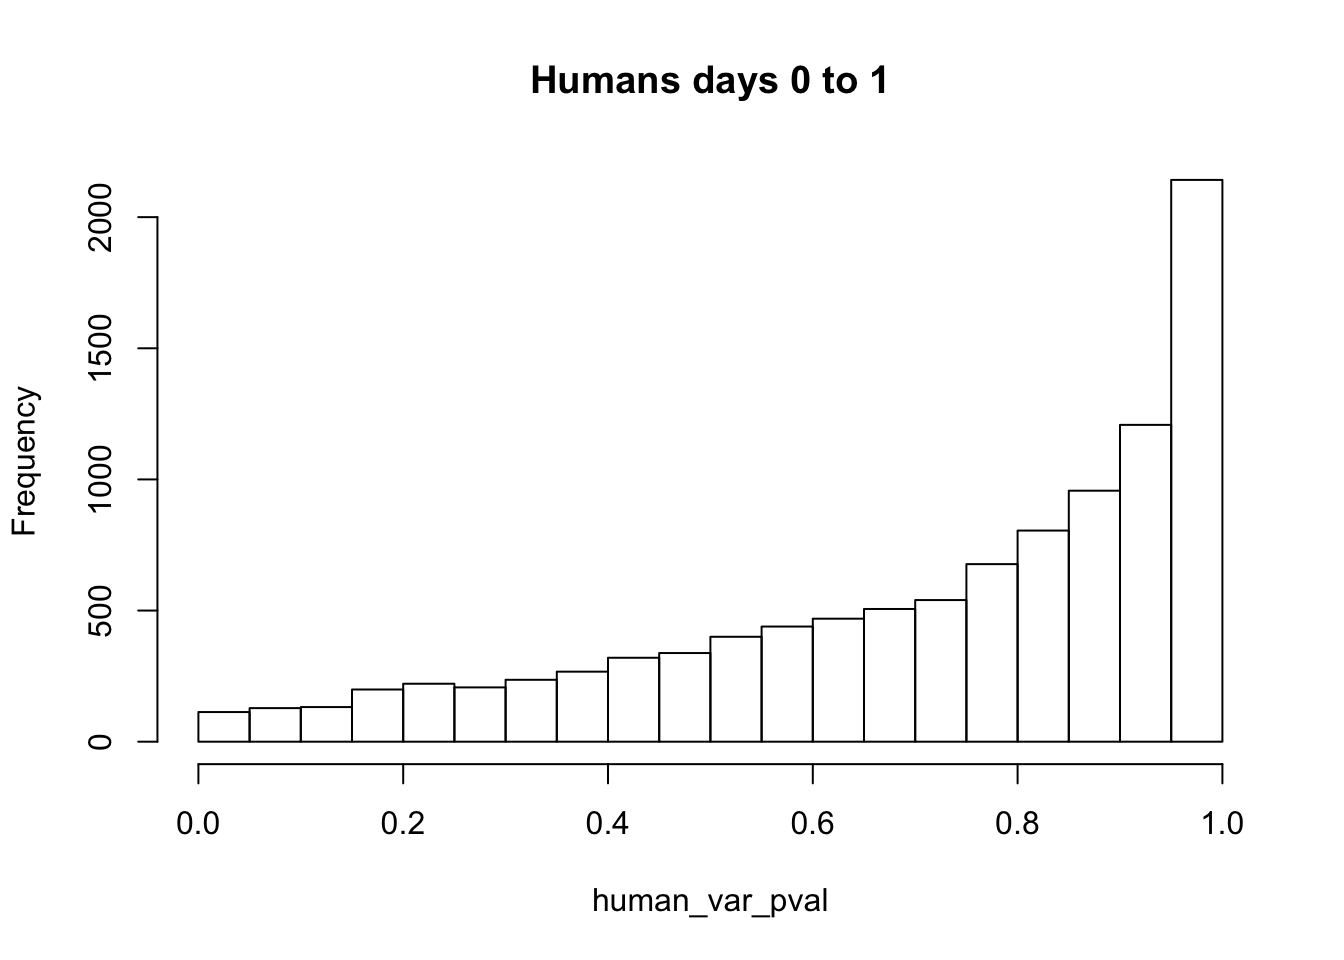
# Go from unadjusted to B.H. adjusted p-values
fdr_adj <- p.adjust(human_var_pval, method = c("fdr") )
summary(fdr_adj) Min. 1st Qu. Median Mean 3rd Qu. Max.
1 1 1 1 1 1 # How many B.H. adjusted p-values < 0.05?
length(which(fdr_adj < 0.05))[1] 0# Plot the unadjusted versus adjusted p-values
plot(human_var_pval, fdr_adj, xlim = c(0,1), ylim = c(0,1), xlab = c("p-value of the F-test"), ylab = c("BH-adj p-value"), main = c("F test results from Human samples Day 2 to 3"))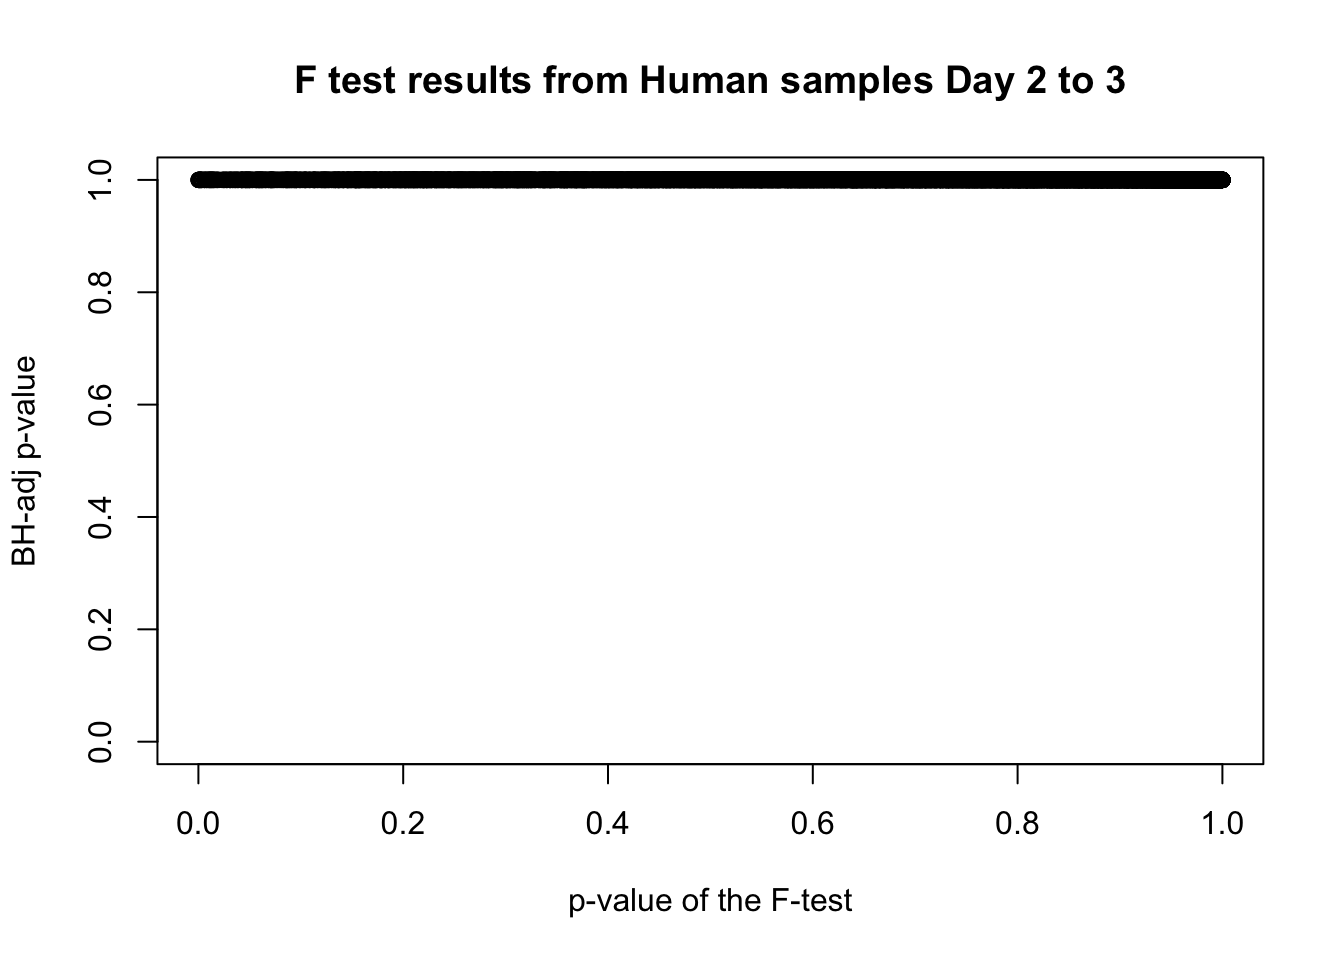
# Obtain Storey's pi_0
boot_pi0 <- qvalue(p=human_var_pval, pi0.method="bootstrap", fdr.level=NULL, robust=TRUE)$pi0
qvalue(p=human_var_pval, pi0.method="bootstrap", fdr.level=NULL, robust=TRUE)$pi0[1] 1boot_pi0s <- qvalue(p=human_var_pval, pi0.method="smoother", fdr.level=NULL, robust=TRUE)$pi0
qvalue(p=human_var_pval, pi0.method="smoother", fdr.level=NULL, robust=TRUE)$pi0[1] 1# Obtain pi_1 based on Storey's pi_0
1-qvalue(p=human_var_pval, pi0.method="bootstrap", fdr.level=NULL, robust=TRUE)$pi0[1] 01-qvalue(p=human_var_pval, pi0.method="smoother", fdr.level=NULL, robust=TRUE)$pi0[1] 0length(which(human_var_pval < 0.05))*(1-qvalue(p=human_var_pval, pi0.method="bootstrap", fdr.level=NULL, robust=TRUE)$pi0)[1] 0p6_13 <- ggplot(human_var_pval_red13, aes(human_var_pval_red13[,1])) + geom_histogram(aes(y = ..density..), fill="white", colour="black", breaks=seq(0, 1, by = 0.02)) + theme_bw() + ggtitle("Days 1 to 3") + theme(plot.title = element_text(face = "bold")) + scale_y_continuous(labels=scaleFUN) +
scale_x_continuous(limits = c(0,1)) + labs(x = "Unadjusted p-values") + labs(y = "Density")
p6_13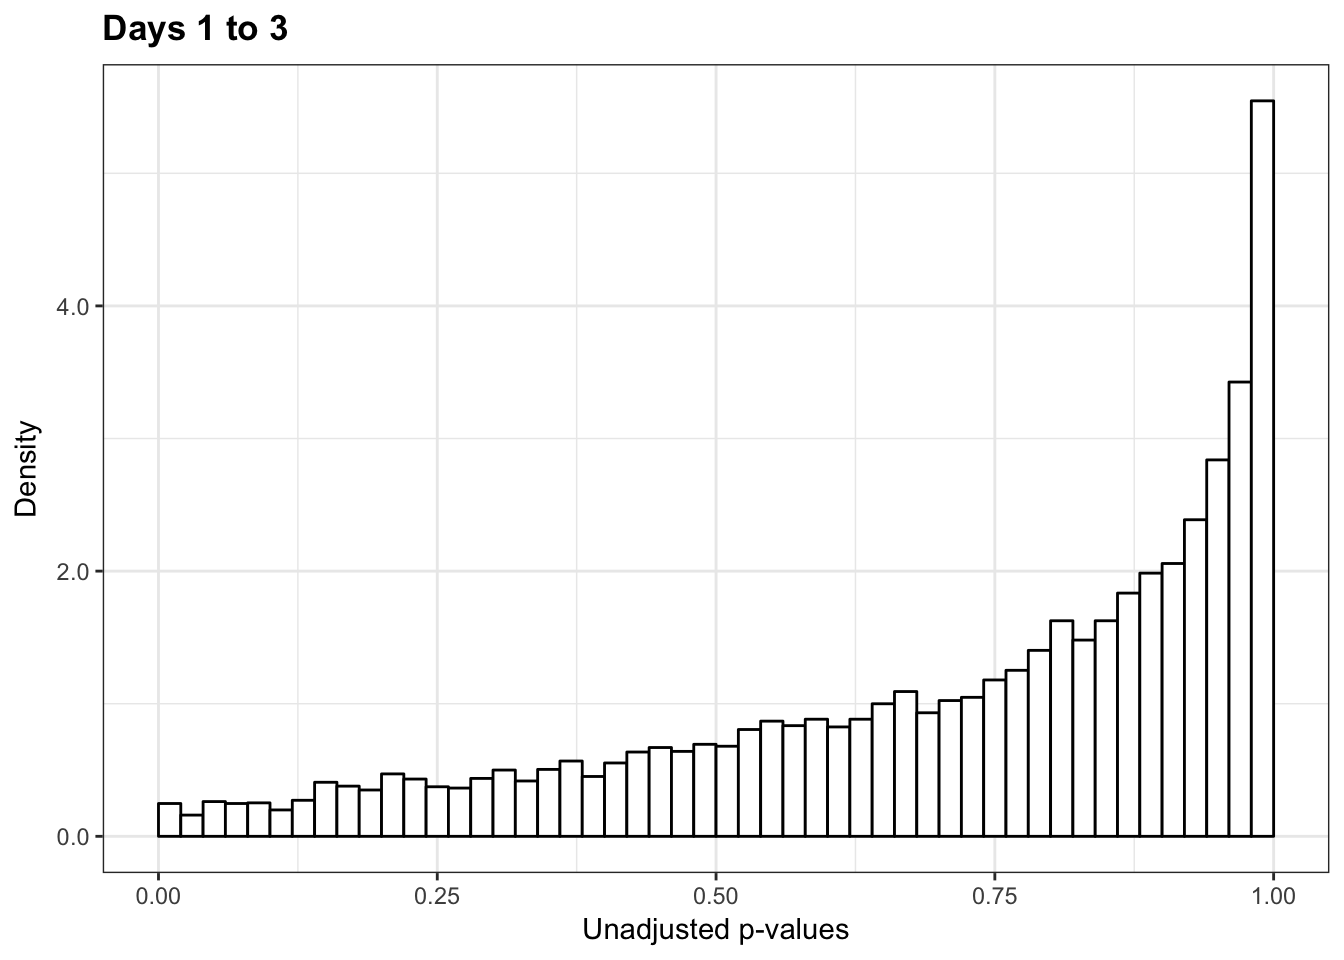
p6_13s <- ggplot(human_var_pval_red13, aes(human_var_pval_red13[,1])) + geom_histogram(aes(y = ..density..), fill="white", colour="black", breaks=seq(0, 1, by = 0.02)) + theme_bw() + ggtitle("Days 1 to 3") + theme(plot.title = element_text(face = "bold")) +
scale_x_continuous(limits = c(0,1)) + labs(x = "Unadjusted p-values") + labs(y = "Density") + scale_y_continuous(labels=scaleFUN) + bjp
p6_13s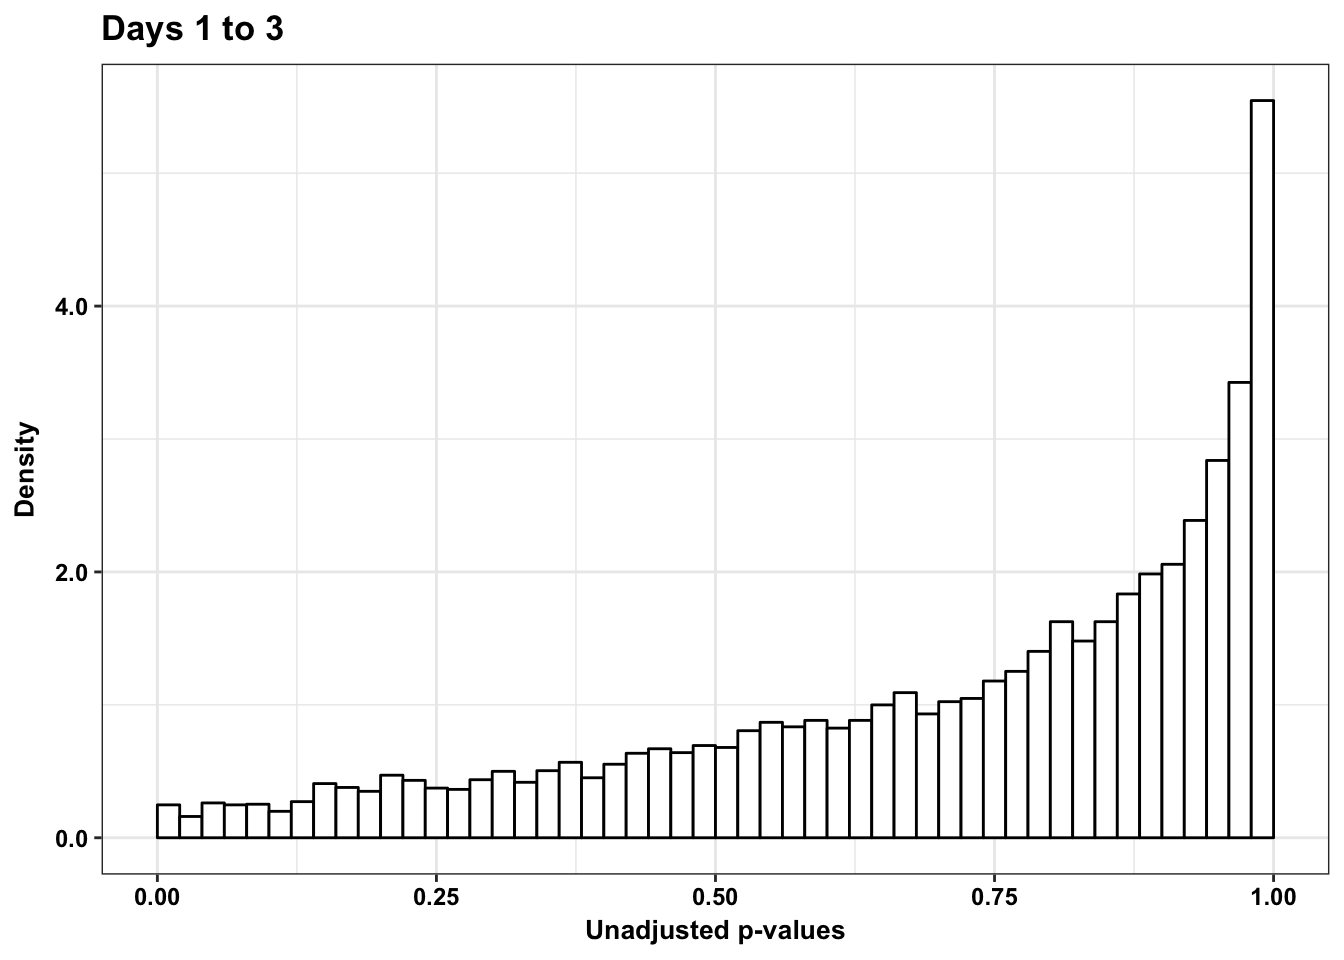
pval <- human_var_pval_red13[,1]
resp <- rep(c("Days 1 to 3"), times = 10304)
line <- rep(c("NA"), times = 10304)
figS12A_fig <- cbind(pval, resp, line)
figS12A <- rbind(figS12A, figS12A_fig)
write.table(figS12A, "/Users/laurenblake/Dropbox/Endoderm TC/Draft versions/Resubmit1_Genome Biology/Supplemental/Data_figS12B.txt", quote = FALSE, row.names = FALSE)Plot reduction in variation (pi_0 determined by a bootstrap method)
# Chimps on the top; humans on the bottom
multiplot(p1,p4,p2,p5,p3,p6,p3_13, p6_13, cols=4)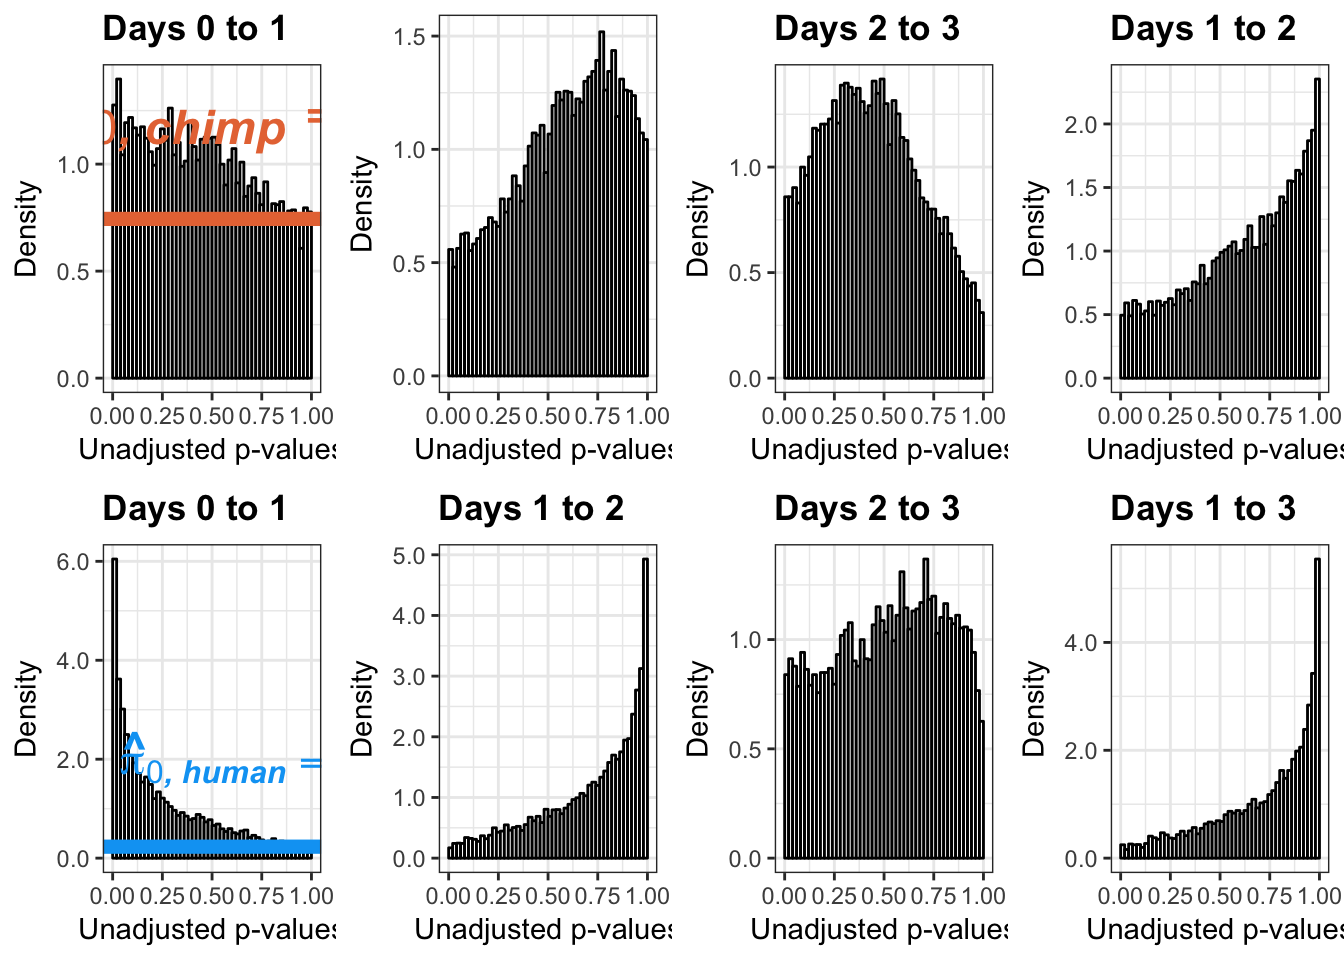
# Chimps on the left, humans on the right
#multiplot(p1,p2,p3,p3_13,p4,p5,p6, p6_13, cols=2)Plot reduction in variation (pi_0 determined by a smoother method)
# Chimps on the top; humans on the bottom
multiplot(p1s,p4s,p2s,p5s,p3s,p6s,p3_13s, p6_13s, cols=4)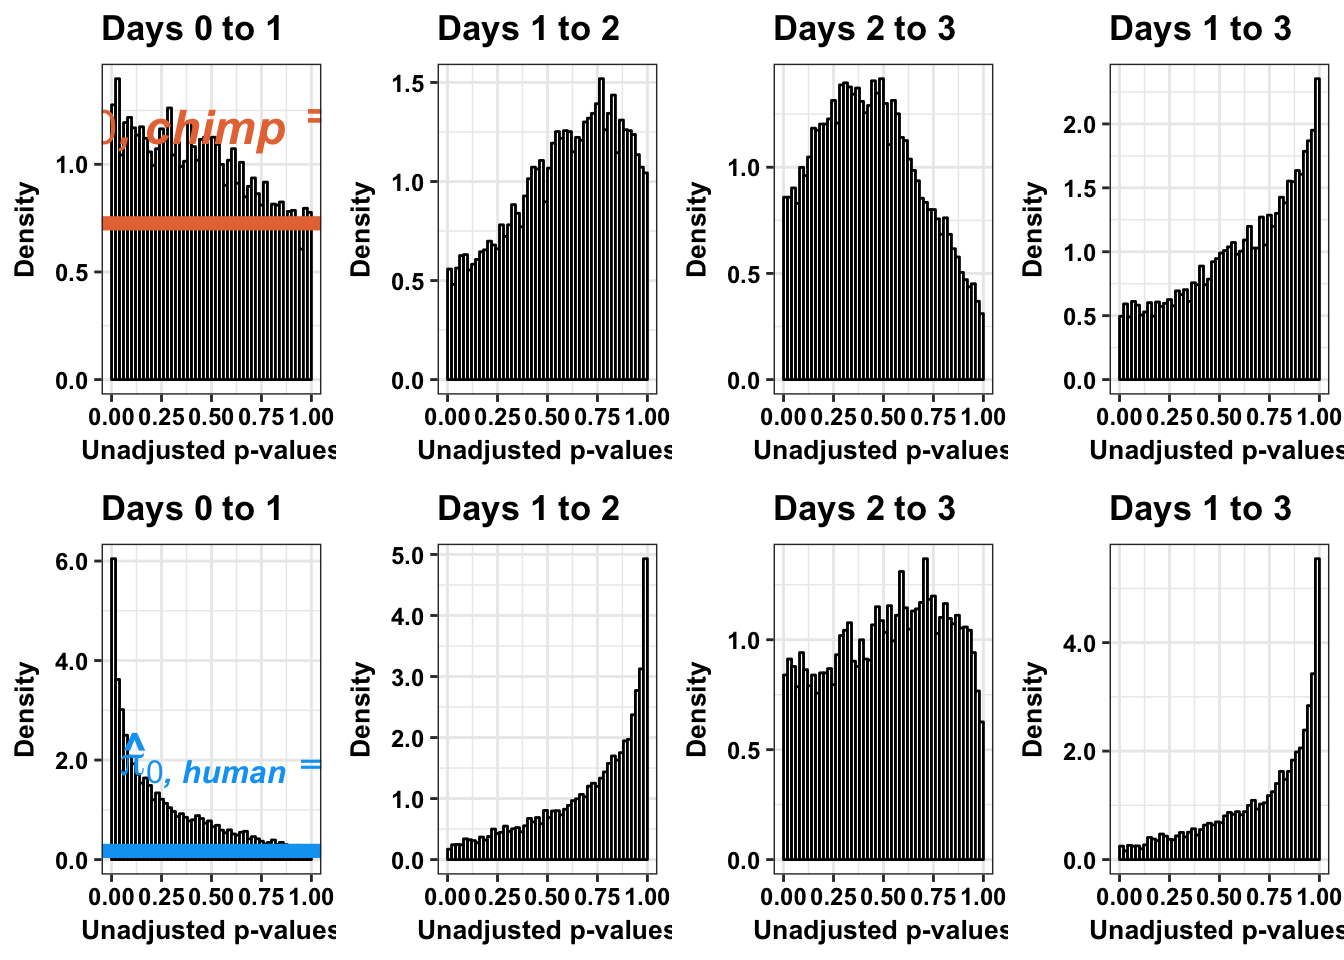
# Chimps on the left, humans on the right
#multiplot(p1s,p2s,p3s,p3_13s,p4s,p5s,p6s, p6_13s, cols=2)
# Chimps across
multiplot(p1s,p2s,p3s,p3_13s, cols=4)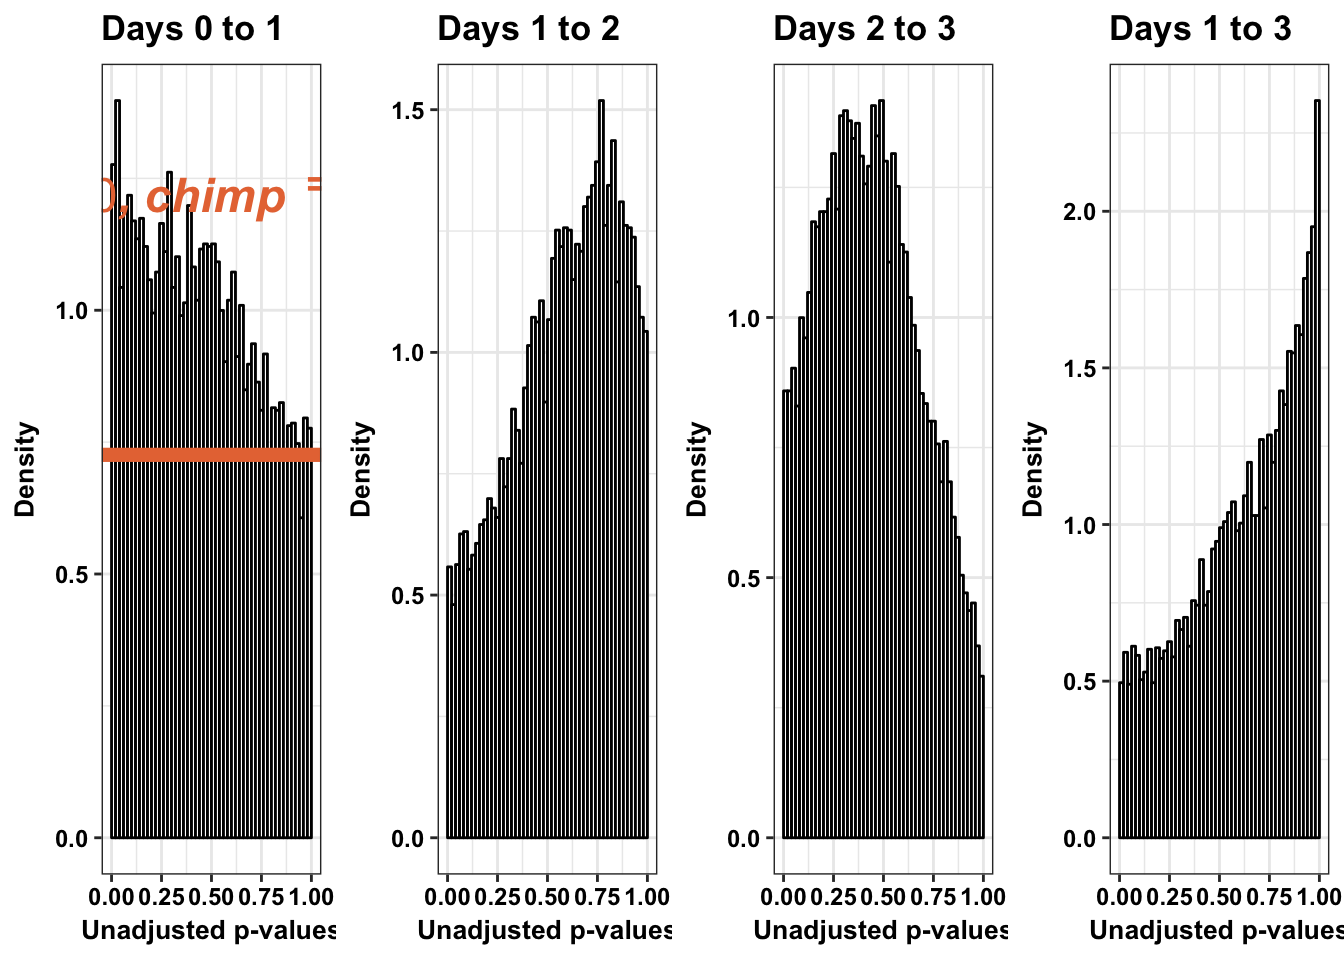
# Humans across
multiplot(p4s,p5s,p6s,p6_13s, cols=4)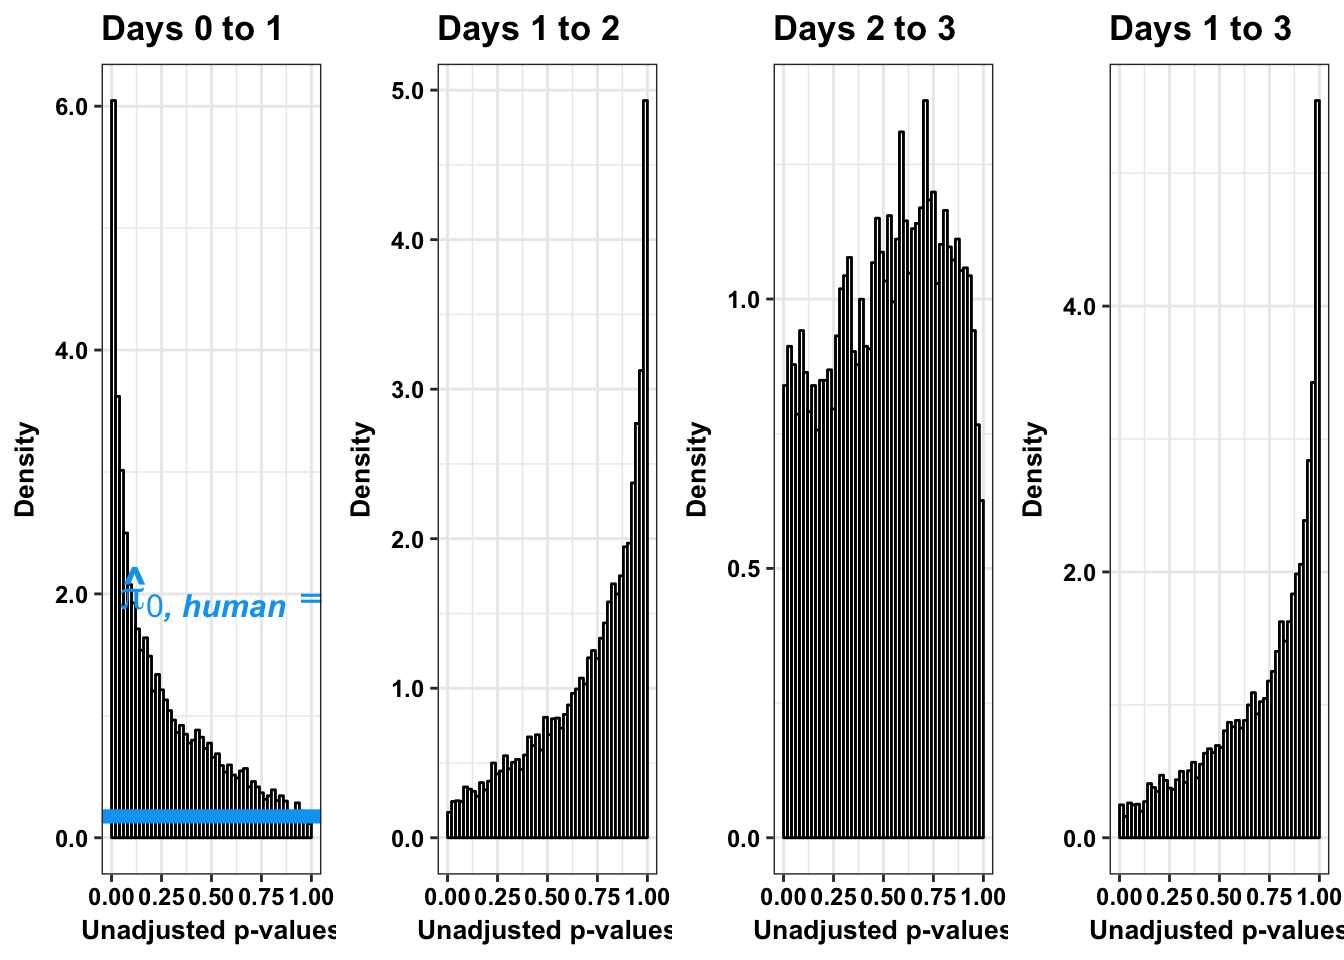
Number of significant genes and Storey’s pi_0 values for an increase in variation between days (main paper)
Chimpanzees
Testing chimps increase in variance from days 0 to 1
chimp_var_pval <- array(NA, dim = c(10304, 1))
for(i in 1:10304){
x <- t(mean_tech_reps[i,7:10])
y <- t(mean_tech_reps[i,17:20])
htest <- var.test(x, y, alternative = c("less"))
chimp_var_pval[i,1] <- htest$p.value
}
chimp_var_pval_inc01 <- as.data.frame(chimp_var_pval)
# Make a histogram of the unadjusted p-values
hist(chimp_var_pval)
# Go from unadjusted to B.H. adjusted p-values
fdr_adj <- p.adjust(chimp_var_pval, method = c("fdr") )

summary(fdr_adj)
Min. 1st Qu. Median Mean 3rd Qu. Max.
0.8624 0.9999 0.9999 0.9994 0.9999 0.9999 # How many B.H. adjusted p-values < 0.05?
which(fdr_adj < 0.05)integer(0)# Plot the unadjusted versus adjusted p-values
plot(chimp_var_pval, fdr_adj, xlim = c(0,1), ylim = c(0,1), xlab = c("p-value of the F-test"), ylab = c("BH-adj p-value"), main = c("F test results from Chimp samples Day 0 to 1"))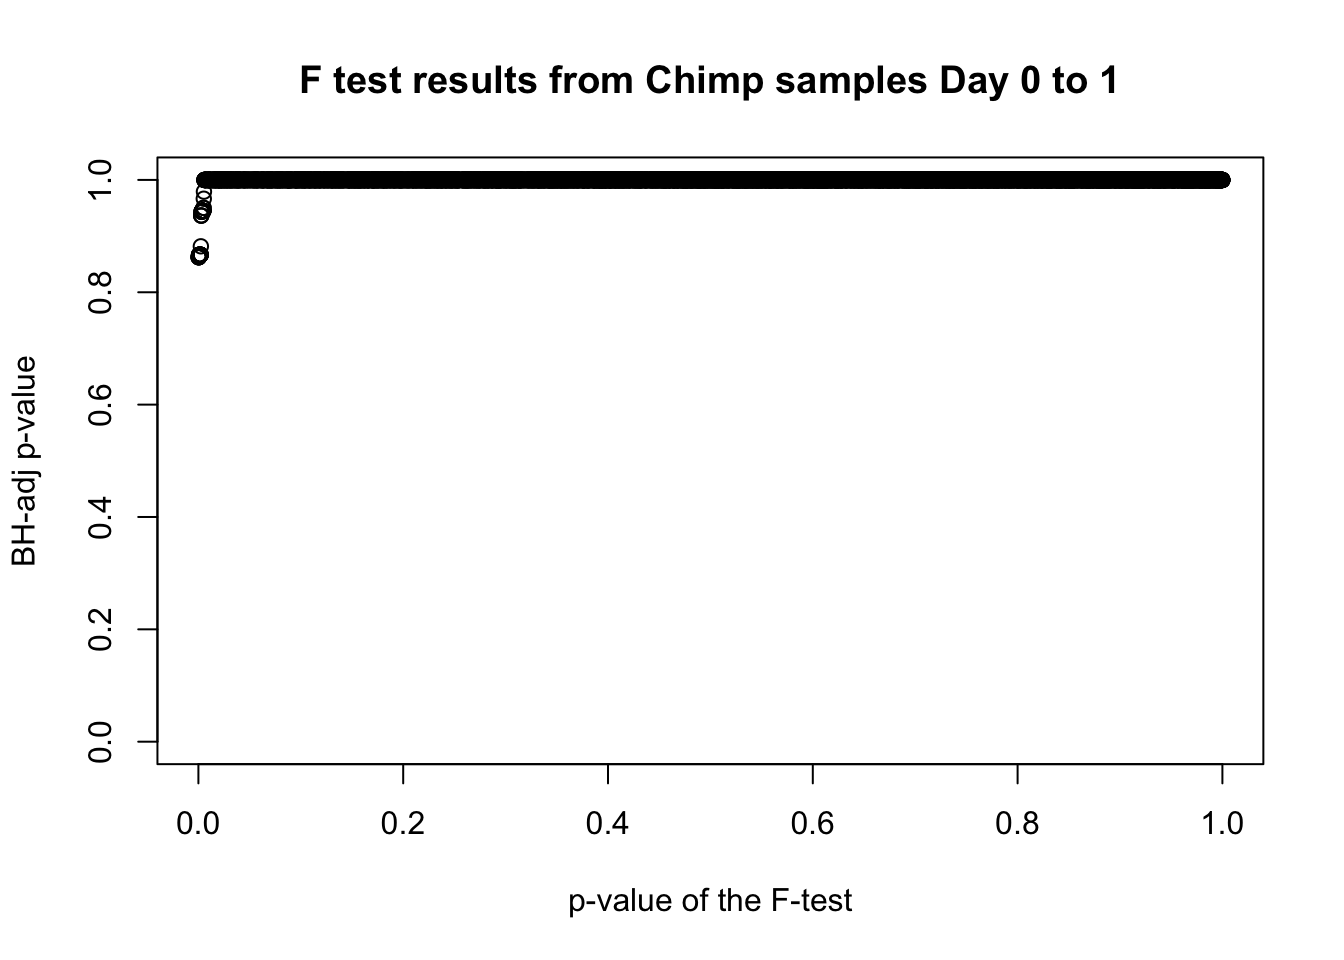
# Obtain Storey's pi_0

qvalue(p=chimp_var_pval, pi0.method="bootstrap", fdr.level=NULL, robust=TRUE)$pi0
[1] 1boot_pi0 <- qvalue(p=chimp_var_pval, pi0.method="bootstrap", fdr.level=NULL, robust=TRUE)$pi0
qvalue(p=chimp_var_pval, pi0.method="smoother", fdr.level=NULL, robust=TRUE)$pi0[1] 1boot_pi0s <- qvalue(p=chimp_var_pval, pi0.method="smoother", fdr.level=NULL, robust=TRUE)$pi0
# Obtain pi_1 based on Storey's pi_0
1-qvalue(p=chimp_var_pval, pi0.method="bootstrap", fdr.level=NULL, robust=TRUE)$pi0[1] 01-qvalue(p=chimp_var_pval, pi0.method="smoother", fdr.level=NULL, robust=TRUE)$pi0[1] 0length(which(chimp_var_pval < 0.05))*(1-qvalue(p=chimp_var_pval, pi0.method="bootstrap", fdr.level=NULL, robust=TRUE)$pi0)[1] 0# Make a histogram of the p-value distribution
p1_inc <- ggplot(chimp_var_pval_inc01, aes(chimp_var_pval_inc01[,1])) + geom_histogram(aes(y = ..density..), fill="white", colour="black", breaks=seq(0, 1, by = 0.02)) + theme_bw() +
scale_x_continuous(limits = c(0,1)) + ggtitle("Days 0 to 1") + theme(plot.title = element_text(face = "bold")) + labs(x = "Unadjusted p-values") + labs(y = "Density") +
geom_hline(yintercept = boot_pi0, size=2.5, colour = "#E77642") + scale_y_continuous(labels=scaleFUN) +
annotate("text", label='bold(bolditalic(hat(pi)[0][", chimp"])=="1")', parse=TRUE, x=0.16, y=(1.25), size = 6, colour = "#E77642")
p1_inc
p1s_inc <- ggplot(chimp_var_pval_inc01, aes(chimp_var_pval_inc01[,1])) + geom_histogram(aes(y = ..density..), fill="white", colour="black", breaks=seq(0, 1, by = 0.02)) + theme_bw() +
scale_x_continuous(limits = c(0,1)) + ggtitle("Days 0 to 1") + theme(plot.title = element_text(face = "bold")) + labs(x = "Unadjusted p-values") + labs(y = "Density") + geom_hline(yintercept = boot_pi0s, size=2.5, colour = "#E77642") + scale_y_continuous(labels=scaleFUN) +
annotate("text", label='bold(bolditalic(hat(pi)[0][", chimp"])=="1")', parse=TRUE, x=0.16, y=(1.25), size = 6, colour = "#E77642")
p1s_inc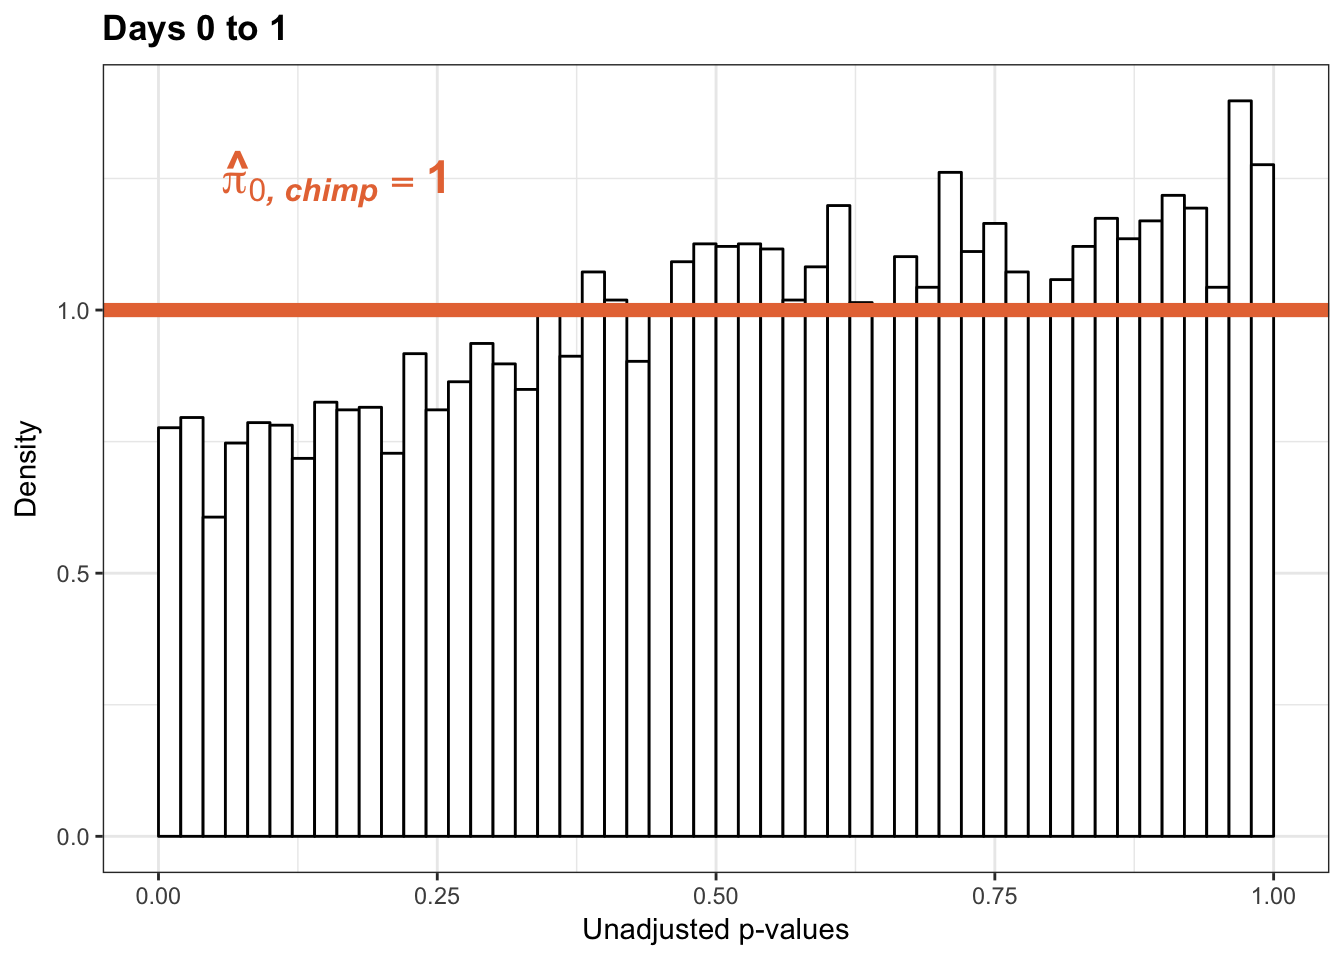
Testing chimps increase in variance from days 1 to 2
chimp_var_pval <- array(NA, dim = c(10304, 1))
for(i in 1:10304){
x <- t(mean_tech_reps[i,17:20])
y <- t(mean_tech_reps[i,27:30])
htest <- var.test(x, y, alternative = c("less"))
chimp_var_pval[i,1] <- htest$p.value
}
chimp_var_pval_inc12 <- as.data.frame(chimp_var_pval)
# Make a histogram of the unadjusted p-values
hist(chimp_var_pval)
# Go from unadjusted to B.H. adjusted p-values
fdr_adj <- p.adjust(chimp_var_pval, method = c("fdr") )

summary(fdr_adj)
Min. 1st Qu. Median Mean 3rd Qu. Max.
0.5974 0.7833 0.7907 0.8195 0.8336 1.0000 # How many B.H. adjusted p-values < 0.05?
which(fdr_adj < 0.05)integer(0)# Plot the unadjusted versus adjusted p-values
plot(chimp_var_pval, fdr_adj, xlim = c(0,1), ylim = c(0,1), xlab = c("p-value of the F-test"), ylab = c("BH-adj p-value"), main = c("F test results from Chimp samples Day 1 to 2"))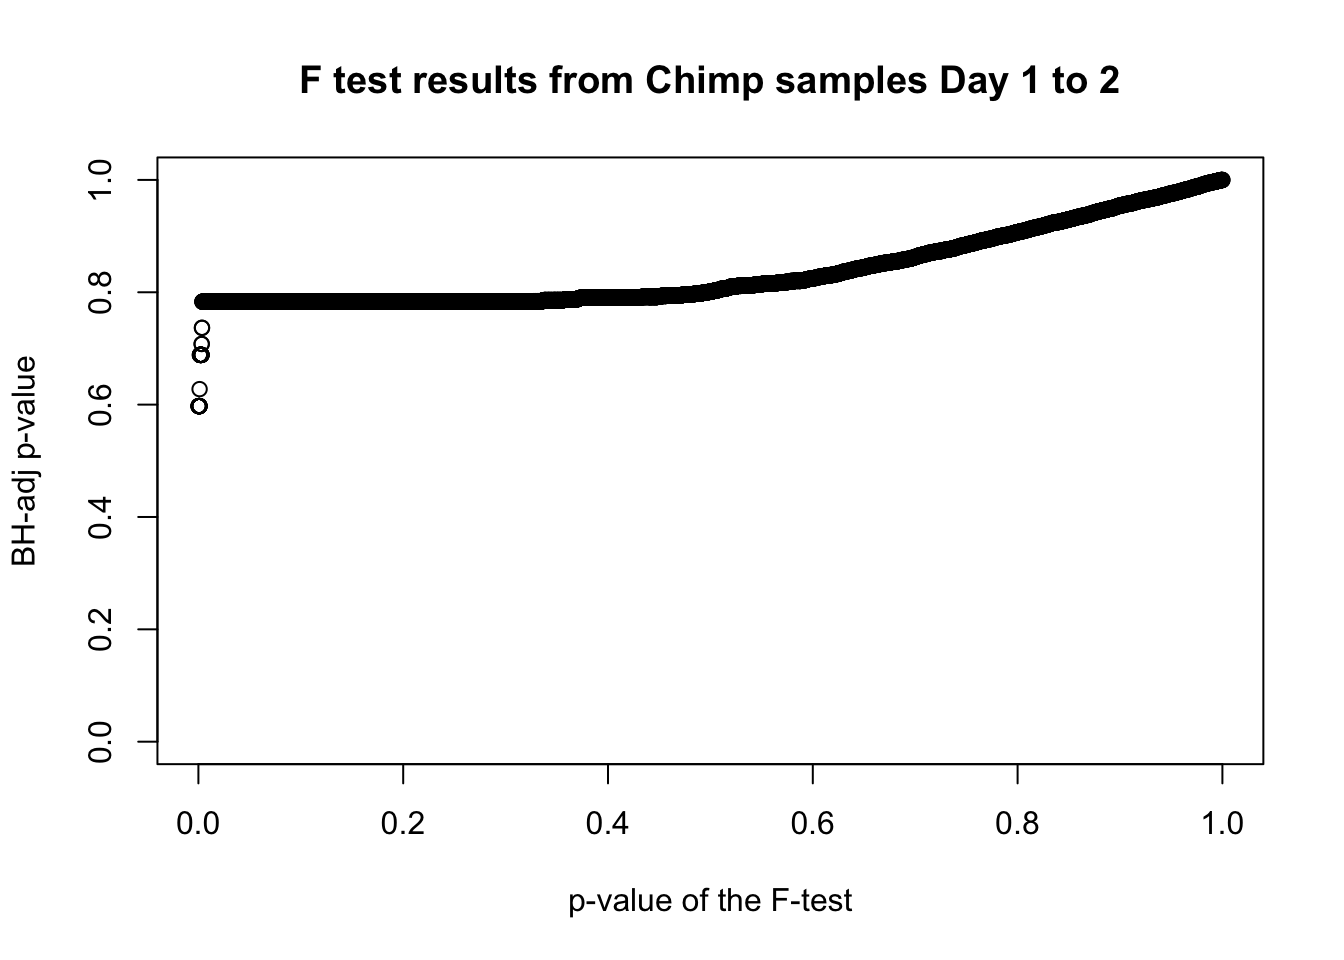
# Obtain Storey's pi_0

boot_pi0 <- qvalue(p=chimp_var_pval, pi0.method="bootstrap", fdr.level=NULL, robust=TRUE)$pi0

qvalue(p=chimp_var_pval, pi0.method="bootstrap", fdr.level=NULL, robust=TRUE)$pi0
[1] 0.5725932boot_pi0s <- qvalue(p=chimp_var_pval, pi0.method="smoother", fdr.level=NULL, robust=TRUE)$pi0
qvalue(p=chimp_var_pval, pi0.method="smoother", fdr.level=NULL, robust=TRUE)$pi0[1] 0.5221613# Obtain pi_1 based on Storey's pi_0
1-qvalue(p=chimp_var_pval, pi0.method="bootstrap", fdr.level=NULL, robust=TRUE)$pi0[1] 0.42740681-qvalue(p=chimp_var_pval, pi0.method="smoother", fdr.level=NULL, robust=TRUE)$pi0[1] 0.4778387length(which(chimp_var_pval < 0.05))*(1-qvalue(p=chimp_var_pval, pi0.method="bootstrap", fdr.level=NULL, robust=TRUE)$pi0)[1] 238.493# Make a histogram of the p-value distribution
p2_inc <- ggplot(chimp_var_pval_inc12, aes(chimp_var_pval_inc12[,1])) + geom_histogram(aes(y = ..density..), fill="white", colour="black", breaks=seq(0, 1, by = 0.02)) + theme_bw() +
scale_x_continuous(limits = c(0,1)) + labs(x = "Unadjusted p-values") + labs(y = "Density") +
geom_hline(yintercept = boot_pi0, size=2.5, colour = "#E77642") + ggtitle("Days 1 to 2") + theme(plot.title = element_text(face = "bold")) + scale_y_continuous(labels=scaleFUN) +
annotate("text", label='bold(bolditalic(hat(pi)[0][", chimp"])=="0.57")', parse=TRUE, x=0.80, y=(1.25), size = 6, colour = "#E77642")
p2_inc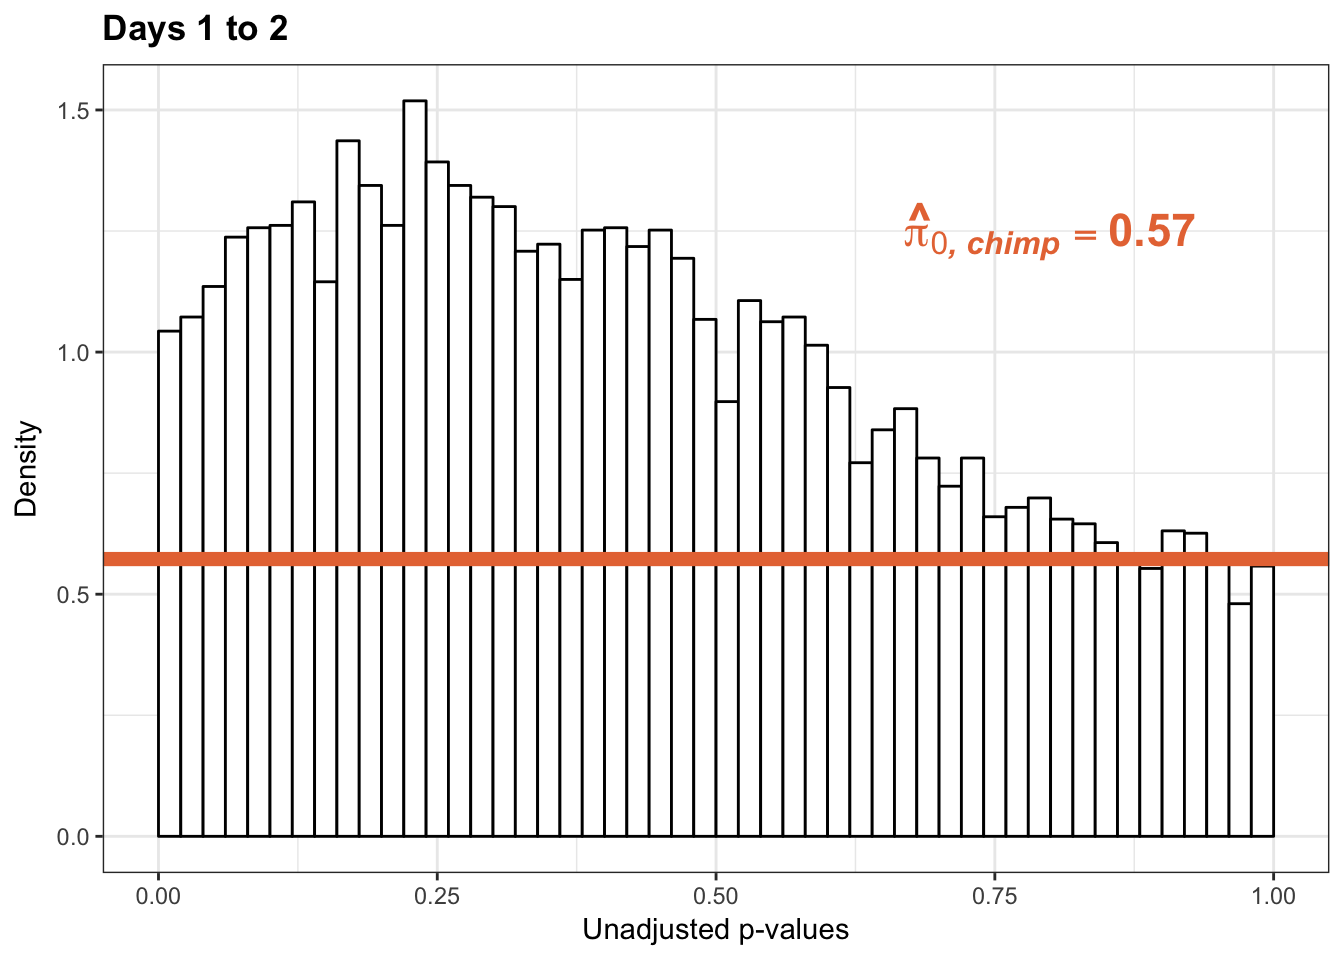
p2s_inc <- ggplot(chimp_var_pval_inc12, aes(chimp_var_pval_inc12[,1])) + geom_histogram(aes(y = ..density..), fill="white", colour="black", breaks=seq(0, 1, by = 0.02)) + theme_bw() +
scale_x_continuous(limits = c(0,1)) + labs(x = "Unadjusted p-values") + labs(y = "Density") + ggtitle("Days 1 to 2") + theme(plot.title = element_text(face = "bold")) + geom_hline(yintercept = boot_pi0s, size=2.5, colour = "#E77642") + scale_y_continuous(labels=scaleFUN) +
annotate("text", label='bold(bolditalic(hat(pi)[0][", chimp"])=="0.52")', parse=TRUE, x=0.80, y=(1.25), size = 6, colour = "#E77642")
p2s_inc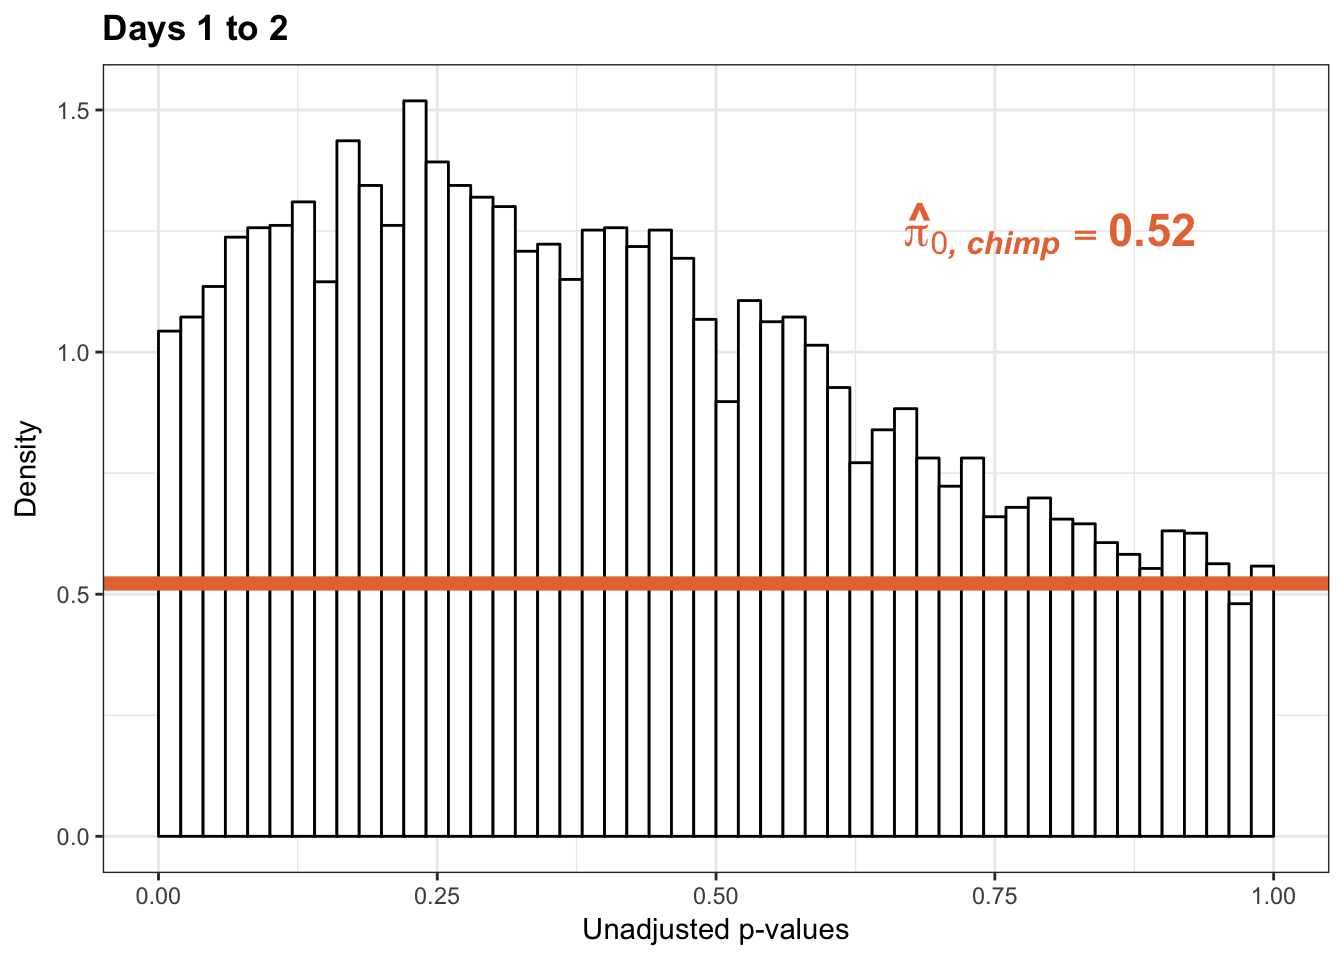
Testing chimps increase in variance from days 2 to 3
chimp_var_pval <- array(NA, dim = c(10304, 1))
for(i in 1:10304){
x <- t(mean_tech_reps[i,27:30])
y <- t(mean_tech_reps[i,37:40])
htest <- var.test(x, y, alternative = c("less"))
chimp_var_pval[i,1] <- htest$p.value
}
chimp_var_pval_inc23 <- as.data.frame(chimp_var_pval)
# Make a histogram of the unadjusted p-values
hist(chimp_var_pval, breaks = 500, main = c("Chimpanzees days 2 to 3"))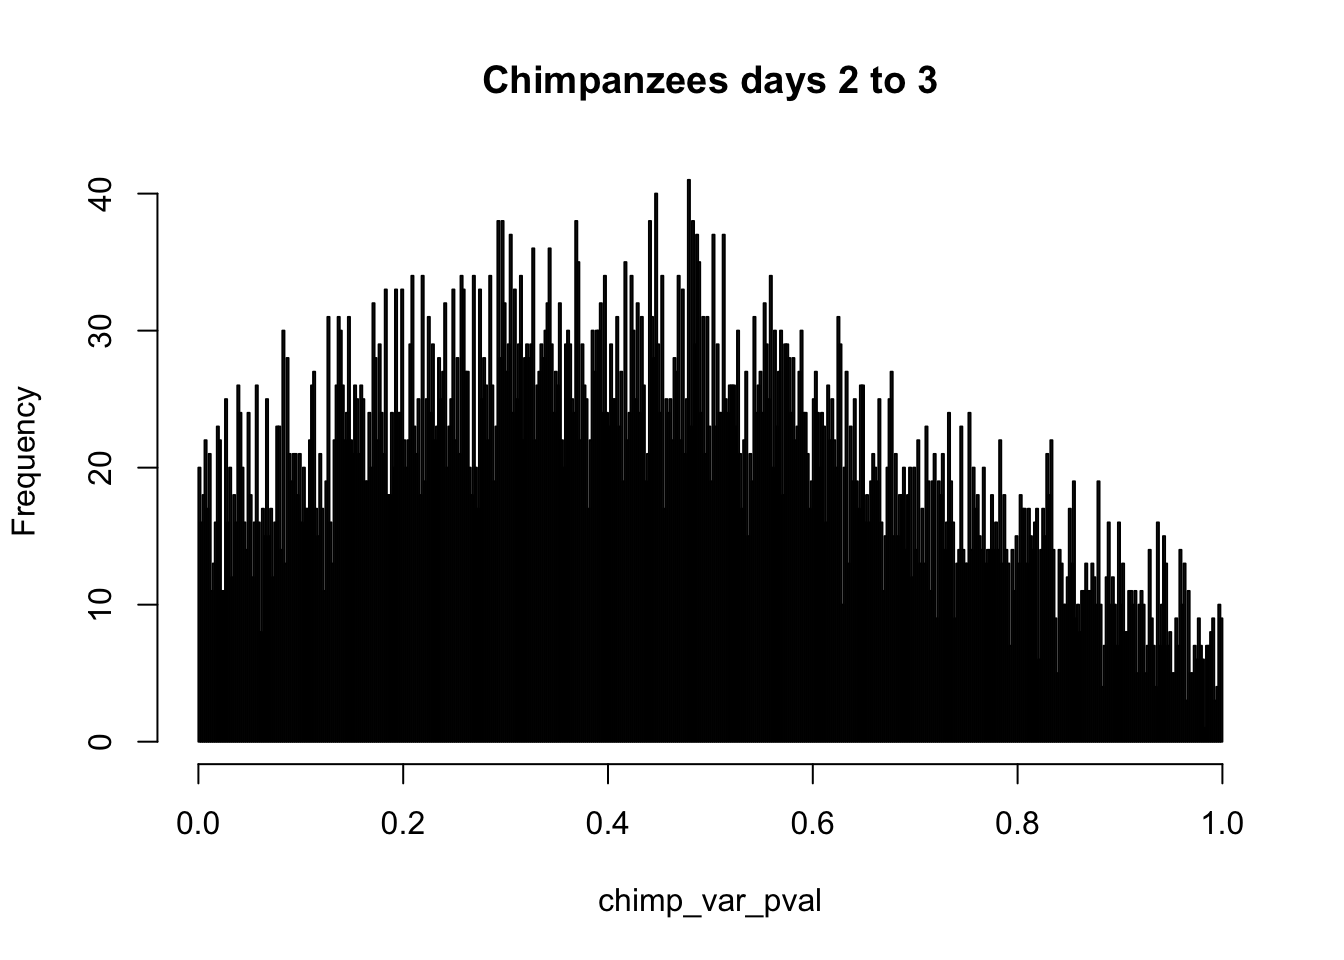
# Go from unadjusted to B.H. adjusted p-values
fdr_adj <- p.adjust(chimp_var_pval, method = c("fdr") )

summary(fdr_adj)
Min. 1st Qu. Median Mean 3rd Qu. Max.
0.3806 0.8308 0.8308 0.8455 0.8344 0.9999 # How many B.H. adjusted p-values < 0.05?
which(fdr_adj < 0.05)integer(0)# Plot the unadjusted versus adjusted p-values
plot(chimp_var_pval, fdr_adj, xlim = c(0,1), ylim = c(0,1), xlab = c("p-value of the F-test"), ylab = c("BH-adj p-value"), main = c("F test results from Chimp samples Day 2 to 3"))
# Obtain Storey's pi_0

boot_pi0 <- qvalue(p=chimp_var_pval, pi0.method="bootstrap", fdr.level=NULL, robust=TRUE)$pi0

qvalue(p=chimp_var_pval, pi0.method="bootstrap", fdr.level=NULL, robust=TRUE)$pi0
[1] 0.4600155boot_pi0s <- qvalue(p=chimp_var_pval, pi0.method="smoother", fdr.level=NULL, robust=TRUE)$pi0
qvalue(p=chimp_var_pval, pi0.method="smoother", fdr.level=NULL, robust=TRUE)$pi0[1] 0.3652978# Obtain pi_1 based on Storey's pi_0
1-qvalue(p=chimp_var_pval, pi0.method="bootstrap", fdr.level=NULL, robust=TRUE)$pi0[1] 0.53998451-qvalue(p=chimp_var_pval, pi0.method="smoother", fdr.level=NULL, robust=TRUE)$pi0[1] 0.6347022length(which(chimp_var_pval < 0.05))*(1-qvalue(p=chimp_var_pval, pi0.method="bootstrap", fdr.level=NULL, robust=TRUE)$pi0)[1] 244.073p3_inc <- ggplot(chimp_var_pval_inc23, aes(chimp_var_pval_inc23[,1])) + geom_histogram(aes(y = ..density..), fill="white", colour="black", breaks=seq(0, 1, by = 0.02)) + theme_bw() +
scale_x_continuous(limits = c(0,1)) + ggtitle("Days 2 to 3") + theme(plot.title = element_text(face = "bold")) + labs(x = "Unadjusted p-values") + labs(y = "Density") +
geom_hline(yintercept = boot_pi0, size=2.5, colour = "#E77642") + scale_y_continuous(labels=scaleFUN) +
annotate("text", label='bold(bolditalic(hat(pi)[0][", chimp"])=="0.46")', parse=TRUE, x=0.8, y=(1.25), size = 6, colour = "#E77642")
p3_inc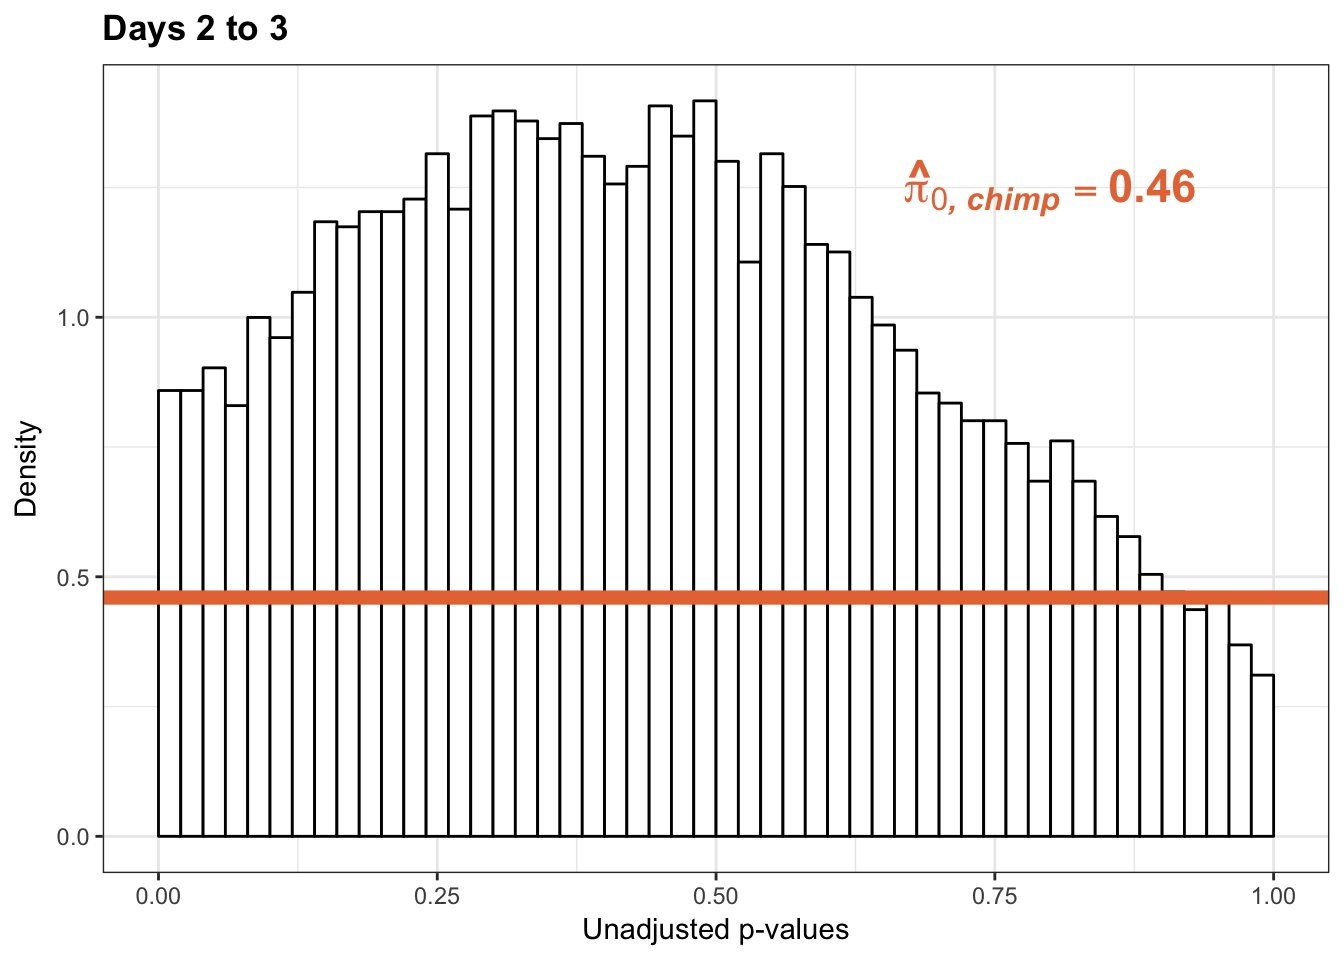
p3s_inc <- ggplot(chimp_var_pval_inc23, aes(chimp_var_pval_inc23[,1])) + geom_histogram(aes(y = ..density..), fill="white", colour="black", breaks=seq(0, 1, by = 0.02)) + theme_bw() +
scale_x_continuous(limits = c(0,1)) + ggtitle("Days 2 to 3") + theme(plot.title = element_text(face = "bold")) + labs(x = "Unadjusted p-values") + labs(y = "Density") + geom_hline(yintercept = boot_pi0s, size=2.5, colour = "#E77642") + scale_y_continuous(labels=scaleFUN) +
annotate("text", label='bold(bolditalic(hat(pi)[0][", chimp"])=="0.37")', parse=TRUE, x=0.80, y=(1.25), size = 6, colour = "#E77642")
p3s_inc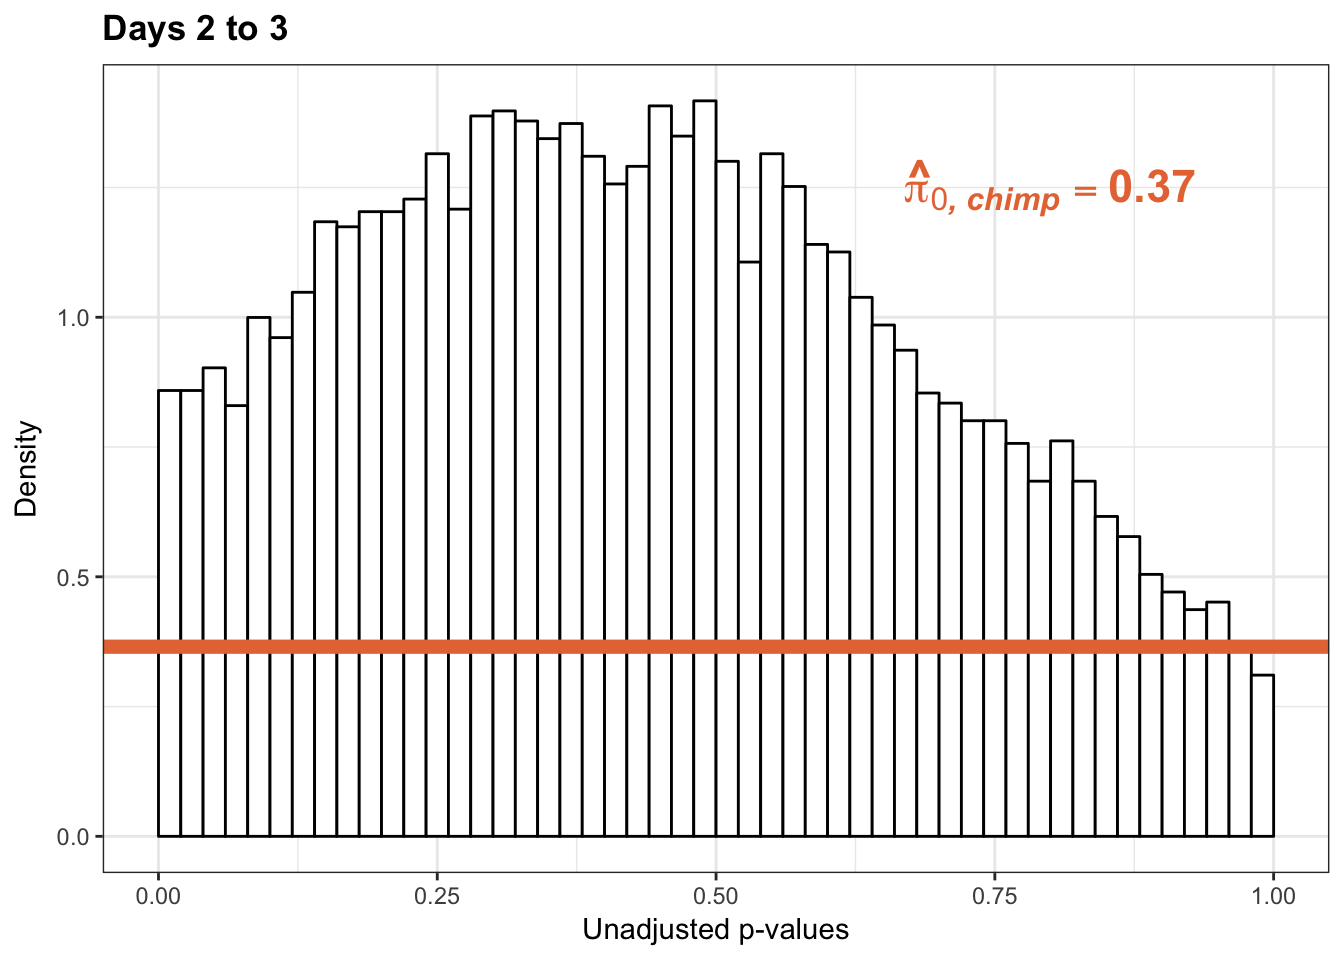
Testing chimps increase in variance from days 1 to 3
chimp_var_pval <- array(NA, dim = c(10304, 1))
for(i in 1:10304){
x <- t(mean_tech_reps[i,17:20])
y <- t(mean_tech_reps[i,37:40])
htest <- var.test(x, y, alternative = c("less"))
chimp_var_pval[i,1] <- htest$p.value
}
chimp_var_pval_inc13 <- as.data.frame(chimp_var_pval)
# Make a histogram of the unadjusted p-values
hist(chimp_var_pval, main = c("Chimpanzees days 1 to 3"))
# Go from unadjusted to B.H. adjusted p-values
fdr_adj <- p.adjust(chimp_var_pval, method = c("fdr") )

summary(fdr_adj)
Min. 1st Qu. Median Mean 3rd Qu. Max.
0.2511 0.5429 0.6683 0.6713 0.7869 0.9996 # How many B.H. adjusted p-values < 0.05?
which(fdr_adj < 0.05)integer(0)# Plot the unadjusted versus adjusted p-values
plot(chimp_var_pval, fdr_adj, xlim = c(0,1), ylim = c(0,1), xlab = c("p-value of the F-test"), ylab = c("BH-adj p-value"), main = c("F test results from Chimp samples Day 1 to 3"))
# Obtain Storey's pi_0

boot_pi0 <- qvalue(p=chimp_var_pval, pi0.method="bootstrap", fdr.level=NULL, robust=TRUE)$pi0

qvalue(p=chimp_var_pval, pi0.method="bootstrap", fdr.level=NULL, robust=TRUE)$pi0
[1] 0.550757boot_pi0s <- qvalue(p=chimp_var_pval, pi0.method="smoother", fdr.level=NULL, robust=TRUE)$pi0
qvalue(p=chimp_var_pval, pi0.method="smoother", fdr.level=NULL, robust=TRUE)$pi0[1] 0.5071291# Obtain pi_1 based on Storey's pi_0
1-qvalue(p=chimp_var_pval, pi0.method="bootstrap", fdr.level=NULL, robust=TRUE)$pi0[1] 0.4492431-qvalue(p=chimp_var_pval, pi0.method="smoother", fdr.level=NULL, robust=TRUE)$pi0[1] 0.4928709length(which(chimp_var_pval < 0.05))*(1-qvalue(p=chimp_var_pval, pi0.method="bootstrap", fdr.level=NULL, robust=TRUE)$pi0)[1] 487.8779p3_13_inc <- ggplot(chimp_var_pval_inc13, aes(chimp_var_pval_inc13[,1])) + geom_histogram(aes(y = ..density..), fill="white", colour="black", breaks=seq(0, 1, by = 0.02)) + theme_bw() +
scale_x_continuous(limits = c(0,1)) + ggtitle("Days 1 to 3") + theme(plot.title = element_text(face = "bold")) + labs(x = "Unadjusted p-values") + labs(y = "Density") +
geom_hline(yintercept = boot_pi0, size=2.5, colour = "#E77642") + scale_y_continuous(labels=scaleFUN) +
annotate("text", label='bold(bolditalic(hat(pi)[0][", chimp"])=="0.55")', parse=TRUE, x=0.80, y=(1.25), size = 6, colour = "#E77642")
p3_13_inc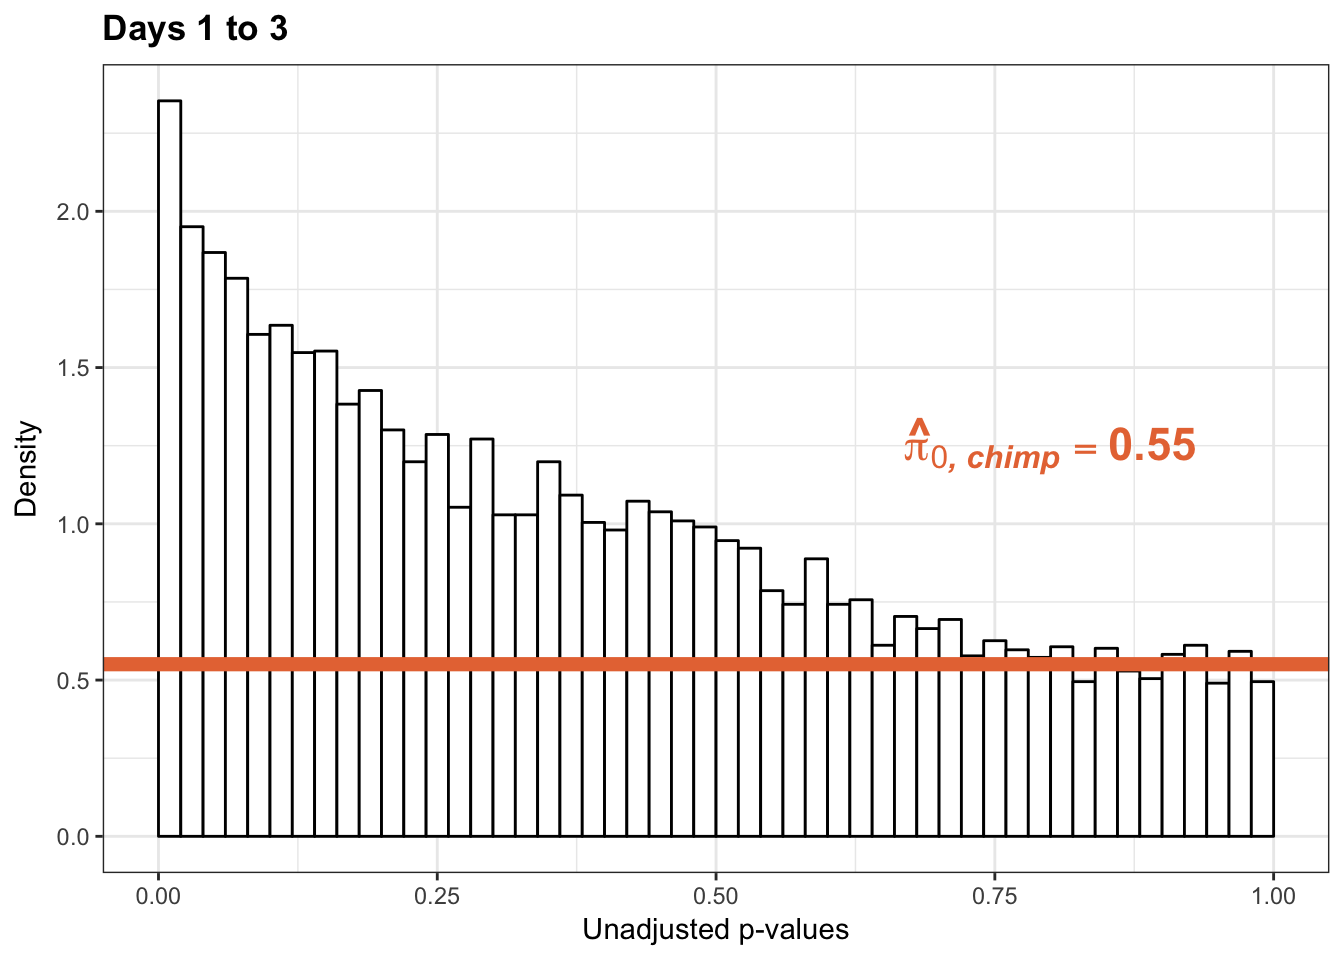
p3_13s_inc <- ggplot(chimp_var_pval_inc13, aes(chimp_var_pval_inc13[,1])) + geom_histogram(aes(y = ..density..), fill="white", colour="black", breaks=seq(0, 1, by = 0.02)) + theme_bw() +
scale_x_continuous(limits = c(0,1)) + ggtitle("Days 1 to 3") + theme(plot.title = element_text(face = "bold")) + labs(x = "Unadjusted p-values") + labs(y = "Density") + geom_hline(yintercept = boot_pi0s, size=2.5, colour = "#E77642") + scale_y_continuous(labels=scaleFUN) +
annotate("text", label='bold(bolditalic(hat(pi)[0][", chimp"])=="0.51")', parse=TRUE, x=0.80, y=(1.25), size = 6, colour = "#E77642")
p3_13s_inc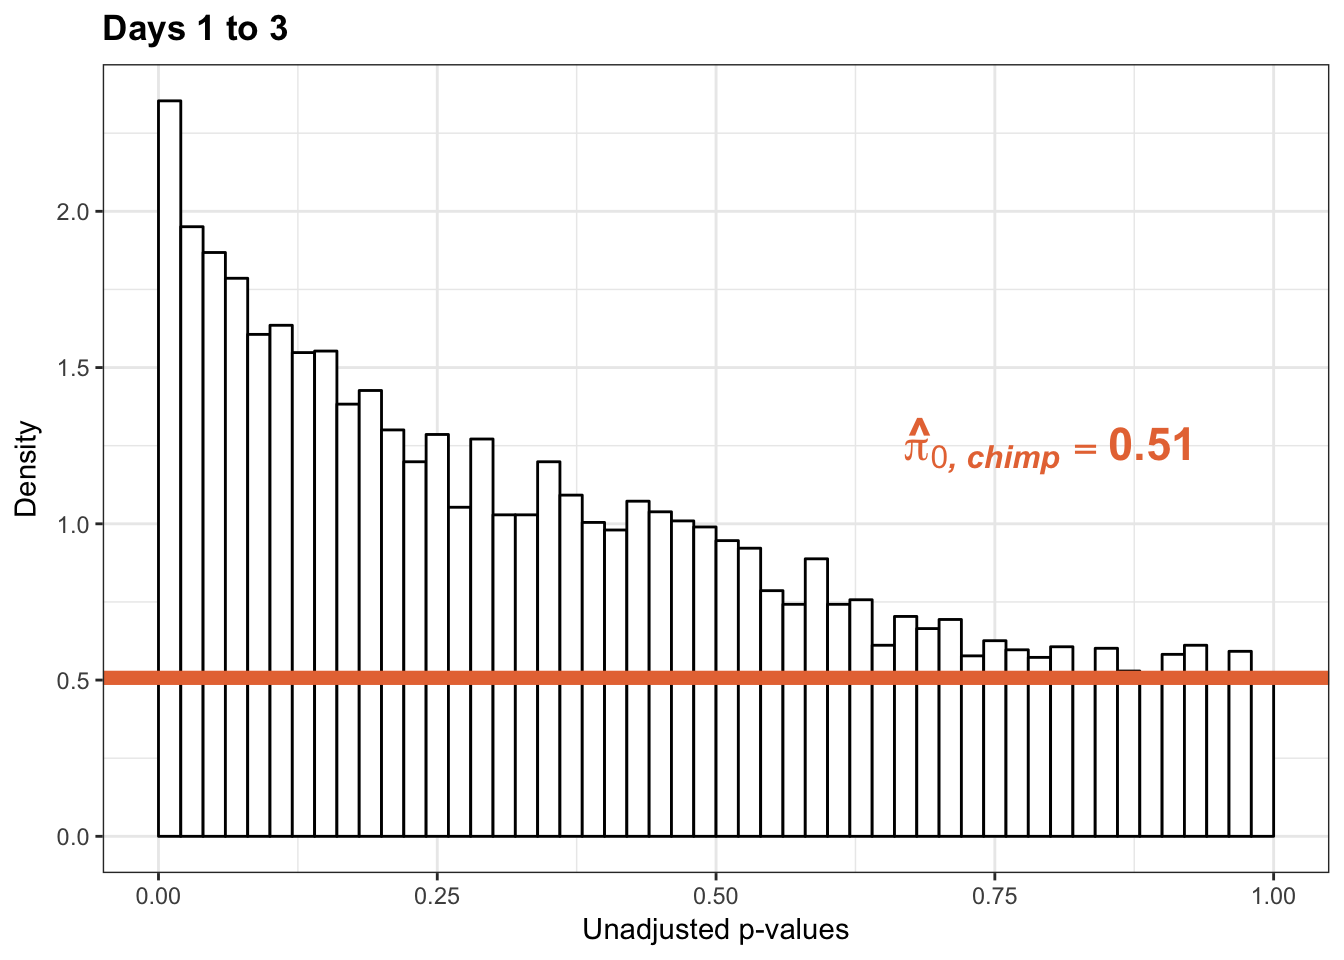
Testing humans increase in variance from days 0 to 1
human_var_pval <- array(NA, dim = c(10304, 1))
for(i in 1:10304){
x <- t(mean_tech_reps[i,1:6])
y <- t(mean_tech_reps[i,11:16])
htest <- var.test(x, y, alternative = c("less"))
human_var_pval[i,1] <- htest$p.value
}
human_var_pval_inc01 <- as.data.frame(human_var_pval)
# Make a histogram of the unadjusted p-values
hist(human_var_pval, main = c("Humans days 0 to 1"))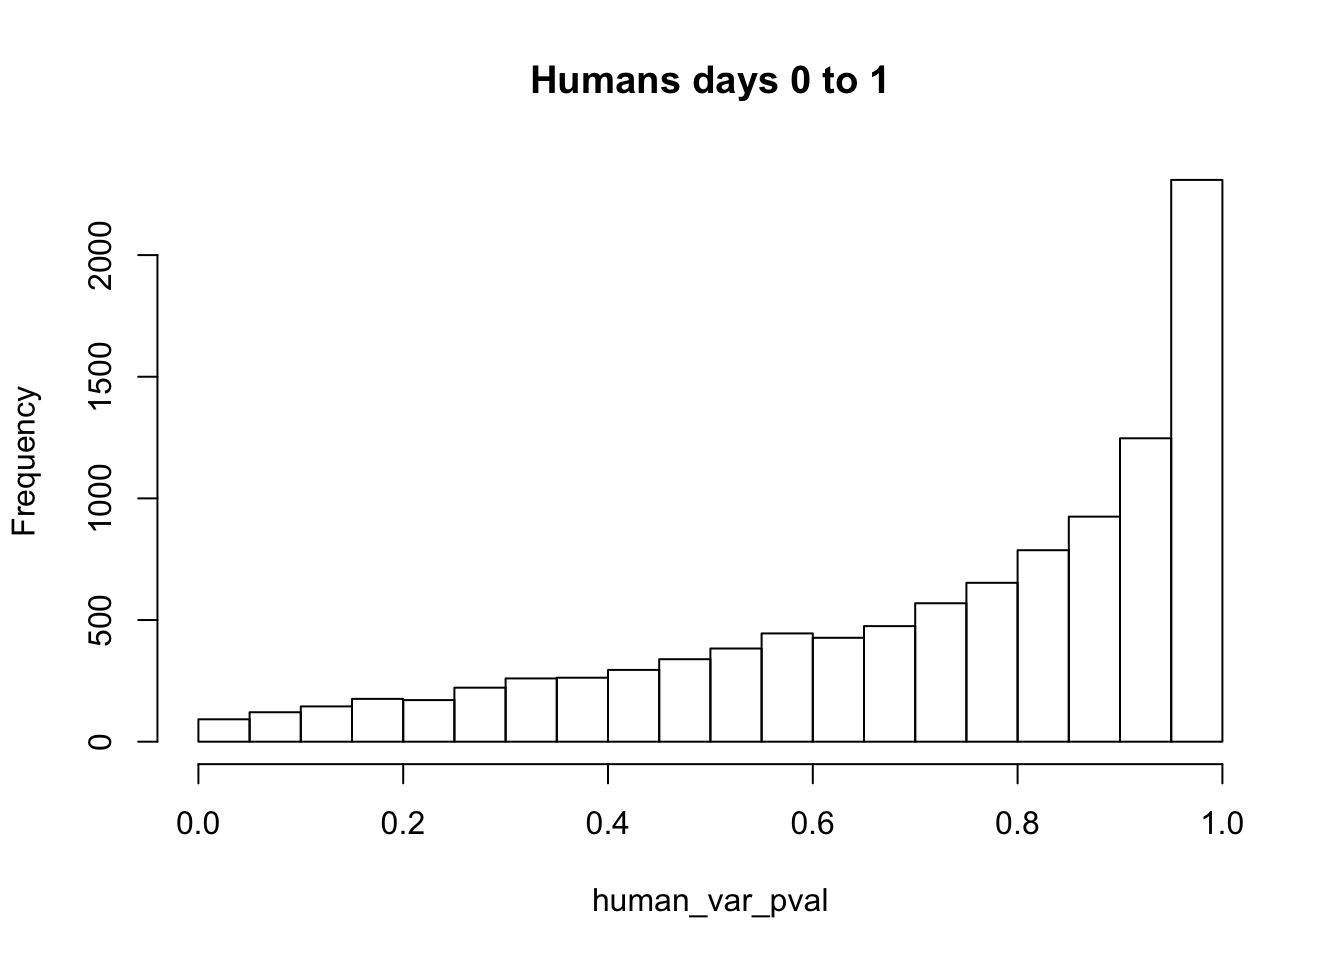
# Go from unadjusted to B.H. adjusted p-values
fdr_adj <- p.adjust(human_var_pval, method = c("fdr") )

summary(fdr_adj)
Min. 1st Qu. Median Mean 3rd Qu. Max.
1 1 1 1 1 1 # How many B.H. adjusted p-values < 0.05?
length(which(fdr_adj < 0.05))[1] 0# Plot the unadjusted versus adjusted p-values
plot(human_var_pval, fdr_adj, xlim = c(0,1), ylim = c(0,1), xlab = c("p-value of the F-test"), ylab = c("BH-adj p-value"), main = c("F test results from Human samples Day 0 to 1"))
# Obtain Storey's pi_0

boot_pi0 <- qvalue(p=human_var_pval, pi0.method="bootstrap", fdr.level=NULL, robust=TRUE)$pi0

qvalue(p=human_var_pval, pi0.method="bootstrap", fdr.level=NULL, robust=TRUE)$pi0
[1] 1boot_pi0s <- qvalue(p=human_var_pval, pi0.method="smoother", fdr.level=NULL, robust=TRUE)$pi0
qvalue(p=human_var_pval, pi0.method="smoother", fdr.level=NULL, robust=TRUE)$pi0[1] 1# Obtain pi_1 based on Storey's pi_0
1-qvalue(p=human_var_pval, pi0.method="bootstrap", fdr.level=NULL, robust=TRUE)$pi0[1] 01-qvalue(p=human_var_pval, pi0.method="smoother", fdr.level=NULL, robust=TRUE)$pi0[1] 0length(which(human_var_pval < 0.05))*(1-qvalue(p=human_var_pval, pi0.method="bootstrap", fdr.level=NULL, robust=TRUE)$pi0)[1] 0p4_inc <- ggplot(human_var_pval_inc01, aes(human_var_pval_inc01[,1])) + geom_histogram(aes(y = ..density..), fill="white", colour="black", breaks=seq(0, 1, by = 0.02)) + theme_bw() +
scale_x_continuous(limits = c(0,1)) + labs(x = "Unadjusted p-values") + labs(y = "Density") +
geom_hline(yintercept = boot_pi0, size=2.5, colour = "#00A4F4") + scale_y_continuous(labels=scaleFUN) +
annotate("text", label='bold(bolditalic(hat(pi)[0][", human"])=="1")', parse=TRUE, x=0.16, y=(2), size = 6, colour = "#00A4F4")
p4_inc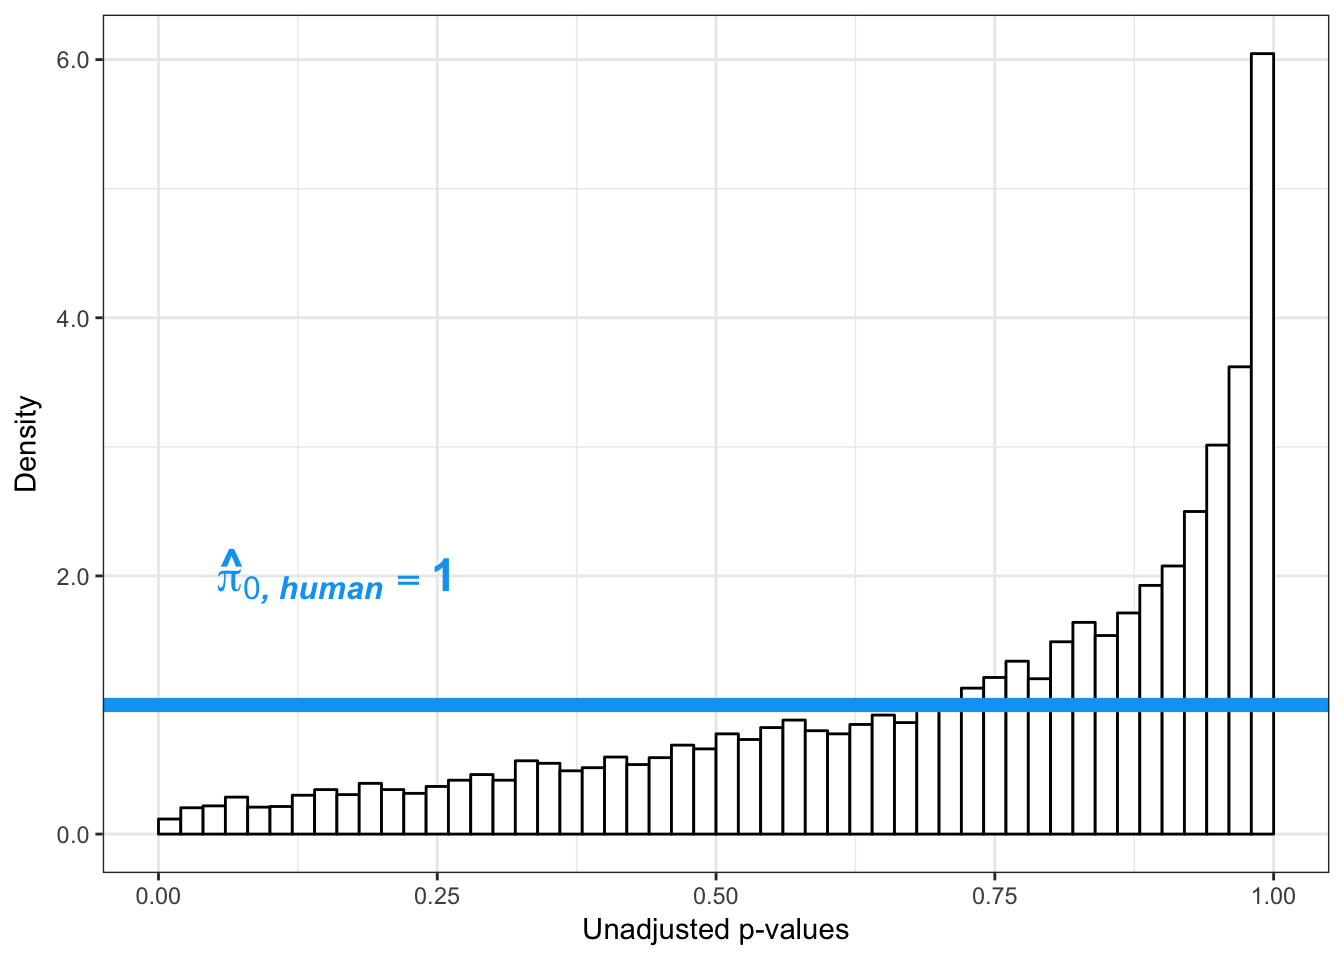
p4s_inc <- ggplot(human_var_pval_inc01, aes(human_var_pval_inc01[,1])) + geom_histogram(aes(y = ..density..), fill="white", colour="black", breaks=seq(0, 1, by = 0.02)) + theme_bw() +
scale_x_continuous(limits = c(0,1)) + labs(x = "Unadjusted p-values") + labs(y = "Density") + geom_hline(yintercept = boot_pi0s, size=2.5, colour = "#00A4F4") + scale_y_continuous(labels=scaleFUN) +
annotate("text", label='bold(bolditalic(hat(pi)[0][", human"])=="1")', parse=TRUE, x=0.16, y=(2), size = 6, colour = "#00A4F4")
p4s_inc
Testing humans increase in variance from days 1 to 2
human_var_pval <- array(NA, dim = c(10304, 1))
for(i in 1:10304){
x <- t(mean_tech_reps[i,11:16])
y <- t(mean_tech_reps[i,21:26])
htest <- var.test(x, y, alternative = c("less"))
human_var_pval[i,1] <- htest$p.value
}
human_var_pval_inc12 <- as.data.frame(human_var_pval)
# Make a histogram of the unadjusted p-values
hist(human_var_pval, main = c("Humans days 1 to 2"))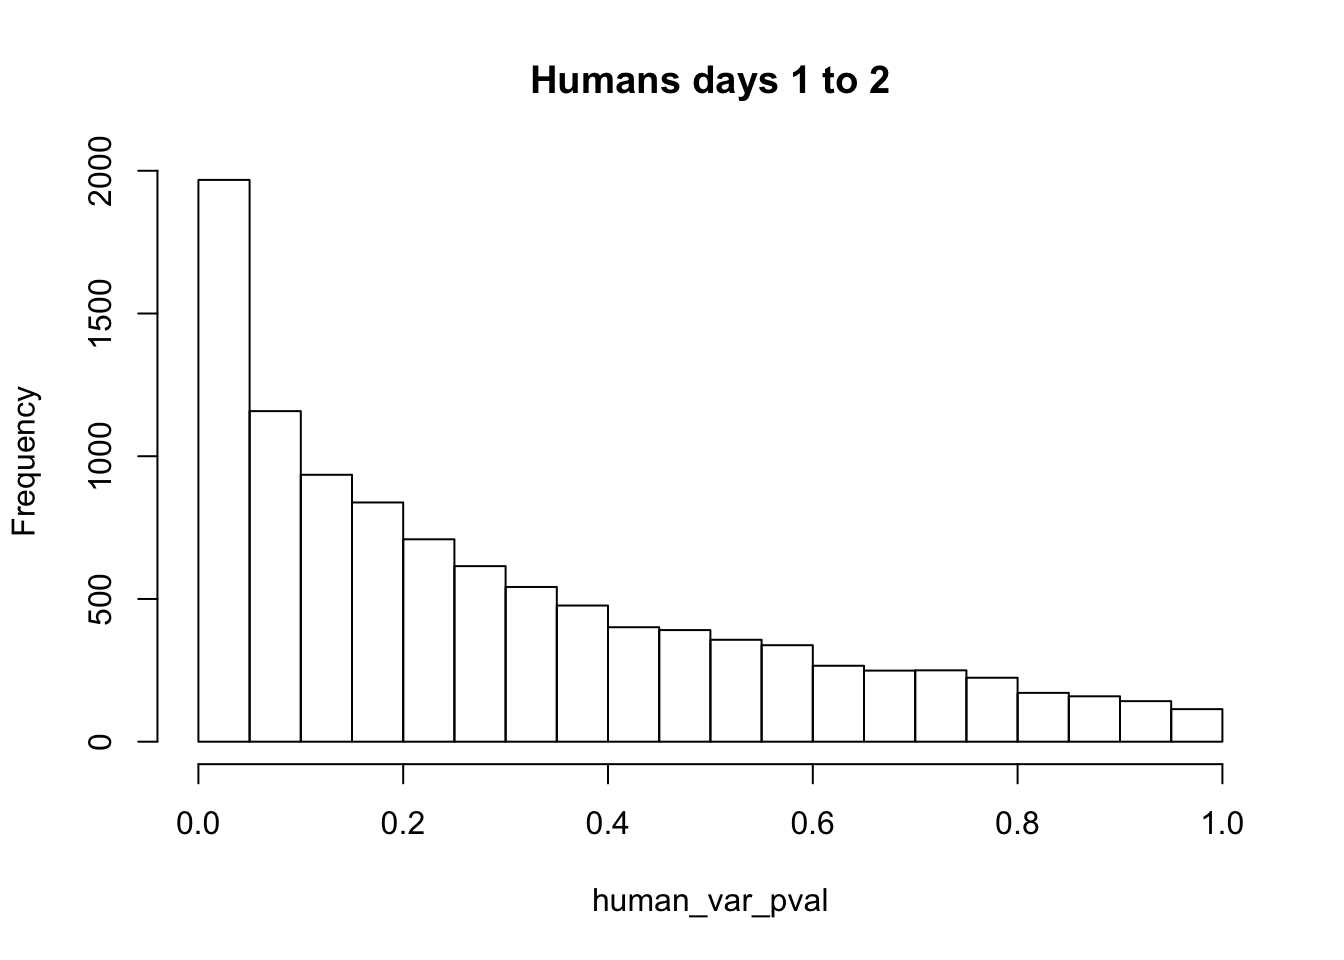
# Go from unadjusted to B.H. adjusted p-values
fdr_adj <- p.adjust(human_var_pval, method = c("fdr") )

summary(fdr_adj)
Min. 1st Qu. Median Mean 3rd Qu. Max.
0.06298 0.29350 0.43367 0.46480 0.61330 0.99838 # How many B.H. adjusted p-values < 0.05?
length(which(fdr_adj < 0.05))[1] 0# Plot the unadjusted versus adjusted p-values
plot(human_var_pval, fdr_adj, xlim = c(0,1), ylim = c(0,1), xlab = c("p-value of the F-test"), ylab = c("BH-adj p-value"), main = c("F test results from Human samples Day 1 to 2"))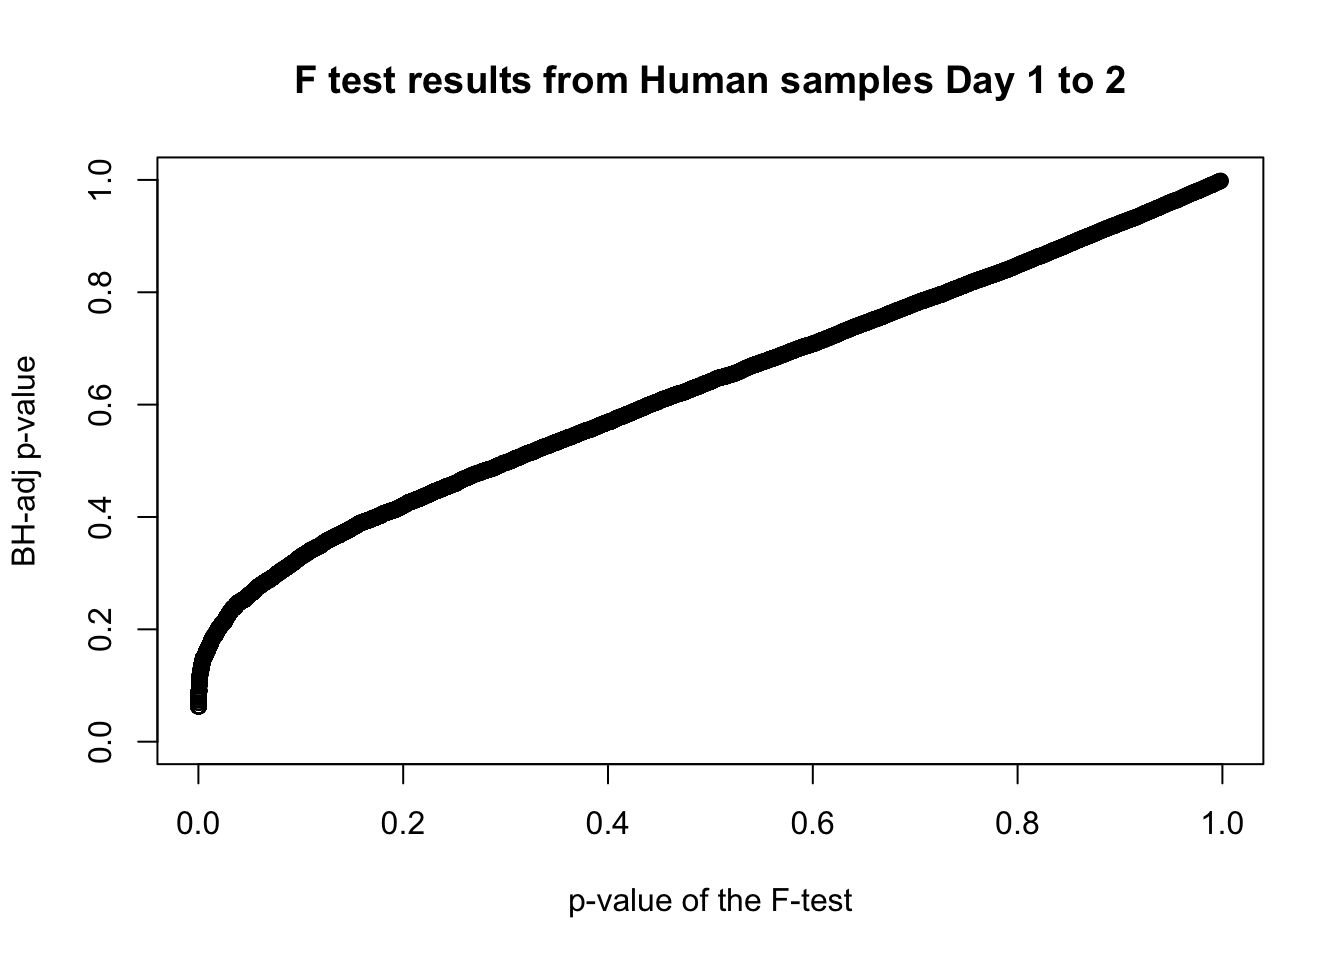
# Obtain Storey's pi_0

boot_pi0 <- qvalue(p=human_var_pval, pi0.method="bootstrap", fdr.level=NULL, robust=TRUE)$pi0

qvalue(p=human_var_pval, pi0.method="bootstrap", fdr.level=NULL, robust=TRUE)$pi0
[1] 0.2685041boot_pi0s <- qvalue(p=human_var_pval, pi0.method="smoother", fdr.level=NULL, robust=TRUE)$pi0
qvalue(p=human_var_pval, pi0.method="smoother", fdr.level=NULL, robust=TRUE)$pi0[1] 0.2141993# Obtain pi_1 based on Storey's pi_0
1-qvalue(p=human_var_pval, pi0.method="bootstrap", fdr.level=NULL, robust=TRUE)$pi0[1] 0.73149591-qvalue(p=human_var_pval, pi0.method="smoother", fdr.level=NULL, robust=TRUE)$pi0[1] 0.7858007length(which(human_var_pval < 0.05))*(1-qvalue(p=human_var_pval, pi0.method="bootstrap", fdr.level=NULL, robust=TRUE)$pi0)[1] 1439.584p5_inc <- ggplot(human_var_pval_inc12, aes(human_var_pval_inc12[,1])) + geom_histogram(aes(y = ..density..), fill="white", colour="black", breaks=seq(0, 1, by = 0.02)) + theme_bw() +
scale_x_continuous(limits = c(0,1)) + labs(x = "Unadjusted p-values") + labs(y = "Density") +
geom_hline(yintercept = boot_pi0, size=2.5, colour = "#00A4F4") + scale_y_continuous(labels=scaleFUN) +
annotate("text", label='bold(bolditalic(hat(pi)[0][", human"])=="0.27")', parse=TRUE, x=0.80, y=(2), size = 6, colour = "#00A4F4")
p5_inc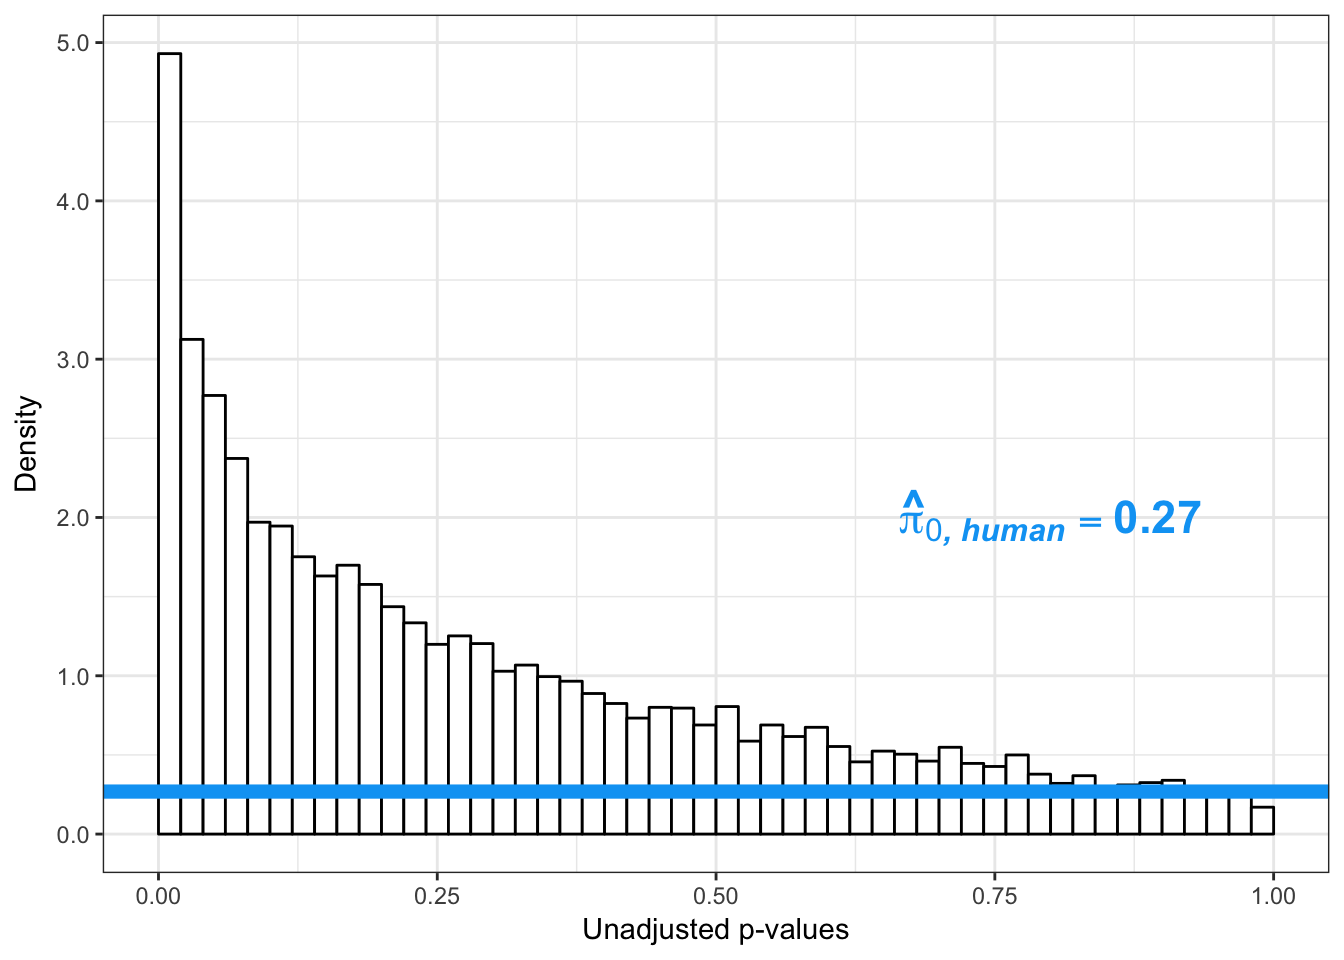
p5s_inc <- ggplot(human_var_pval_inc12, aes(human_var_pval_inc12[,1])) + geom_histogram(aes(y = ..density..), fill="white", colour="black", breaks=seq(0, 1, by = 0.02)) + theme_bw() +
scale_x_continuous(limits = c(0,1)) + labs(x = "Unadjusted p-values") + labs(y = "Density") + geom_hline(yintercept = boot_pi0s, size=2.5, colour = "#00A4F4") + scale_y_continuous(labels=scaleFUN) +
annotate("text", label='bold(bolditalic(hat(pi)[0][", human"])=="0.21")', parse=TRUE, x=0.80, y=(2), size = 6, colour = "#00A4F4")
p5s_inc
Testing humans increase in variance from days 2 to 3
human_var_pval <- array(NA, dim = c(10304, 1))
for(i in 1:10304){
x <- t(mean_tech_reps[i,21:26])
y <- t(mean_tech_reps[i,31:36])
htest <- var.test(x, y, alternative = c("less"))
human_var_pval[i,1] <- htest$p.value
}
human_var_pval_inc23 <- as.data.frame(human_var_pval)
# Make a histogram of the unadjusted p-values
hist(human_var_pval, main = c("Humans days 0 to 1"))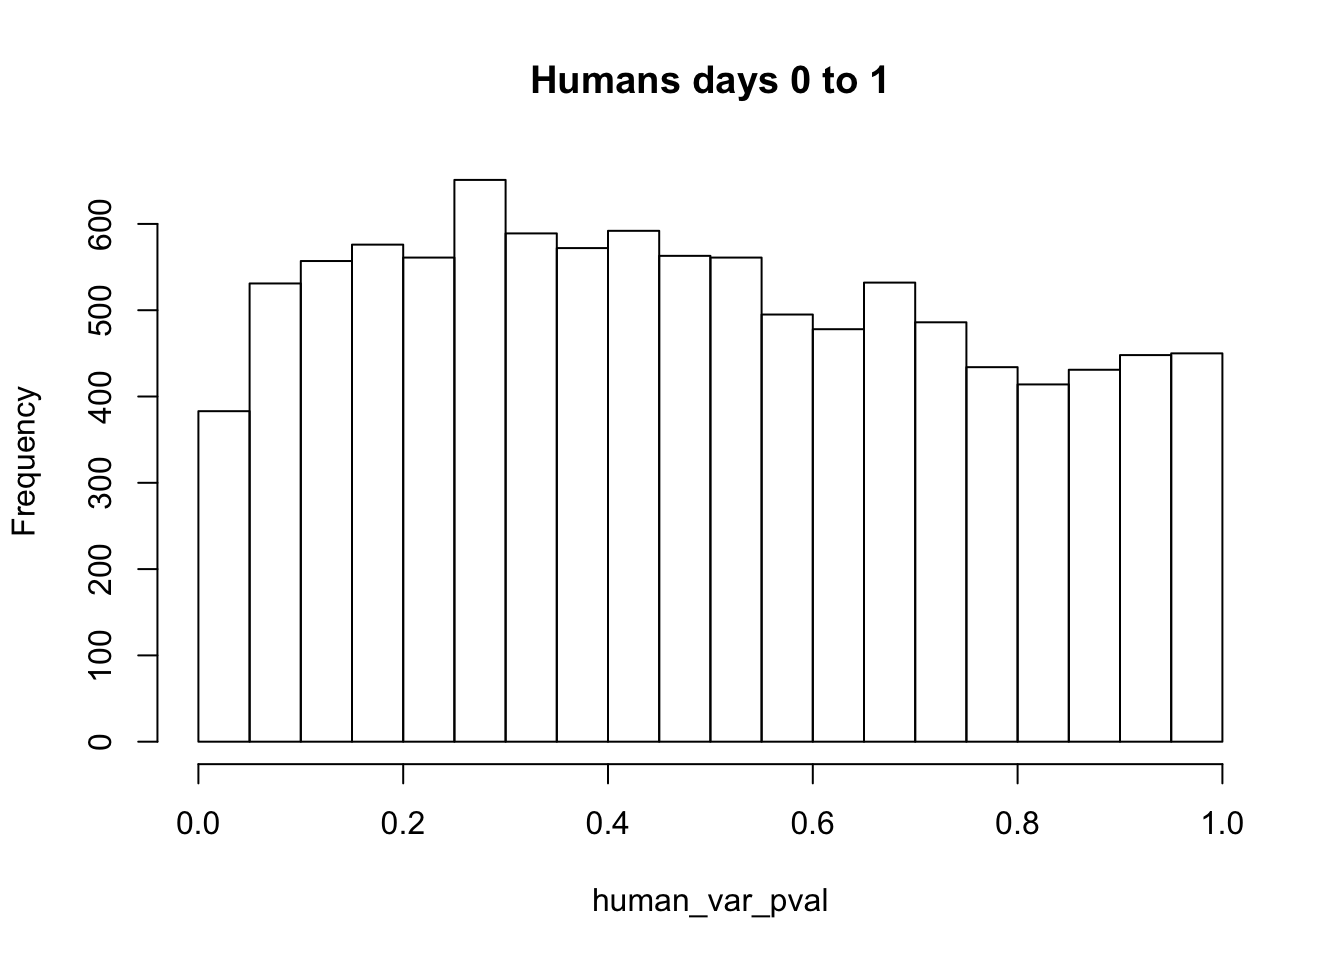
# Go from unadjusted to B.H. adjusted p-values
fdr_adj <- p.adjust(human_var_pval, method = c("fdr") )

summary(fdr_adj)
Min. 1st Qu. Median Mean 3rd Qu. Max.
0.9201 0.9201 0.9207 0.9360 0.9438 1.0000 # How many B.H. adjusted p-values < 0.05?
length(which(fdr_adj < 0.05))[1] 0# Plot the unadjusted versus adjusted p-values
plot(human_var_pval, fdr_adj, xlim = c(0,1), ylim = c(0,1), xlab = c("p-value of the F-test"), ylab = c("BH-adj p-value"), main = c("F test results from Human samples Day 2 to 3"))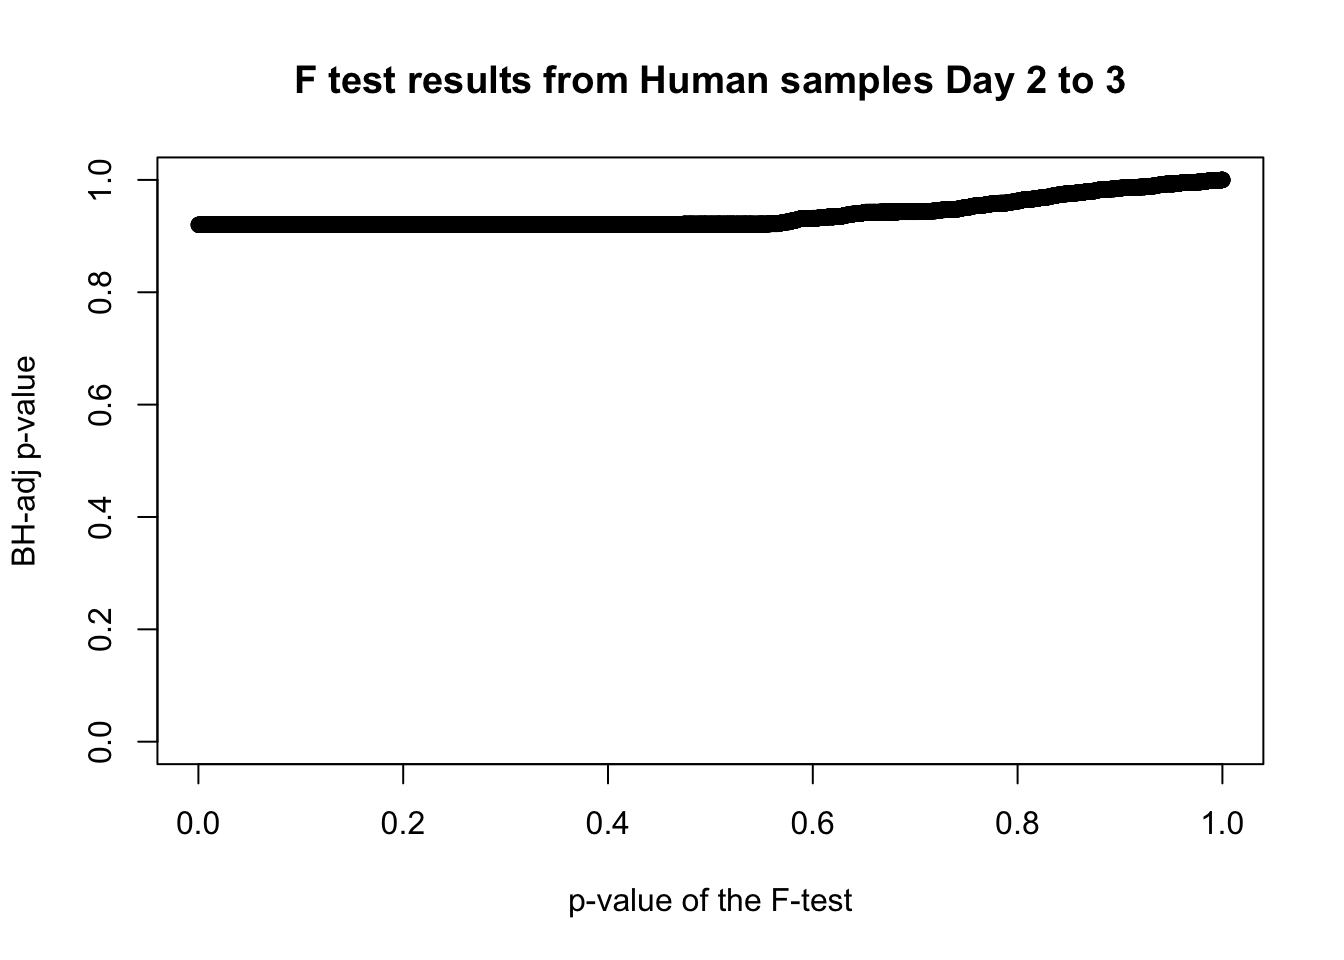
# Obtain Storey's pi_0

boot_pi0 <- qvalue(p=human_var_pval, pi0.method="bootstrap", fdr.level=NULL, robust=TRUE)$pi0

qvalue(p=human_var_pval, pi0.method="bootstrap", fdr.level=NULL, robust=TRUE)$pi0
[1] 0.8614777boot_pi0s <- qvalue(p=human_var_pval, pi0.method="smoother", fdr.level=NULL, robust=TRUE)$pi0
qvalue(p=human_var_pval, pi0.method="smoother", fdr.level=NULL, robust=TRUE)$pi0[1] 0.8477893# Obtain pi_1 based on Storey's pi_0
1-qvalue(p=human_var_pval, pi0.method="bootstrap", fdr.level=NULL, robust=TRUE)$pi0[1] 0.13852231-qvalue(p=human_var_pval, pi0.method="smoother", fdr.level=NULL, robust=TRUE)$pi0[1] 0.1522107length(which(human_var_pval < 0.05))*(1-qvalue(p=human_var_pval, pi0.method="bootstrap", fdr.level=NULL, robust=TRUE)$pi0)[1] 53.05402p6_inc <- ggplot(human_var_pval_inc23, aes(human_var_pval_inc23[,1])) + geom_histogram(aes(y = ..density..), fill="white", colour="black", breaks=seq(0, 1, by = 0.02)) + theme_bw() +
scale_x_continuous(limits = c(0,1)) + labs(x = "Unadjusted p-values") + labs(y = "Density") + geom_hline(yintercept = boot_pi0, size=2.5, colour = "#00A4F4") + scale_y_continuous(labels=scaleFUN) +
annotate("text", label='bold(bolditalic(hat(pi)[0][", human"])=="0.86")', parse=TRUE, x=0.80, y=(1.25), size = 6, colour = "#00A4F4")
p6_inc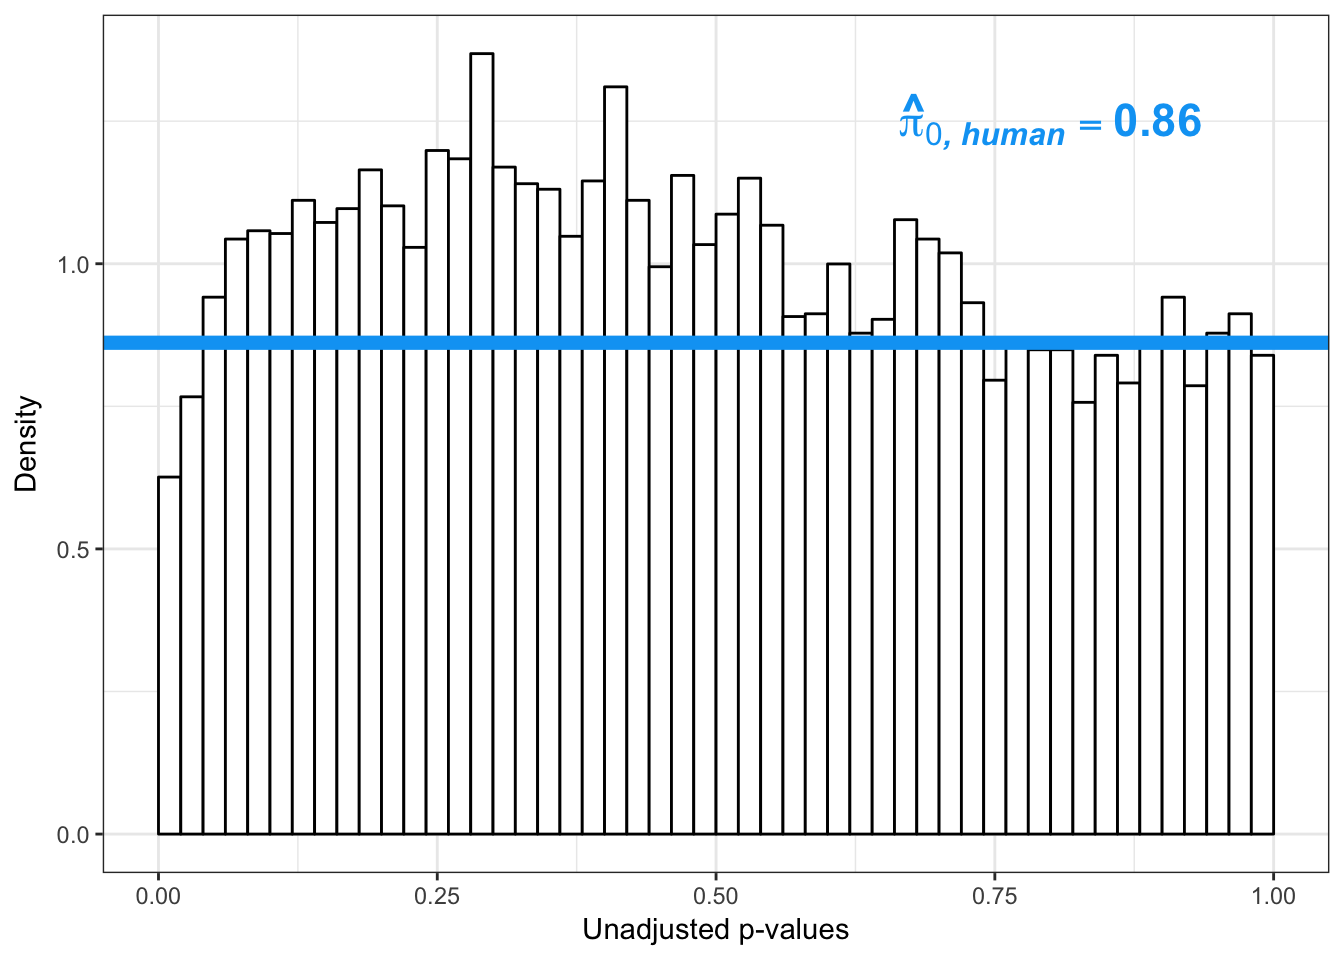
p6s_inc <- ggplot(human_var_pval_inc23, aes(human_var_pval_inc23[,1])) + geom_histogram(aes(y = ..density..), fill="white", colour="black", breaks=seq(0, 1, by = 0.02)) + theme_bw() +
scale_x_continuous(limits = c(0,1)) + labs(x = "Unadjusted p-values") + labs(y = "Density") + geom_hline(yintercept = boot_pi0s, size=2.5, colour = "#00A4F4") + scale_y_continuous(labels=scaleFUN) +
annotate("text", label='bold(bolditalic(hat(pi)[0][", human"])=="0.85")', parse=TRUE, x=0.80, y=(1.25), size = 6, colour = "#00A4F4")
p6s_inc
Testing humans increase in variance from days 1 to 3
human_var_pval <- array(NA, dim = c(10304, 1))
for(i in 1:10304){
x <- t(mean_tech_reps[i,11:16])
y <- t(mean_tech_reps[i,31:36])
htest <- var.test(x, y, alternative = c("less"))
human_var_pval[i,1] <- htest$p.value
}
human_var_pval_inc13 <- as.data.frame(human_var_pval)
# Make a histogram of the unadjusted p-values
hist(human_var_pval, main = c("Humans days 0 to 1"))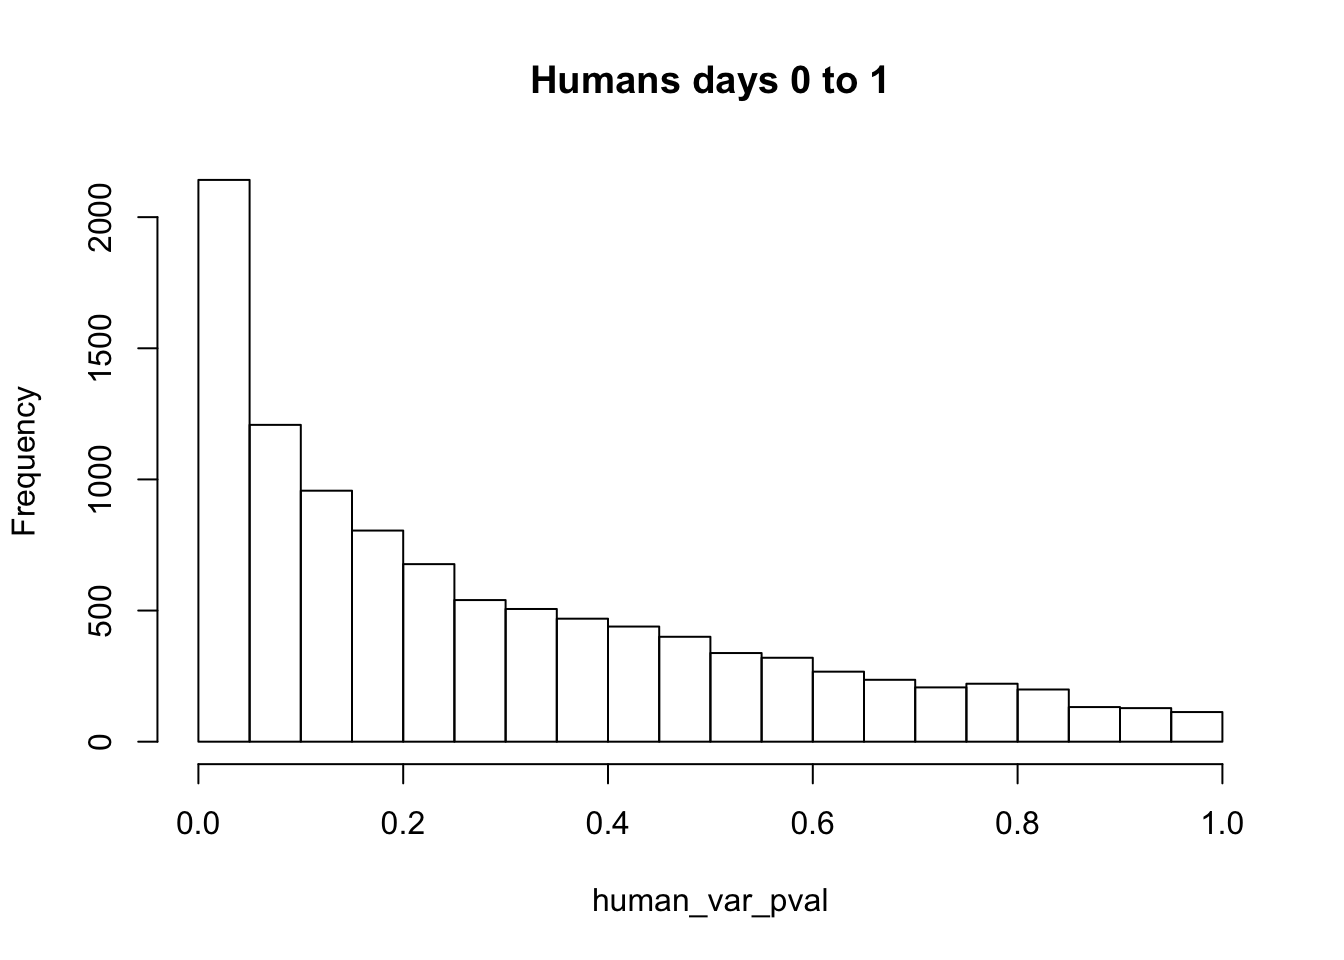
# Go from unadjusted to B.H. adjusted p-values
fdr_adj <- p.adjust(human_var_pval, method = c("fdr") )

summary(fdr_adj)
Min. 1st Qu. Median Mean 3rd Qu. Max.
0.03533 0.26036 0.40614 0.44127 0.59814 0.99985 # How many B.H. adjusted p-values < 0.05?
length(which(fdr_adj < 0.05))[1] 23# Plot the unadjusted versus adjusted p-values
plot(human_var_pval, fdr_adj, xlim = c(0,1), ylim = c(0,1), xlab = c("p-value of the F-test"), ylab = c("BH-adj p-value"), main = c("F test results from Human samples Day 2 to 3"))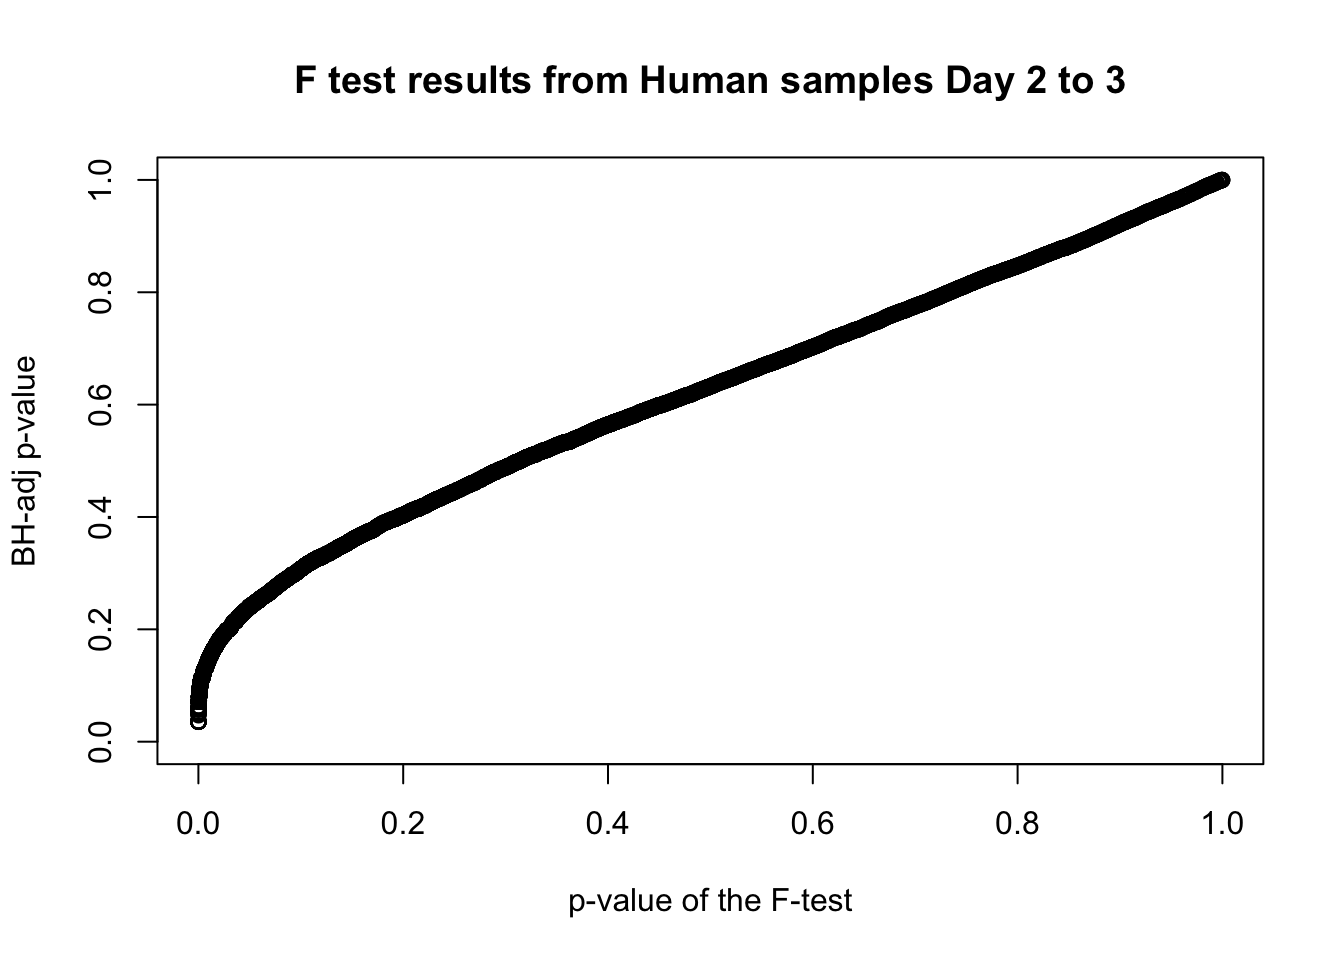
# Obtain Storey's pi_0

boot_pi0 <- qvalue(p=human_var_pval, pi0.method="bootstrap", fdr.level=NULL, robust=TRUE)$pi0

qvalue(p=human_var_pval, pi0.method="bootstrap", fdr.level=NULL, robust=TRUE)$pi0
[1] 0.2413302boot_pi0s <- qvalue(p=human_var_pval, pi0.method="smoother", fdr.level=NULL, robust=TRUE)$pi0
qvalue(p=human_var_pval, pi0.method="smoother", fdr.level=NULL, robust=TRUE)$pi0[1] 0.203399# Obtain pi_1 based on Storey's pi_0
1-qvalue(p=human_var_pval, pi0.method="bootstrap", fdr.level=NULL, robust=TRUE)$pi0[1] 0.75866981-qvalue(p=human_var_pval, pi0.method="smoother", fdr.level=NULL, robust=TRUE)$pi0[1] 0.796601length(which(human_var_pval < 0.05))*(1-qvalue(p=human_var_pval, pi0.method="bootstrap", fdr.level=NULL, robust=TRUE)$pi0)[1] 1625.071p6_13_inc <- ggplot(human_var_pval_inc13, aes(human_var_pval_inc13[,1])) + geom_histogram(aes(y = ..density..), fill="white", colour="black", breaks=seq(0, 1, by = 0.02)) + theme_bw() +
scale_x_continuous(limits = c(0,1)) + labs(x = "Unadjusted p-values") + labs(y = "Density") + geom_hline(yintercept = boot_pi0, size=2.5, colour = "#00A4F4") + scale_y_continuous(labels=scaleFUN) +
annotate("text", label='bold(bolditalic(hat(pi)[0][", human"])=="0.24")', parse=TRUE, x=0.80, y=(2), size = 6, colour = "#00A4F4")
p6_13_inc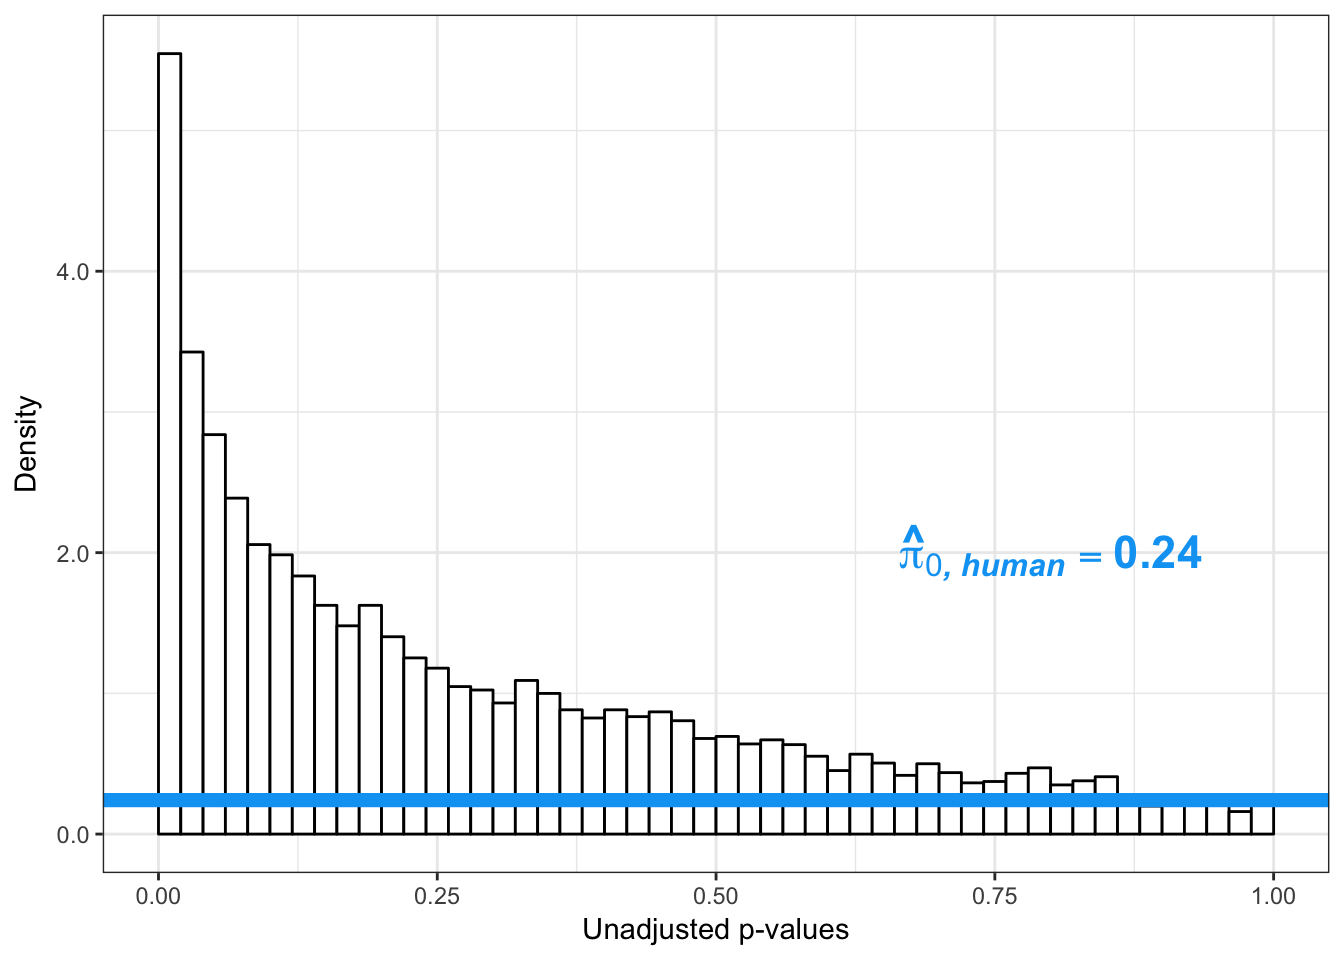
p6_13s_inc <- ggplot(human_var_pval_inc13, aes(human_var_pval_inc13[,1])) + geom_histogram(aes(y = ..density..), fill="white", colour="black", breaks=seq(0, 1, by = 0.02)) + theme_bw() +
scale_x_continuous(limits = c(0,1)) + labs(x = "Unadjusted p-values") + labs(y = "Density") + geom_hline(yintercept = boot_pi0s, size=2.5, colour = "#00A4F4") + scale_y_continuous(labels=scaleFUN) +
annotate("text", label='bold(bolditalic(hat(pi)[0][", human"])=="0.20")', parse=TRUE, x=0.80, y=(2), size = 6, colour = "#00A4F4")
p6_13s_inc
Plot reduction in variation (pi_0 determined by a bootstrap method)
# Chimps on the top; humans on the bottom
multiplot(p1_inc,p4_inc,p2_inc,p5_inc,p3_inc,p6_inc,p3_13_inc, p6_13_inc, cols=4)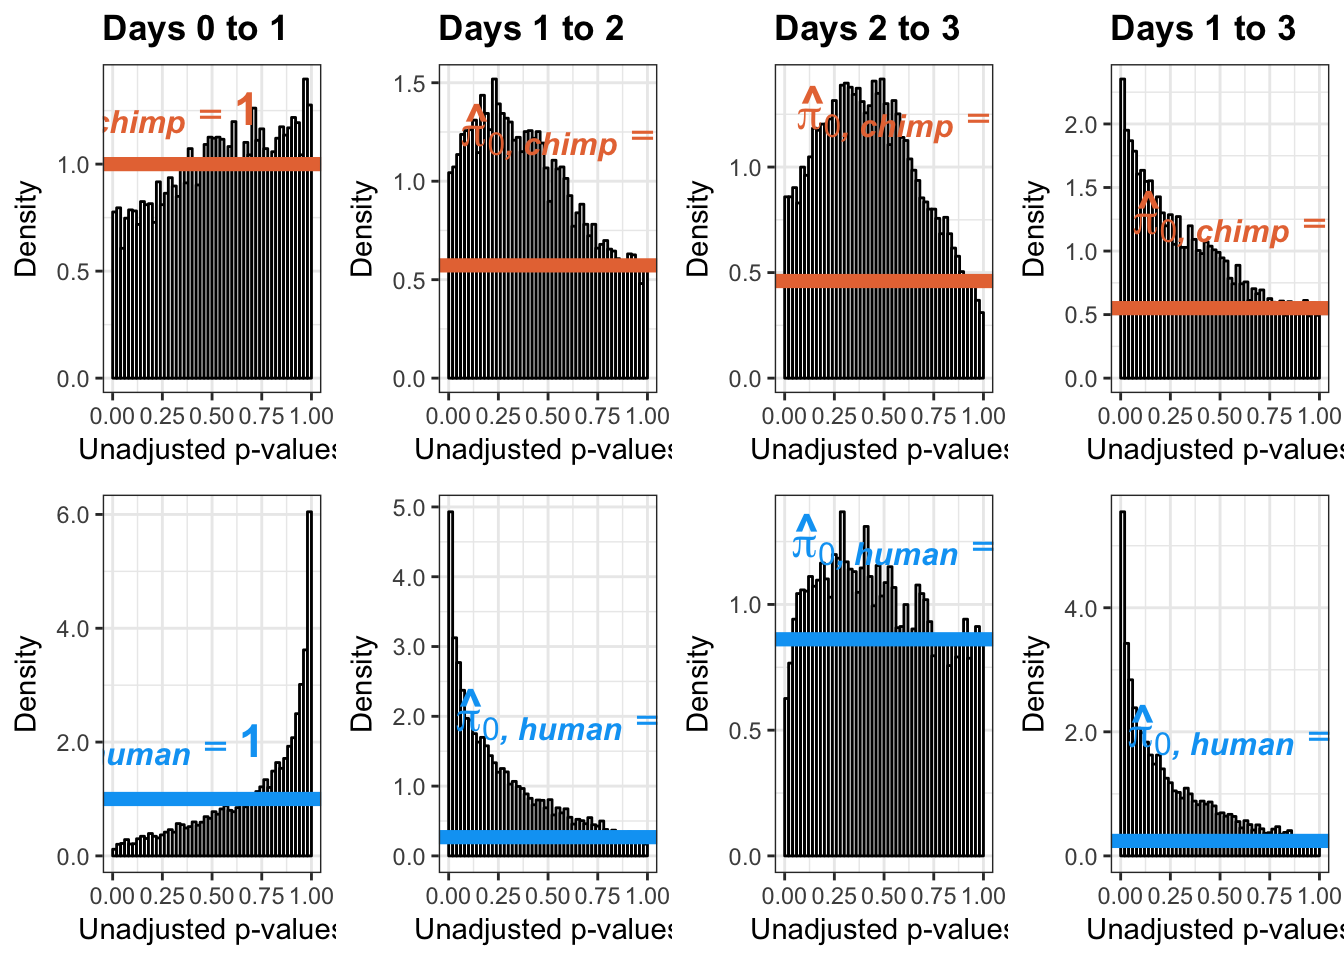
# Chimps on the left, humans on the right
#multiplot(p1,p2,p3,p3_13,p4,p5,p6, p6_13, cols=2)
Plot reduction in variation (pi_0 determined by a smoother method)
# Chimps on the top; humans on the bottom
multiplot(p1s_inc,p4s_inc,p2s_inc,p5s_inc,p3s_inc,p6s_inc,p3_13s_inc, p6_13s_inc, cols=4)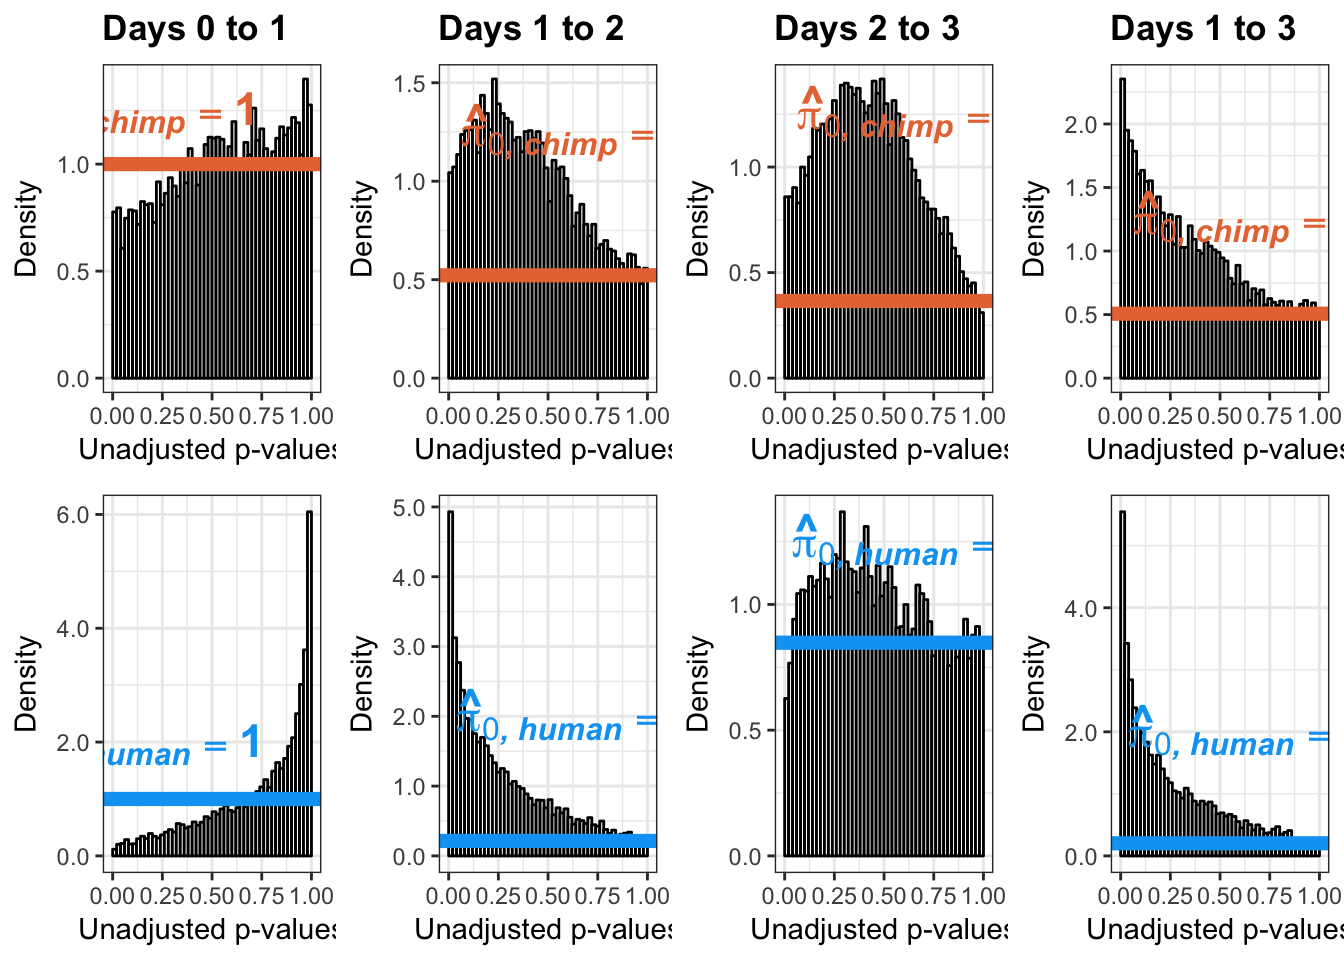
# Chimps on the left, humans on the right
#multiplot(p1s,p2s,p3s,p3_13s,p4s,p5s,p6s, p6_13s, cols=2)The pairwise changes in variance were robust with respect to p-value cutoff
Changes in variance in chimp samples (p-value cutoff 0.05)
# Reduction in variance from day 0 to day 1 chimps
qqplot_red_day01 <- find_qqplot_red_chimps(7,10,17,20,1,6,11,16, 0.05)

# Reduction in variance from day 1 to day 2 chimps
qqplot_red_day12 <- find_qqplot_red_chimps(17,20,27,30,11,16,21,26, 0.05)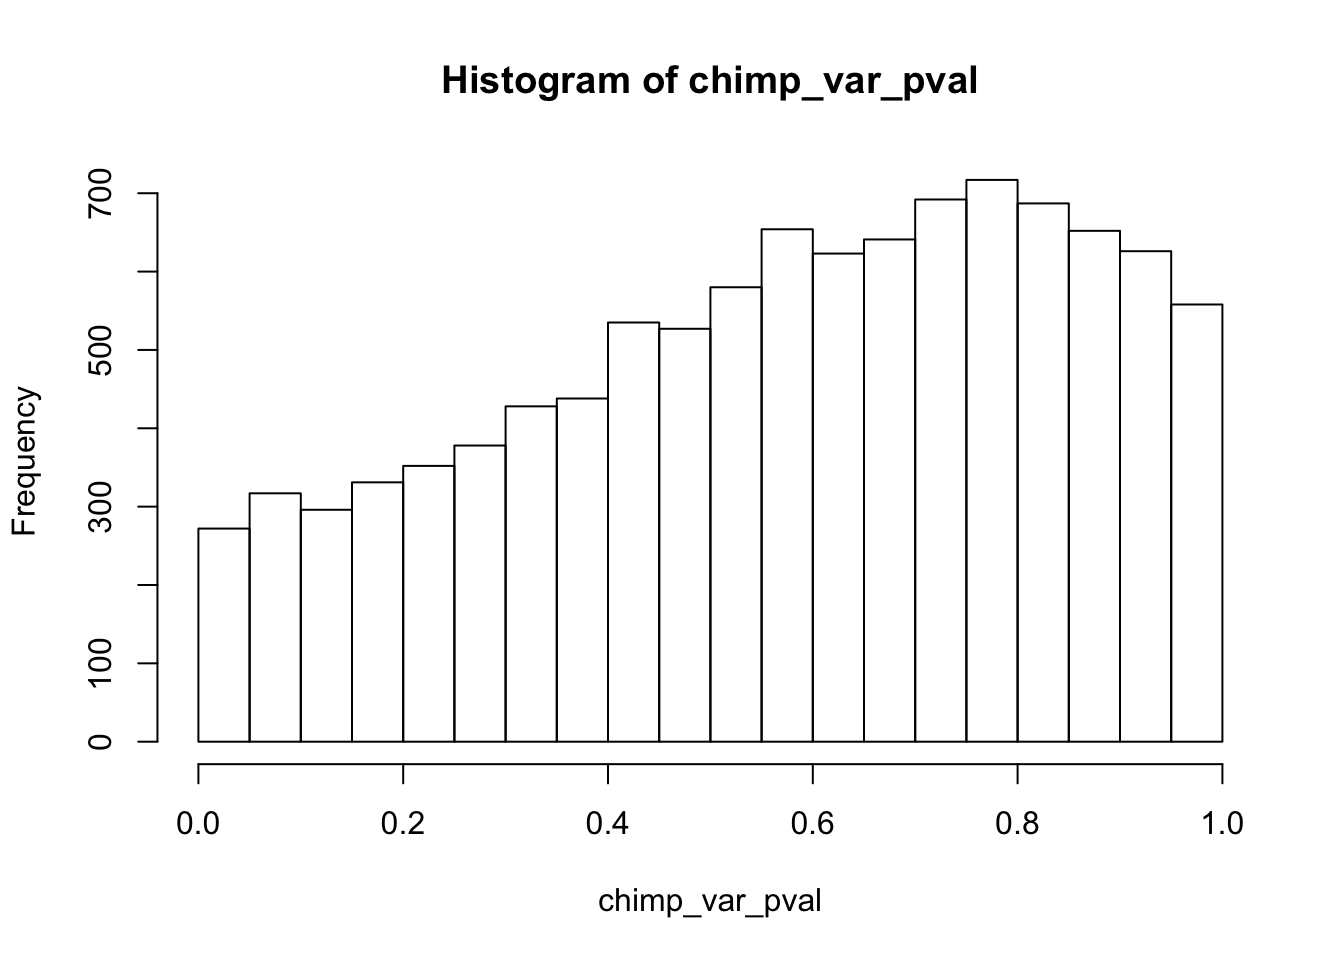

# Reduction in variance from day 2 to day 3 chimps
qqplot_red_day23 <- find_qqplot_red_chimps(27,30,37,40,21,26,31,36, 0.05)

# Reduction in variance from day 0 to day 2 chimps
qqplot_red_day02 <- find_qqplot_red_chimps(7,10,27,30,1,6,21,26, 0.05)

# Reduction in variance from day 1 to day 3 chimps
qqplot_red_day13 <- find_qqplot_red_chimps(17,20,37,40,11,16,31,36, 0.05)

# Inc. in variance from day 0 to day 1
qqplot_inc_day01 <- find_qqplot_inc_chimps(7,10,17,20,1,6,11,16, 0.05)
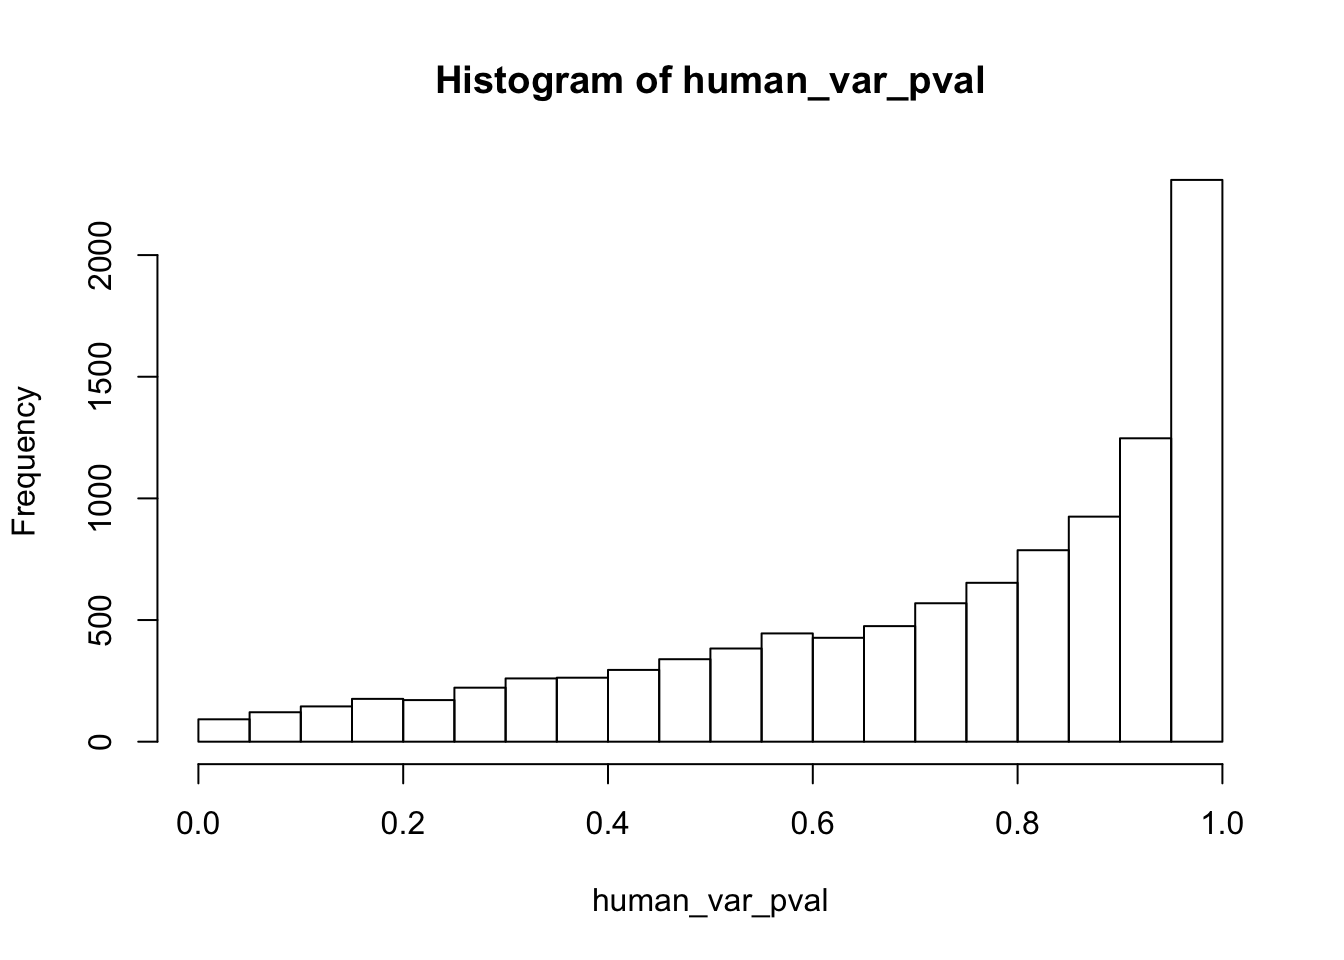
# Inc. in variance from day 1 to day 2
qqplot_inc_day12 <- find_qqplot_inc_chimps(17,20,27,30,11,16,21,26, 0.05)
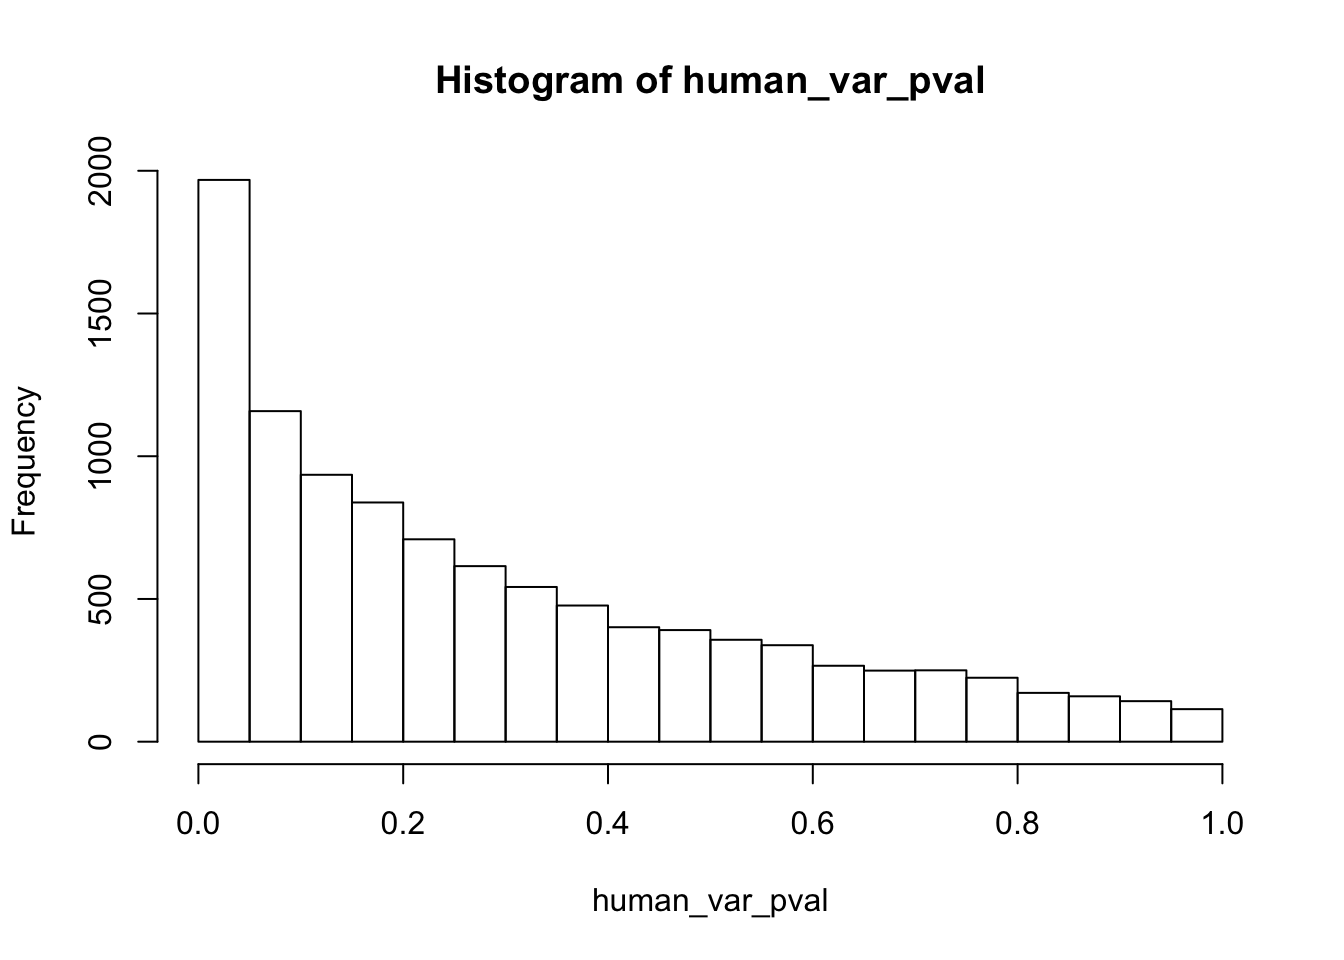
# Inc. in variance from day 2 to day 3
qqplot_inc_day23 <- find_qqplot_inc_chimps(27,30,37,40,21,26,31,36, 0.05)

# Inc. in variance from day 0 to day 2
qqplot_inc_day02 <- find_qqplot_inc_chimps(7,10,27,30,1,6,21,26, 0.05)

# Inc. in variance from day 1 to day 3
qqplot_inc_day13 <- find_qqplot_inc_chimps(17,20,37,40,11,16,31,36, 0.05)
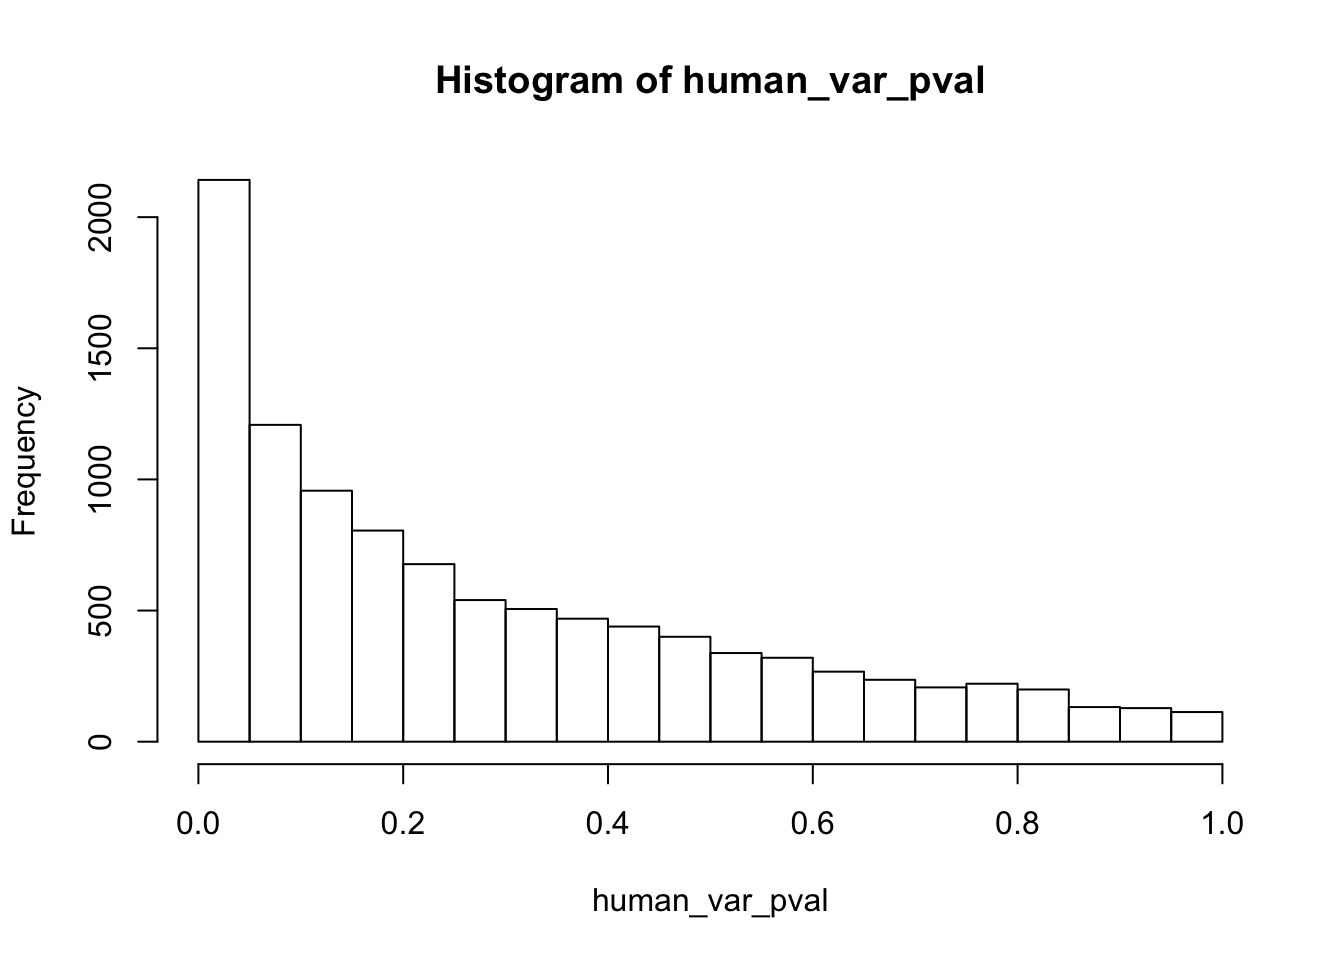
# Reduction of variance qqplots- chimps
par(mfrow=c(2,4),oma = c(2, 2, 2, 2))
# Reduction of variance to day 0 to 1 chimps
plot(qqplot_red_day01[[4]],qqplot_red_day01[[5]], pch = 16, xlim = c(0,6), ylim = c(0,6), col = pal[2], xlab = "-log10(p) Expected", ylab = "-log10(p) Obeserved", main = "Day 0 to 1")
abline(0,1, col = "black")
# Add to the plot
points(qqplot_red_day01[[6]],qqplot_red_day01[[7]], pch = 16, col = "red")
# Reduction of variance to day 1 to 2
plot(qqplot_red_day12[[4]],qqplot_red_day12[[5]], pch = 16, xlim = c(0,6), ylim = c(0,6), col = pal[2], xlab = "-log10(p) Expected", ylab = "-log10(p) Obeserved", main = "Day 1 to 2")
abline(0,1, col = "black")
# Add to the plot
points(qqplot_red_day12[[6]],qqplot_red_day12[[7]], pch = 16, col = pal[3])
# Reduction of variance to day 2 to 3
plot(qqplot_red_day23[[4]],qqplot_red_day23[[5]], pch = 16, xlim = c(0,6), ylim = c(0,6), col = pal[2], xlab = "-log10(p) Expected", ylab = "-log10(p) Obeserved", main = "Day 2 to 3")
abline(0,1, col = "black")
# Add to the plot
points(qqplot_red_day23[[6]],qqplot_red_day23[[7]], pch = 16, col = pal[3])
# Reduction of variance to day 0 to 2
plot(qqplot_red_day02[[4]],qqplot_red_day02[[5]], pch = 16, xlim = c(0,6), ylim = c(0,6), col = pal[2], xlab = "-log10(p) Expected", ylab = "-log10(p) Obeserved", main = "Day 0 to 2")
abline(0,1, col = "black")
# Add to the plot
points(qqplot_red_day02[[6]],qqplot_red_day02[[7]], pch = 16, col = pal[3])
# Add bottom title
mtext("Reduction in Variation", font = 2, side = 3, line = -1.5, outer = TRUE)
### Increase in variance
# Inc variance to day 0 to 1
plot(qqplot_inc_day01[[4]],qqplot_inc_day01[[5]], pch = 16, xlim = c(0,6), ylim = c(0,6), col = pal[2], xlab = "-log10(p) Expected", ylab = "-log10(p) Obeserved", main = "Day 0 to 1")
abline(0,1, col = "black")
# Add to the plot
points(qqplot_inc_day01[[6]],qqplot_inc_day01[[7]], pch = 16, col = pal[3])
# Increase of variance to day 1 to 2
plot(qqplot_inc_day12[[4]],qqplot_inc_day12[[5]], pch = 16, xlim = c(0,6), ylim = c(0,6), col = pal[2], xlab = "-log10(p) Expected", ylab = "-log10(p) Obeserved", main = "Day 1 to 2")
abline(0,1, col = "black")
# Add to the plot
points(qqplot_inc_day12[[6]],qqplot_inc_day12[[7]], pch = 16, col = pal[3])
# Increase of variance to day 2 to 3
plot(qqplot_inc_day23[[4]],qqplot_inc_day23[[5]], pch = 16, xlim = c(0,6), ylim = c(0,6), col = pal[2], xlab = "-log10(p) Expected", ylab = "-log10(p) Obeserved", main = "Day 2 to 3")
abline(0,1, col = "black")
# Add to the plot
points(qqplot_inc_day23[[6]],qqplot_inc_day23[[7]], pch = 16, col = pal[3])
# Increase of variance to day 0 to 2
plot(qqplot_inc_day02[[4]],qqplot_inc_day02[[5]], pch = 16, xlim = c(0,6), ylim = c(0,6), col = pal[2], xlab = "-log10(p) Expected", ylab = "-log10(p) Obeserved", main = "Day 0 to 2")
abline(0,1, col = "black")
# Add to the plot
points(qqplot_inc_day02[[6]],qqplot_inc_day02[[7]], pch = 16, col = pal[3])
mtext("Increase in Variation", font = 2, side = 3, line = -29, outer = TRUE)
par(fig = c(0, 1, 0, 1), oma = c(0, 0, 0, 0), mar = c(0, 0, 0, 0), new = TRUE)
plot(0, 0, type = "n", bty = "n", xaxt = "n", yaxt = "n")
legend("bottomright", c("Chimpanzee", "Chimpanzee|significant in humans"), xpd = TRUE, horiz = TRUE, inset = c(0, 0), bty = "n", pch = c(16, 16), col = pal[2:3], cex = 1.5)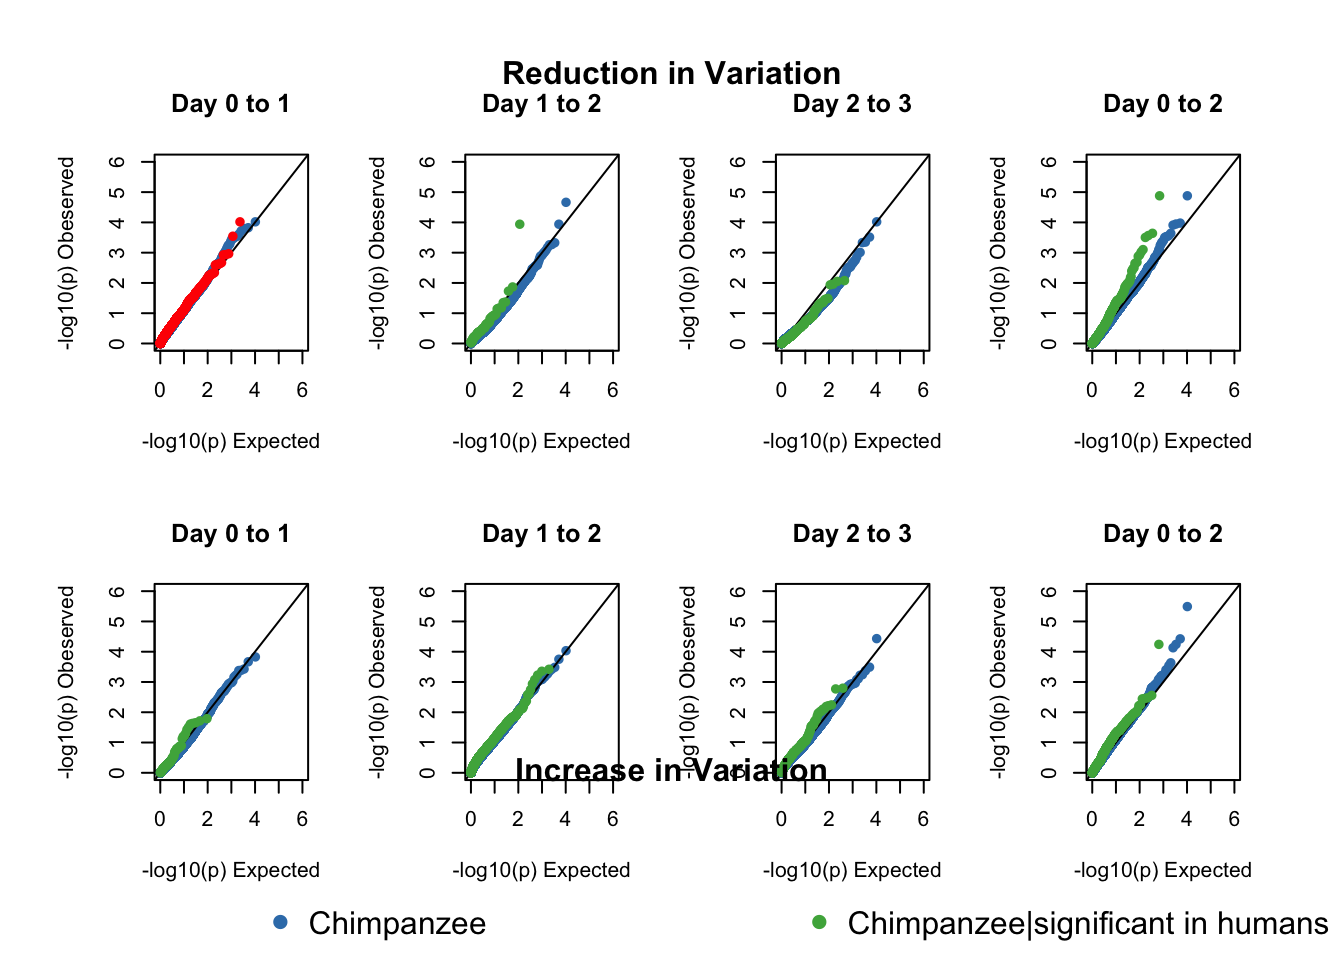
#legend("top", c("Chimpanzee", "Chimpanzee|significant in humans"), xpd = TRUE, horiz = TRUE, inset = c(0, 0), bty = "n", pch = c(16, 16), col = pal[2:3], cex = 0.7)Estimates of pi0 and pi1 for reduction of variation in chimps conditioned on significance in humans (p = 0.05)
library("qvalue")
################ REDUCTION IN VARIATION FOR CHIMPS (p = 0.05) ################
# Day 0 to 1
# Obtain pvalues
chimp_p_values_gen <- as.data.frame(qqplot_red_day01[1])
shared_p_values_gen <- as.data.frame(qqplot_red_day01[2])
# Pi_0 estimate for the chimps
pi0est_chimps <- qvalue(p=chimp_p_values_gen, pi0.method="smoother", fdr.level=NULL, robust=TRUE)$pi0
pi0est_chimps[1] 0.7259161# Pi_1 estimate for the chimps
pi1est_chimps <- 1 - pi0est_chimps
pi1est_chimps[1] 0.2740839# Pi_0 estimate for the chimps given significant in the humans
pi0est_chimps_given_humans <- qvalue(p=shared_p_values_gen, pi0.method="smoother", fdr.level=NULL, robust=TRUE)$pi0
pi0est_chimps_given_humans[1] 0.5348868# Pi_1 estimate for the humans
pi1est_chimps_given_humans <- 1 - pi0est_chimps_given_humans
pi1est_chimps_given_humans[1] 0.4651132# Let's overlap the two histograms
labels_c <- array("Chimpanzee", dim = c(10304,1))
labels_h <- array("Chimpanzee|Sig. in Humans", dim = c(as.data.frame(qqplot_red_day01[[3]][2]),1))
chimps <- cbind(labels_c, chimp_p_values_gen)
colnames(chimps) <- c("Species", "pval")
humans <- cbind(labels_h, shared_p_values_gen)
colnames(humans) <- c("Species", "pval")
# Combine the two
all_pval <- rbind(chimps[,1:2], humans[,1:2])
pal <- c("#00A4F4", "#E77642", "white")
p1_05 <- ggplot(all_pval, aes(pval, fill = Species)) + scale_fill_manual(values=pal[2:3]) +
geom_density(show.legend = F, alpha = 1) +
scale_x_continuous(limits = c(-0.2,1.2), breaks = seq(0,1,0.25)) +
theme_bw() + labs(title = "Day 0 to 1") + theme(plot.title = element_text(face = "bold")) + labs(x = "Unadjusted p-values") + labs(y = "Density") +
geom_hline(yintercept = pi0est_chimps_given_humans, size = 2.5) +
geom_hline(yintercept = pi0est_chimps, size = 2.5, color = "#E77642") + scale_y_continuous(labels=scaleFUN) +
annotate("text", label= 'bold(bolditalic(hat(pi)[0][", chimps"])=="0.73")', parse=TRUE, x=0.4, y=(pi0est_chimps+0.07), colour = "#E77642", size = 6) + annotate("text", label = 'bold(bolditalic(hat(pi)[0][", shared"])=="0.53")', parse=TRUE, x=0.4, y=(pi0est_chimps_given_humans+0.07), size = 6)
p1_05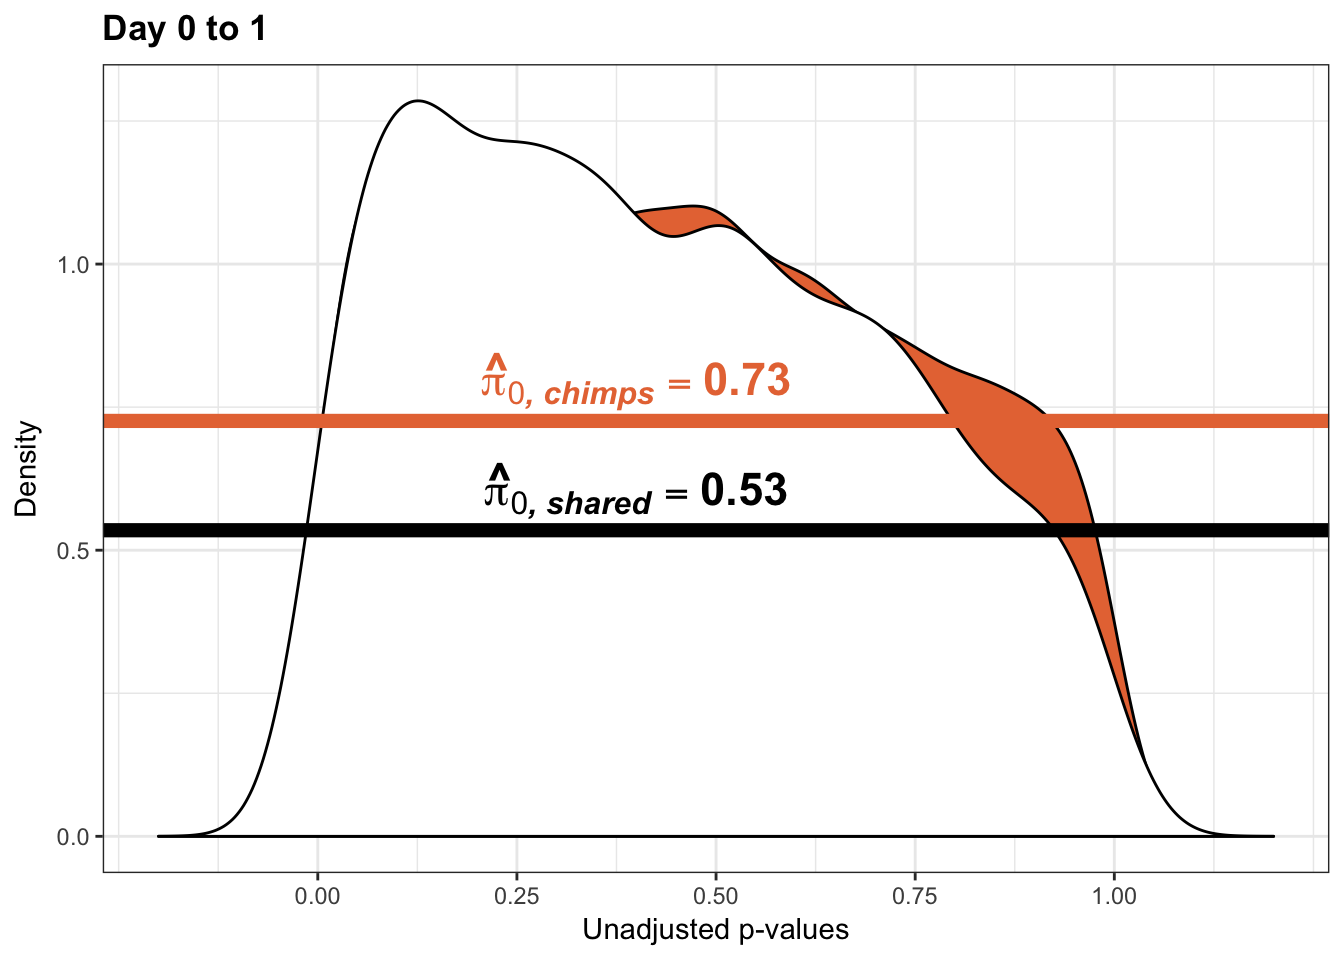
pal <- c( "#E77642", "gray")
ggplot(all_pval, aes(pval, fill = Species)) + scale_fill_manual(values=pal[1:2]) + geom_histogram(binwidth = 0.07)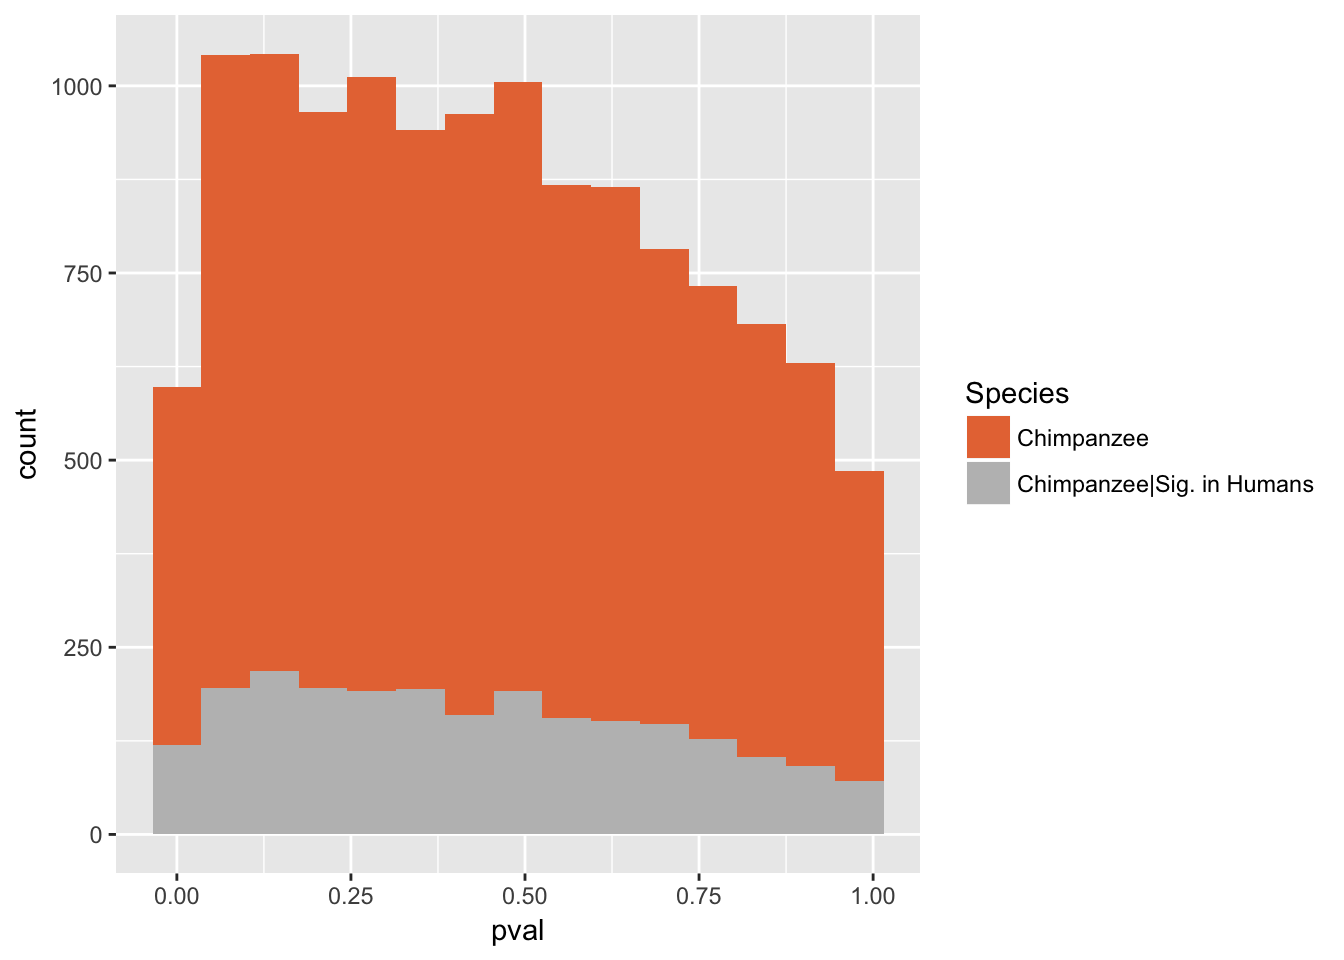
ggplot(chimps[,1:2], aes(pval, fill = Species)) + scale_fill_manual(values=pal[1:2]) + geom_histogram(aes(y=..density..), binwidth = 0.07) + geom_density() 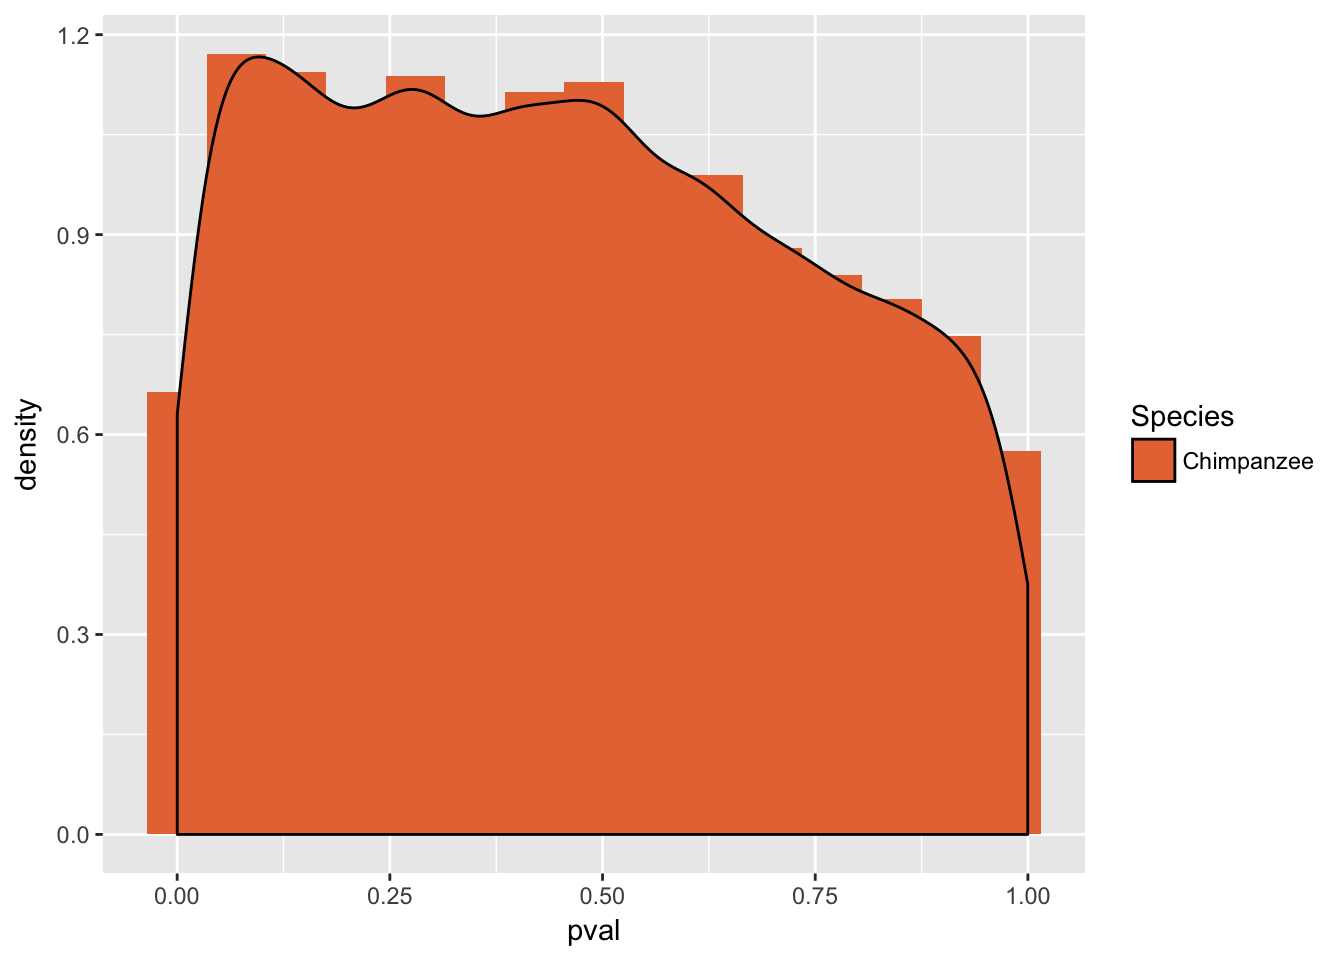
ggplot(all_pval, aes(pval, fill = Species)) + scale_fill_manual(values=pal[2:3]) + geom_density() + scale_x_continuous(limits = c(-0.2,1.2), breaks = seq(0,1,0.25))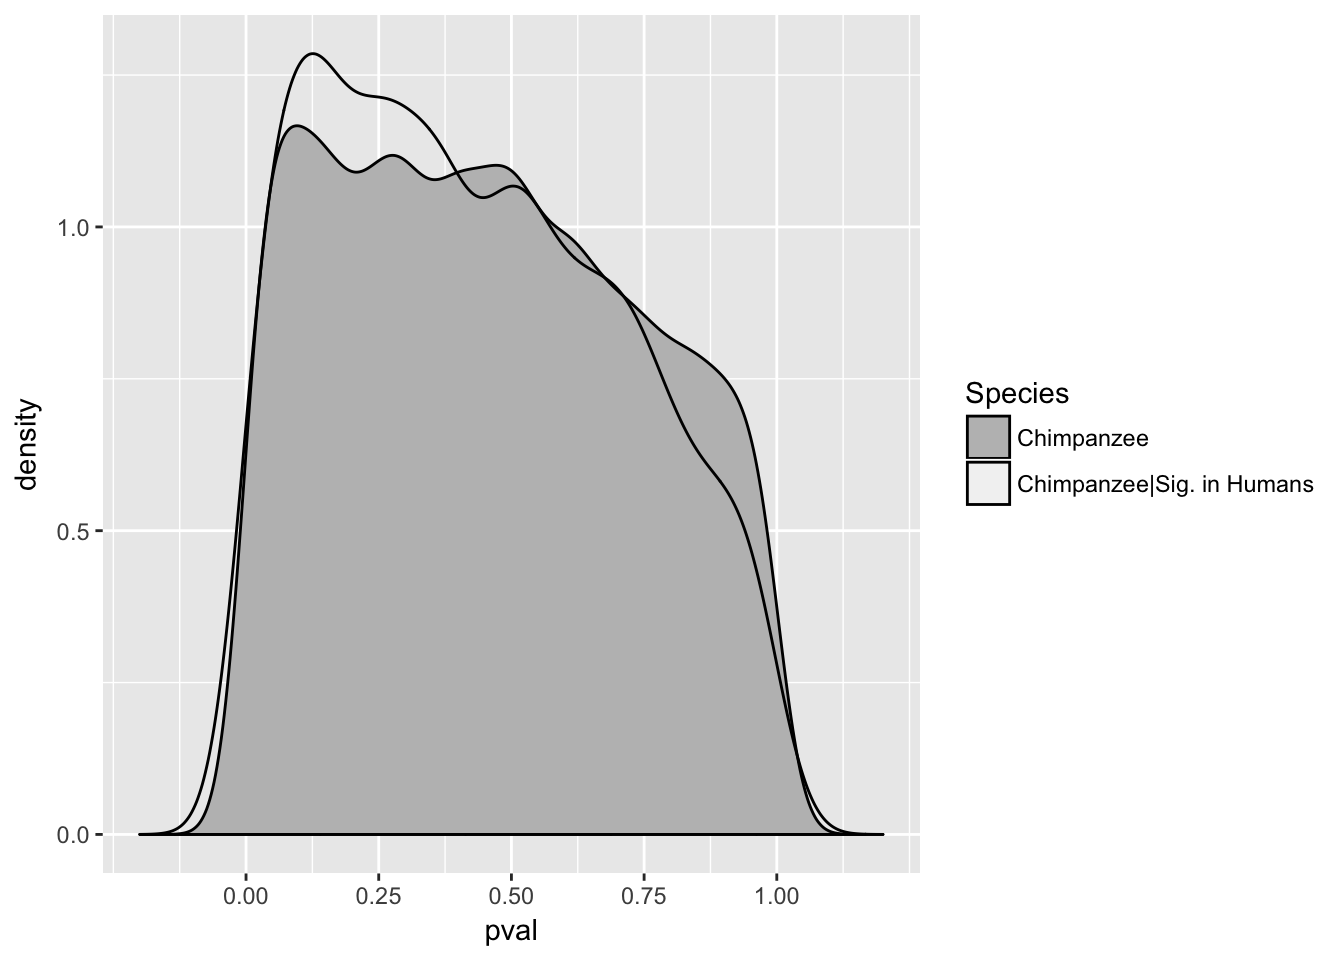
ggplot(all_pval, aes(pval, fill = Species)) + scale_fill_manual(values=pal[1:2]) + geom_histogram(alpha = 1, aes(y = ..density..), position = 'identity', bins = 15, show.legend = FALSE) + theme_bw() + facet_wrap(~Species) + labs(x = "Unadjusted p-values") + labs(y = "Density") + bjp +
geom_hline(data=data.frame(Species = "Chimpanzee"), aes(yintercept = 0.27, show.legend = NA)) + geom_hline(data=data.frame(Species = "Chimpanzee|Sig. in Humans"), aes(yintercept = 0.47, show.legend = NA))Warning: Ignoring unknown aesthetics: show.legend
Warning: Ignoring unknown aesthetics: show.legend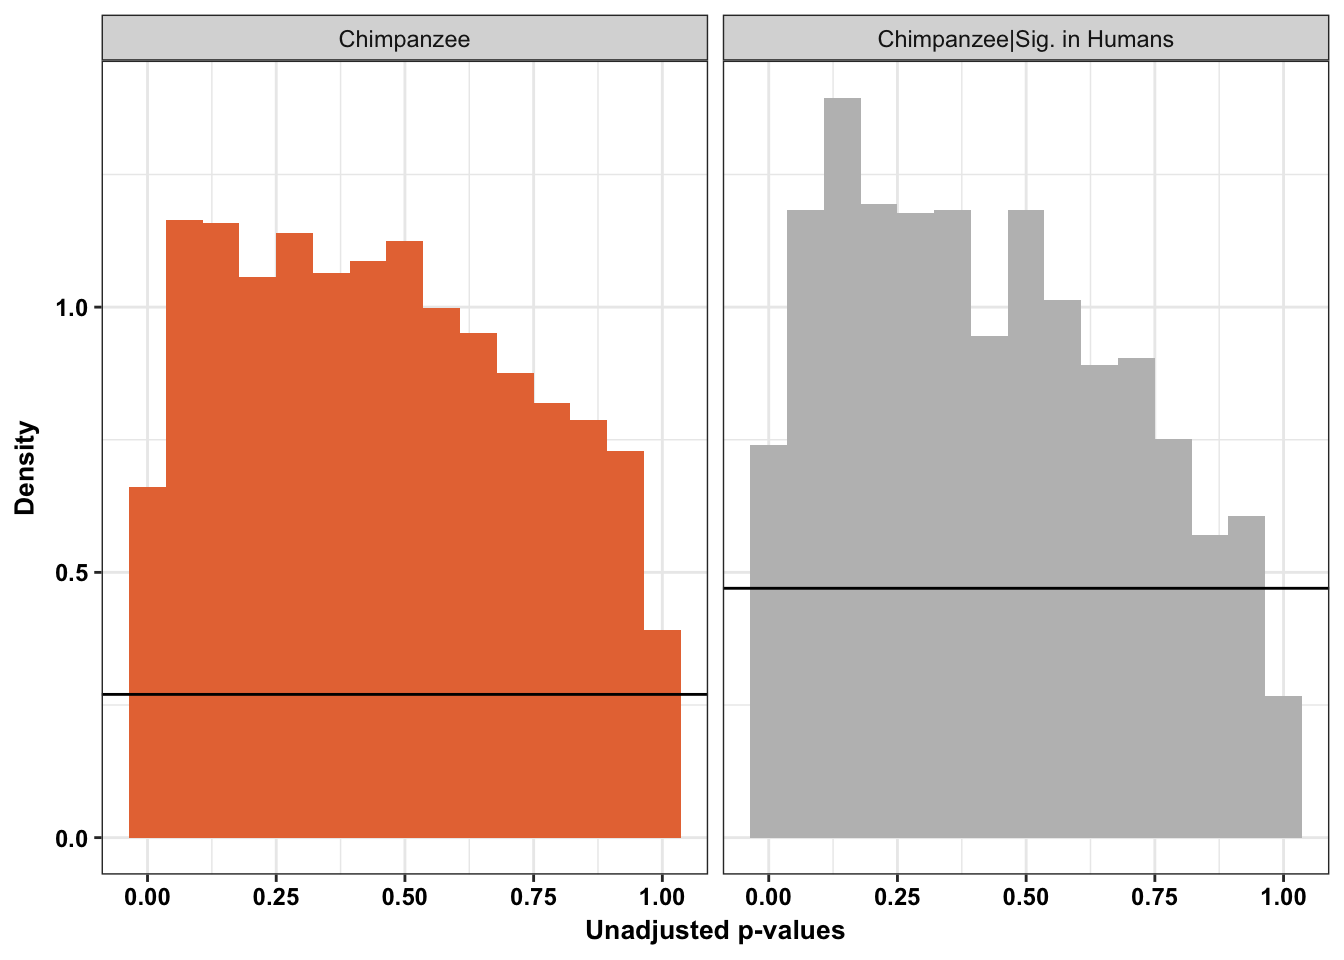
ggplot(all_pval, aes(pval, fill = Species)) + scale_fill_manual(values=pal[1:2]) + geom_histogram(alpha = 0.6, aes(y = ..density..), position = 'identity', bins = 15, show.legend = FALSE, color = "black") + theme_bw()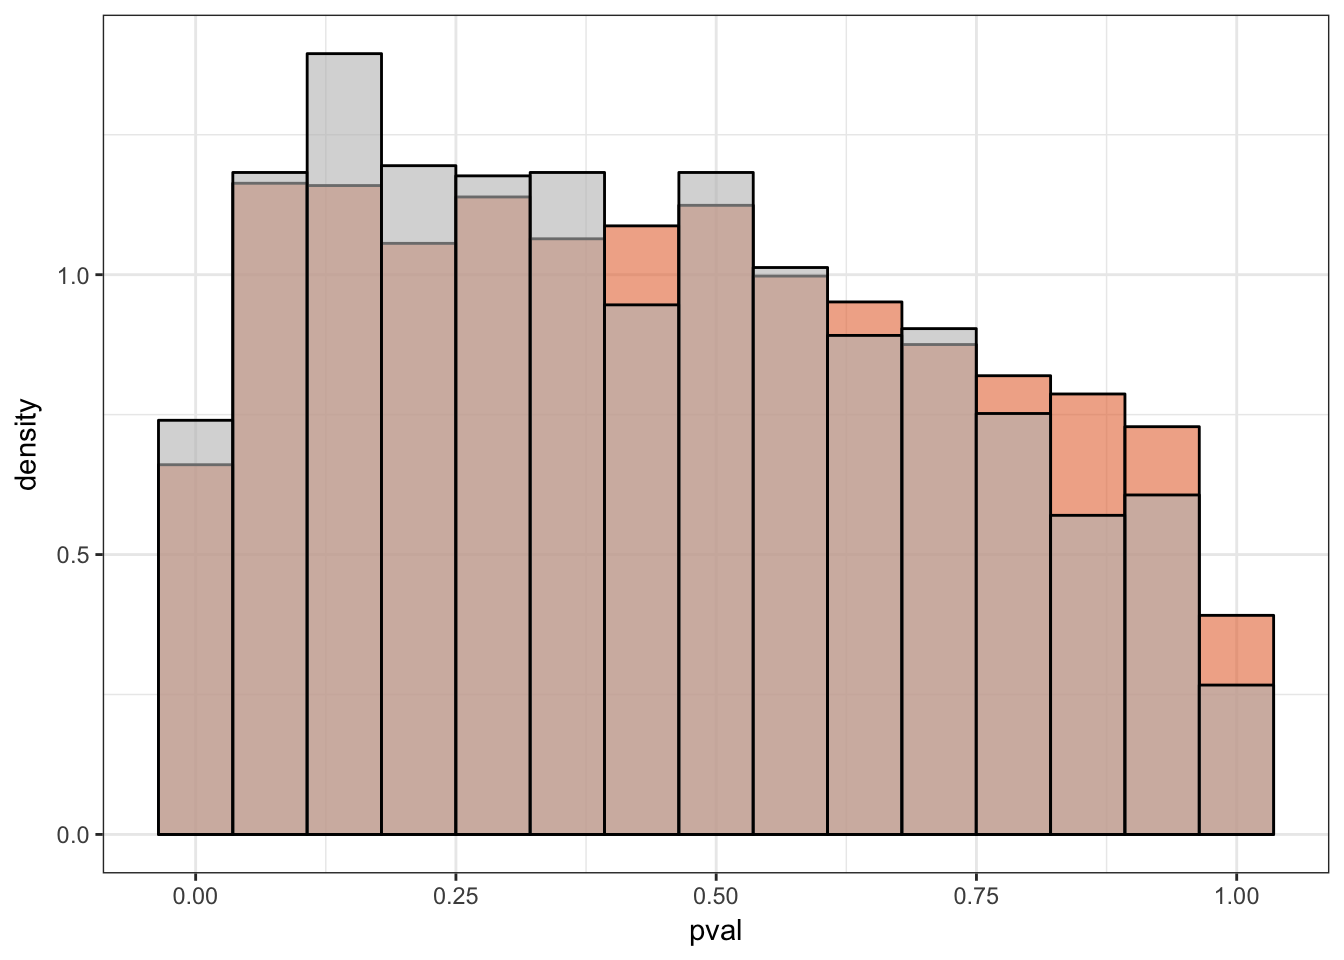
ggplot(all_pval, aes(pval)) +
geom_histogram(data=subset(all_pval, Species == 'Chimpanzee'), alpha = 1, aes(y = ..density..), position = 'identity', bins = 15, show.legend = FALSE, fill = "#E77642", color = "black") +
geom_histogram(data=subset(all_pval, Species == 'Chimpanzee|Sig. in Humans'), alpha = 0.8, aes(y = ..density..), position = 'identity', bins = 15, show.legend = FALSE, fill = "gray") + labs(x = "Unadjusted p-values", y = "Density") + theme_bw() + bjpm + scale_y_continuous(labels=scaleFUN) +
geom_hline(yintercept = pi0est_chimps_given_humans, size = 1.5) +
geom_hline(yintercept = pi0est_chimps, size = 1.5) +
annotate("text", label= 'bold(bolditalic(hat(pi)[0][", chimps"])=="0.73")', parse=TRUE, x=0.2, y=(pi0est_chimps+0.07), size = 6) + annotate("text", label = 'bold(bolditalic(hat(pi)[0][", shared"])=="0.53")', parse=TRUE, x=0.2, y=(pi0est_chimps_given_humans+0.07), size = 6) + labs(x = "Unadjusted p-values")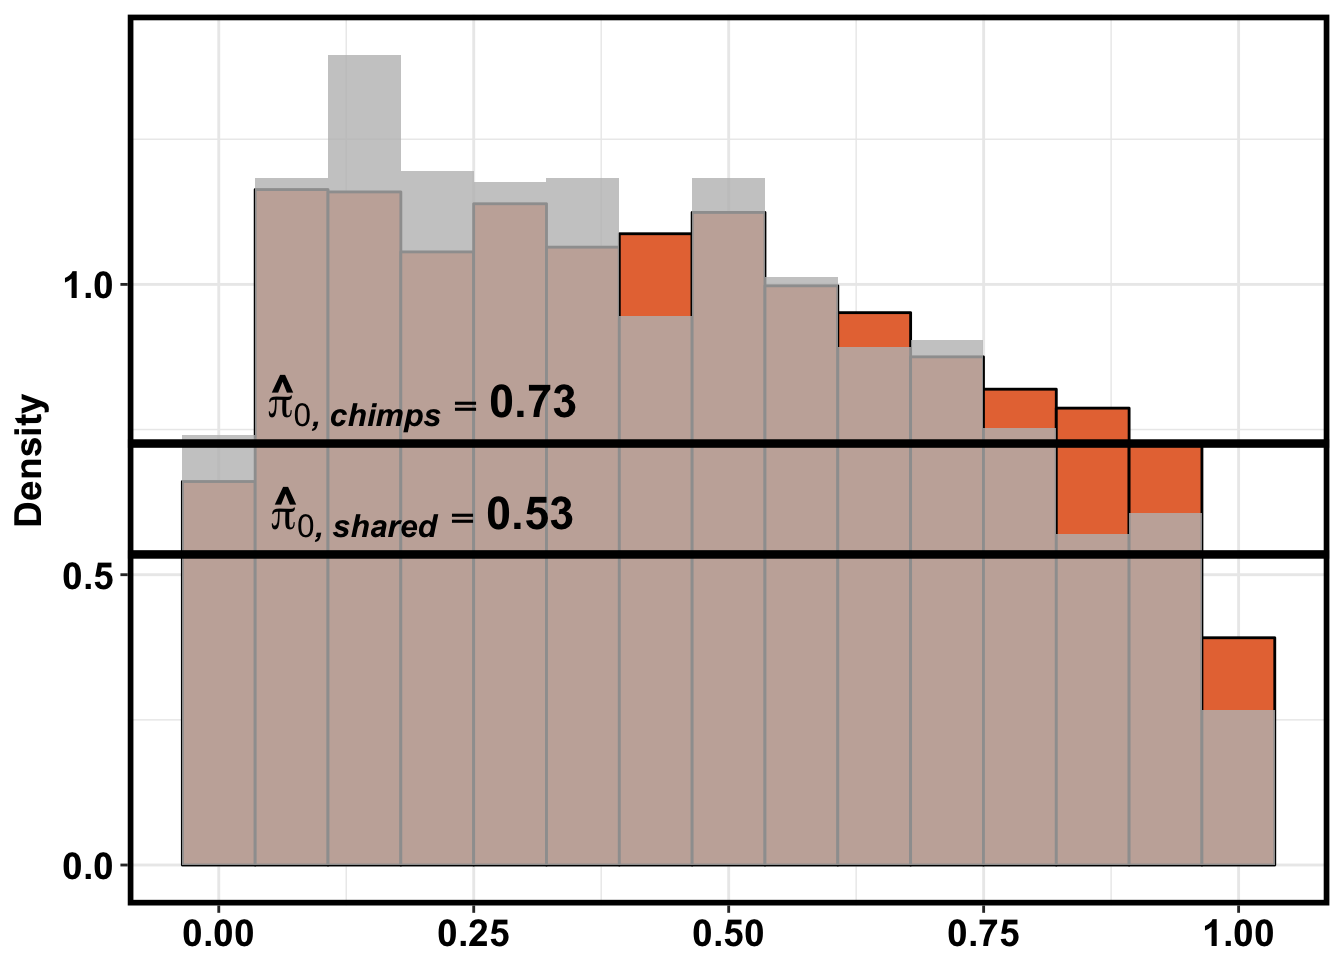
ggplot(all_pval, aes(pval)) +
geom_histogram(data=subset(all_pval, Species == 'Chimpanzee'), alpha = 1, aes(y = ..density..), position = 'identity', bins = 15, show.legend = FALSE, fill = "#E77642", color = "black") +
geom_histogram(data=subset(all_pval, Species == 'Chimpanzee|Sig. in Humans'), alpha = 0.8, aes(y = ..density..), position = 'identity', bins = 15, show.legend = FALSE, fill = "gray") + theme_bw() + bjpm + scale_y_continuous(labels=scaleFUN) + labs(x = "Unadjusted p-values", y = "Density") +
annotate("text", label= 'bold(bolditalic(hat(pi)[0][", chimps"])=="0.73")', parse=TRUE, x=0.83, y=1.3, size = 7, colour = "#E77642") + annotate("text", label = 'bold(bolditalic(hat(pi)[0][", shared"])=="0.53")', color = "grey32", parse=TRUE, x=0.83, y=1.2, size = 7)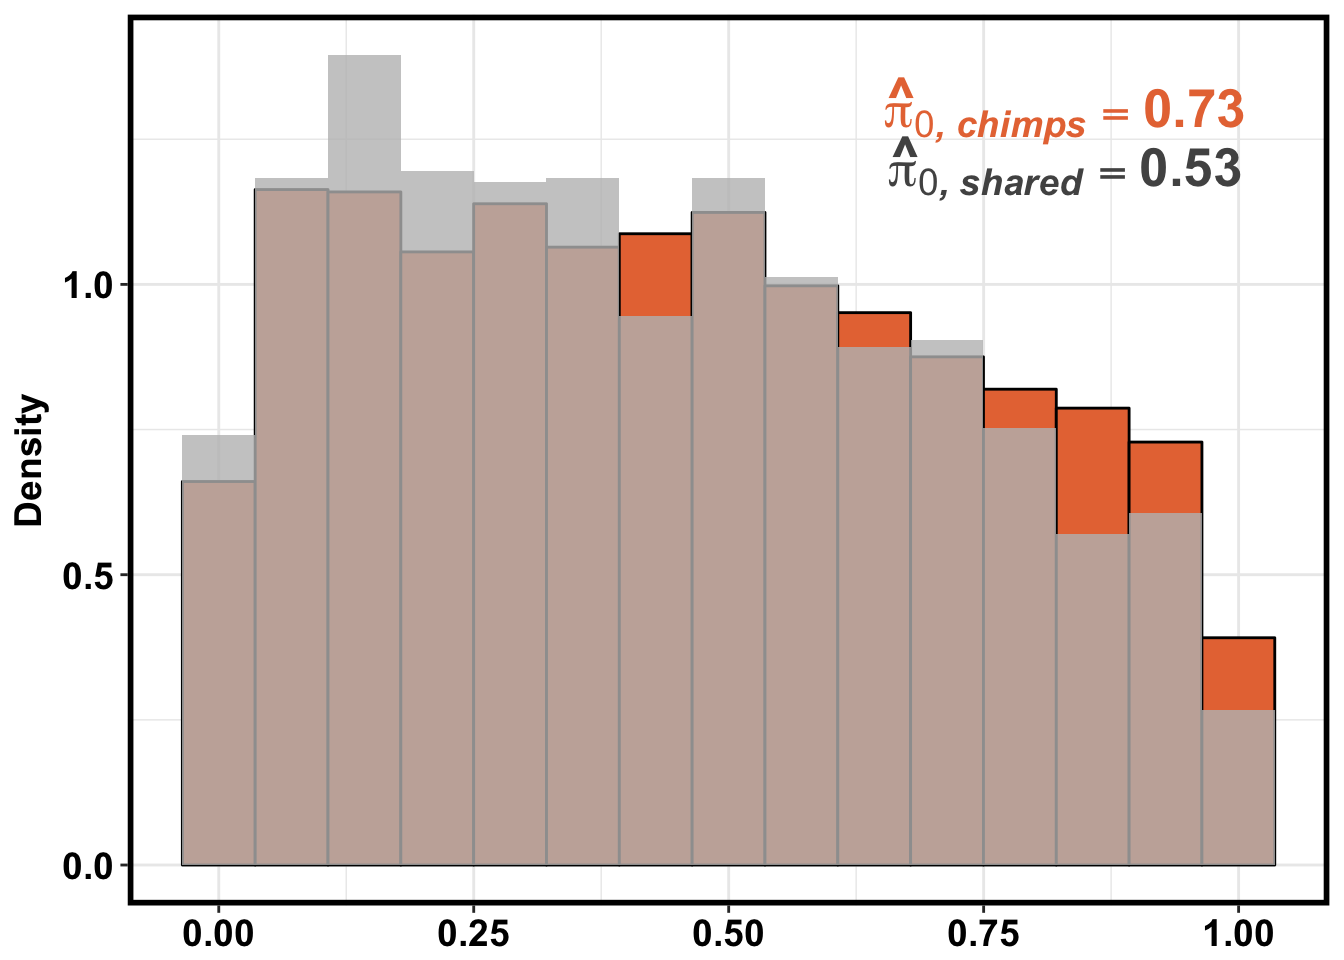
ggplot(all_pval, aes(pval, fill = as.factor(Species))) + scale_fill_manual(values=pal[2:3]) + geom_density(data=subset(all_pval, Species == 'Chimpanzee'), alpha = 1, fill = "#E77642") + geom_density(data=subset(all_pval, Species == 'Chimpanzee|Sig. in Humans'), alpha = 0.5, fill = "cyan4") + theme_bw() +
scale_x_continuous(limits = c(0,1), breaks = seq(0,1,0.25)) +
theme_bw() + labs(title = "Day 0 to 1") + theme(plot.title = element_text(face = "bold")) + labs(x = "Unadjusted p-values") + labs(y = "Density") +
geom_hline(yintercept = pi0est_chimps_given_humans, size = 2.5) +
geom_hline(yintercept = pi0est_chimps, size = 2.5, color = "#E77642") + scale_y_continuous(labels=scaleFUN) +
annotate("text", label= 'bold(bolditalic(hat(pi)[0][", chimps"])=="0.73")', parse=TRUE, x=0.4, y=(pi0est_chimps+0.07), colour = "#E77642", size = 6) + annotate("text", label = 'bold(bolditalic(hat(pi)[0][", shared"])=="0.53")', parse=TRUE, x=0.4, y=(pi0est_chimps_given_humans+0.07), size = 6)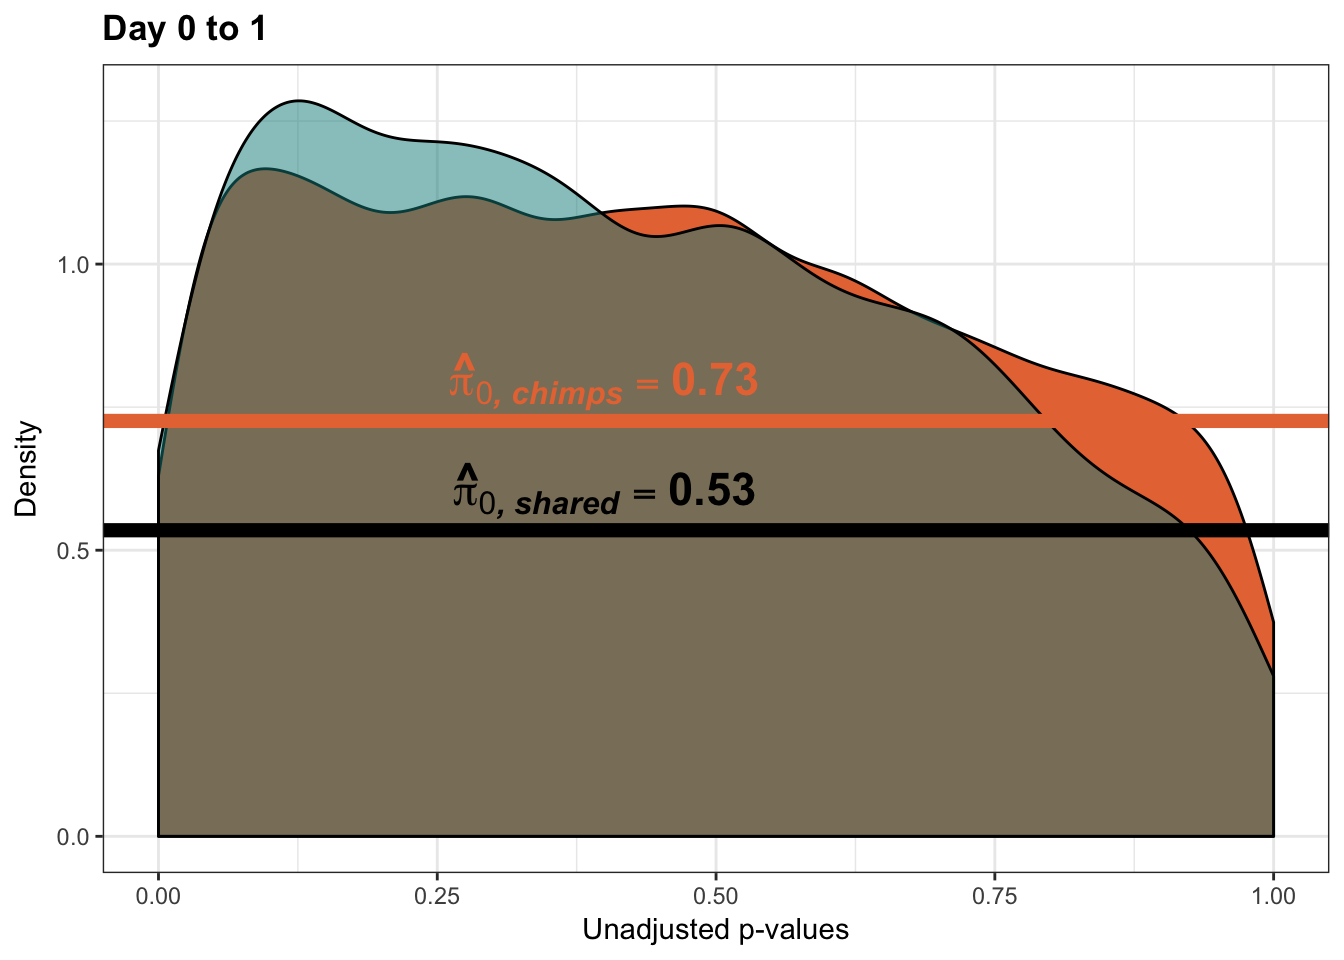
neg_p <- as.data.frame(as.numeric(-(all_pval$pval)))
chimps_neg <- cbind(labels_c, neg_p[1:10304,])
colnames(chimps_neg) <- c("Species", "pval")
humans_neg <- cbind(labels_h, neg_p[10305:12613,])
colnames(humans_neg) <- c("Species", "pval")
all_pval <- rbind(chimps[,1:2], humans[,1:2])
right_side <- as.data.frame(2-all_pval$pval)
chimps_rs <- cbind(labels_c, right_side[1:10304,])
colnames(chimps_rs) <- c("Species", "pval")
humans_rs <- cbind(labels_h, right_side[10305:12613,])
colnames(humans_rs) <- c("Species", "pval")
all_pval_ref <- as.data.frame(rbind(chimps[,1:2], humans[,1:2], chimps_neg, humans_neg, chimps_rs, humans_rs ))
all_pval_ref$pval <- as.numeric(all_pval_ref$pval)
ggplot(all_pval_ref, aes(pval, fill = as.factor(Species))) + scale_fill_manual(values=pal[2:3]) +
geom_density(show.legend = F, alpha = 1) + theme_bw() +
scale_x_continuous(limits = c(-0.5,1.5), breaks = seq(0,1,0.25)) +
theme_bw() + labs(title = "Day 0 to 1") + theme(plot.title = element_text(face = "bold")) + labs(x = "Unadjusted p-values") + labs(y = "Density") +
geom_hline(yintercept = pi0est_chimps_given_humans, size = 2.5) +
geom_hline(yintercept = pi0est_chimps, size = 2.5, color = "#E77642") + scale_y_continuous(labels=scaleFUN) +
annotate("text", label= 'bold(bolditalic(hat(pi)[0][", chimps"])=="0.73")', parse=TRUE, x=0.4, y=(pi0est_chimps+0.07), colour = "#E77642", size = 6) + annotate("text", label = 'bold(bolditalic(hat(pi)[0][", shared"])=="0.53")', parse=TRUE, x=0.4, y=(pi0est_chimps_given_humans+0.07), size = 6)Warning: Removed 12613 rows containing non-finite values (stat_density).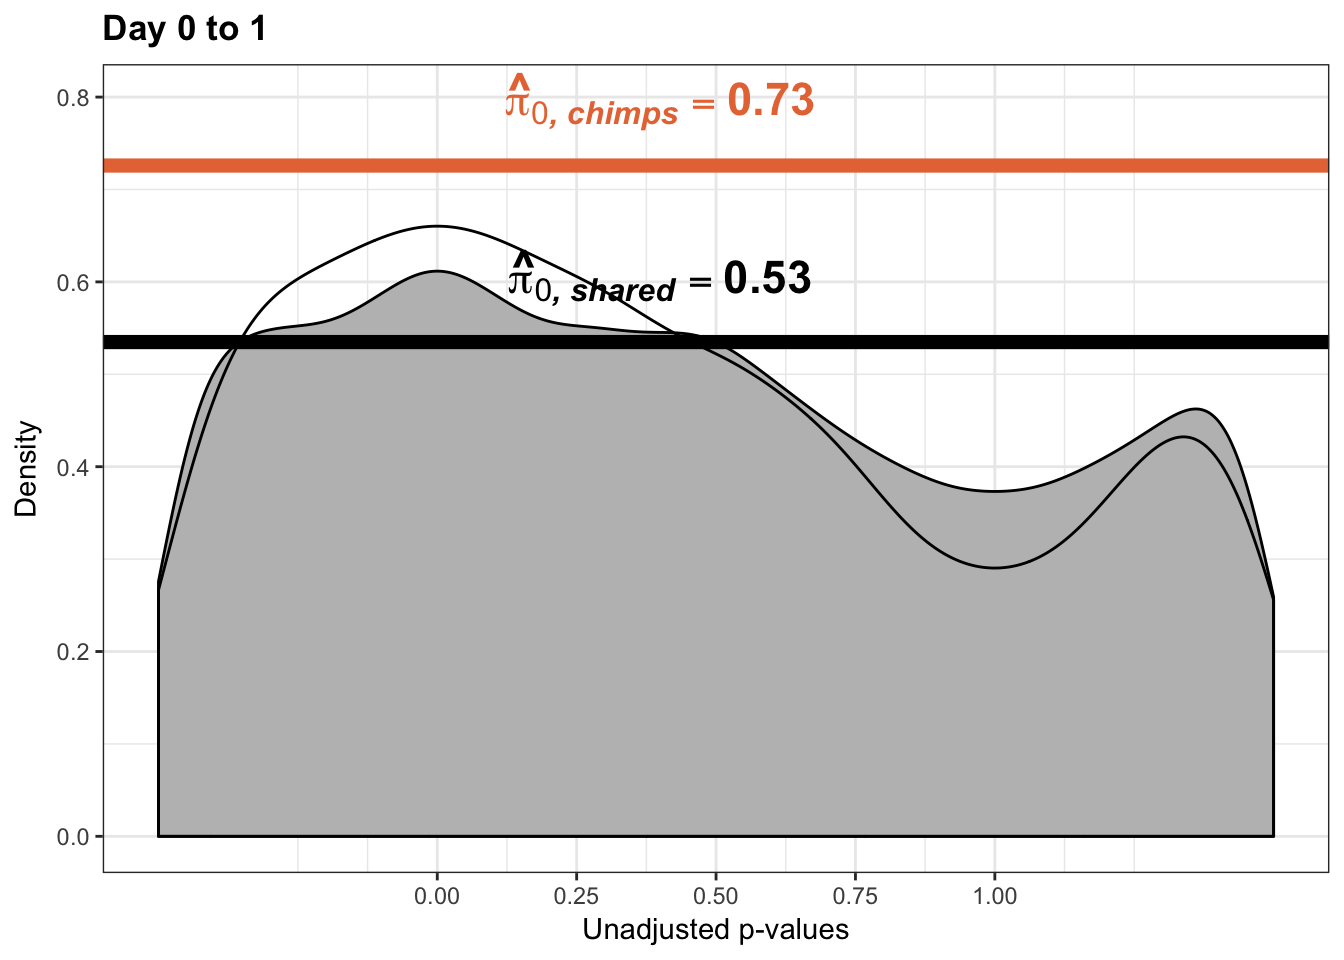
# Day 1 to 2
# Obtain pvalues
chimp_p_values_gen <- as.data.frame(qqplot_red_day12[1])
shared_p_values_gen <- as.data.frame(qqplot_red_day12[2])
# Pi_0 estimate for the chimps
pi0est_chimps <- qvalue(p=chimp_p_values_gen, pi0.method="smoother", fdr.level=NULL, robust=TRUE)$pi0
pi0est_chimps[1] 1# Pi_1 estimate for the chimps
pi1est_chimps <- 1 - pi0est_chimps
pi1est_chimps[1] 0# Pi_0 estimate for the chimps given significant in the humans
pi0est_chimps_given_humans <- qvalue(p=shared_p_values_gen, pi0.method="smoother", fdr.level=NULL, robust=TRUE)$pi0
pi0est_chimps_given_humans[1] 0.2469456# Pi_1 estimate for the humans
pi1est_chimps_given_humans <- 1 - pi0est_chimps_given_humans
pi1est_chimps_given_humans[1] 0.7530544# Let's overlap the two histograms
labels_c <- array("Chimpanzee", dim = c(10304,1))
labels_h <- array("Shared (Chimpanzee|Significant in Humans)", dim = c(as.data.frame(qqplot_red_day12[[3]][2]),1))
chimps <- cbind(labels_c, chimp_p_values_gen)
colnames(chimps) <- c("Species", "pval")
humans <- cbind(labels_h, shared_p_values_gen)
colnames(humans) <- c("Species", "pval")
# Combine the two
all_pval <- rbind(chimps[,1:2], humans[,1:2])
pal <- c("#00A4F4", "#E77642", "white")
p2_05 <- ggplot(all_pval, aes(pval, fill = Species)) + scale_fill_manual(values=pal[2:3]) +
geom_density(show.legend = F, alpha = 1) +
scale_x_continuous(limits = c(0,1), breaks = seq(0,1,0.25)) +
theme_bw() + labs(title = "Day 1 to 2") + theme(plot.title = element_text(face = "bold")) + labs(x = "Unadjusted p-values") + labs(y = "Density") +
geom_hline(yintercept = pi0est_chimps_given_humans, size = 2.5) + scale_y_continuous(labels=scaleFUN) +
geom_hline(yintercept = pi0est_chimps, size = 2.5, color = "#E77642") +
annotate("text", label= 'bold(bolditalic(hat(pi)[0][", chimps"])=="1")', parse=TRUE, x=0.5, y=(pi0est_chimps+0.07), colour = "#E77642", size = 6) + annotate("text", label = 'bold(bolditalic(hat(pi)[0][", shared"])=="0.25")', parse=TRUE, x=0.5, y=(pi0est_chimps_given_humans+0.07), size = 6)
p2_05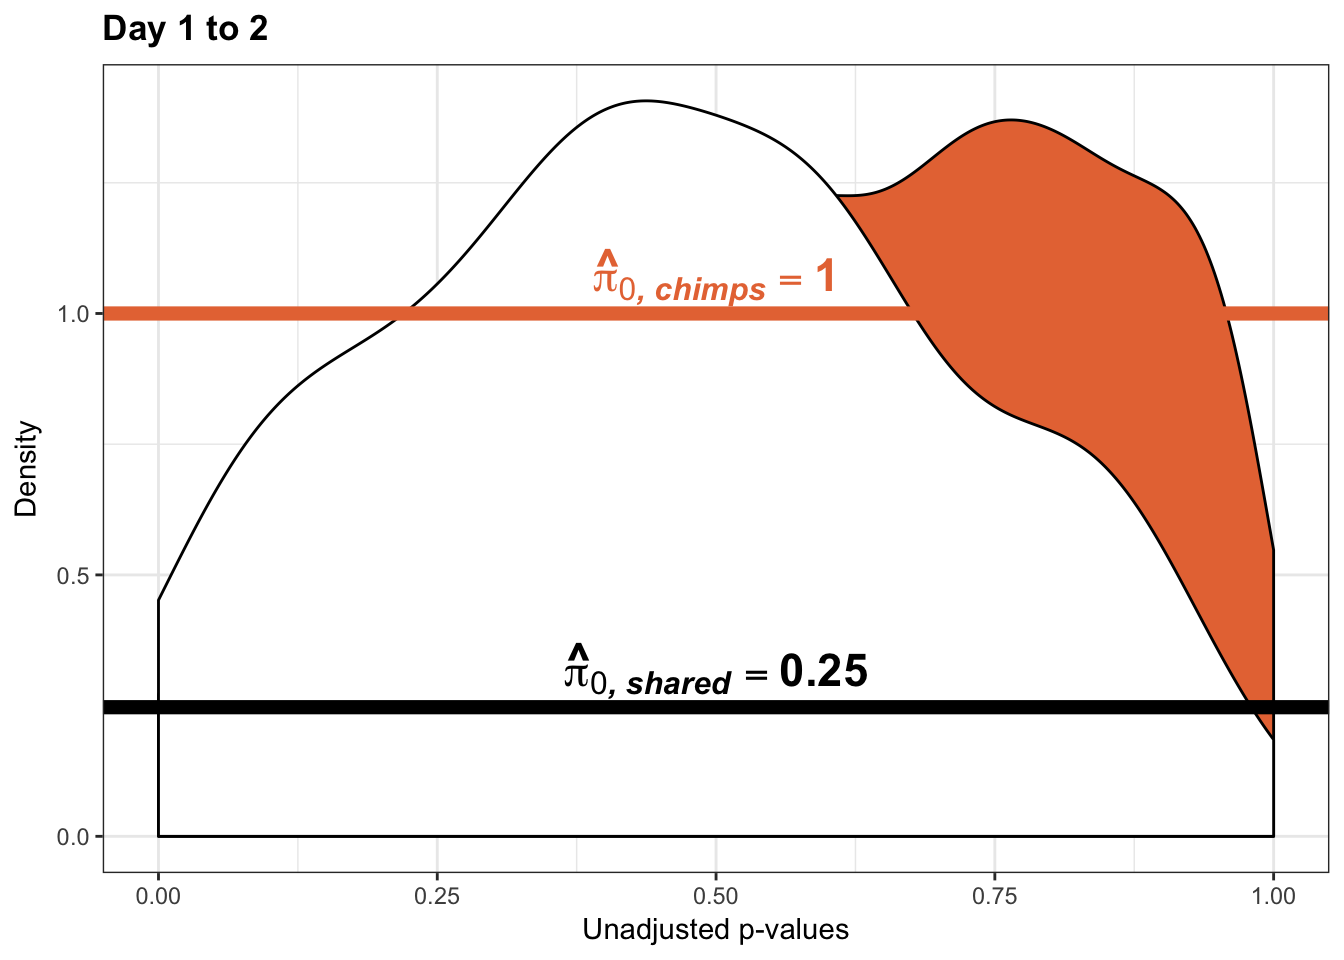
pval_c <- chimps[,1:2]
pval_h <- humans[,1:2]
pval_ch <- rbind(pval_c, pval_h)
resp <- rep(c("Day 1 to 2"), times = nrow(pval_c)+nrow(pval_h))
line <- rep(c("NA"), times = nrow(pval_c)+nrow(pval_h))
figS12A <- cbind(pval_ch, resp, line)
# Day 2 to 3
# Obtain pvalues
chimp_p_values_gen <- as.data.frame(qqplot_red_day23[1])
shared_p_values_gen <- as.data.frame(qqplot_red_day23[2])
# Pi_0 estimate for the chimps
pi0est_chimps <- qvalue(p=chimp_p_values_gen, pi0.method="smoother", fdr.level=NULL, robust=TRUE)$pi0
pi0est_chimps[1] 0.903342# Pi_1 estimate for the chimps
pi1est_chimps <- 1 - pi0est_chimps
pi1est_chimps[1] 0.09665802# Pi_0 estimate for the chimps given significant in the humans
pi0est_chimps_given_humans <- qvalue(p=shared_p_values_gen, pi0.method="smoother", fdr.level=NULL, robust=TRUE)$pi0
pi0est_chimps_given_humans[1] 1# Pi_1 estimate for the humans
pi1est_chimps_given_humans <- 1 - pi0est_chimps_given_humans
pi1est_chimps_given_humans[1] 0# Let's overlap the two histograms
labels_c <- array("Chimpanzee", dim = c(10304,1))
labels_h <- array("Shared (Chimpanzee|Significant in Humans)", dim = c(as.data.frame(qqplot_red_day23[[3]][2]),1))
chimps <- cbind(labels_c, chimp_p_values_gen)
colnames(chimps) <- c("Species", "pval")
humans <- cbind(labels_h, shared_p_values_gen)
colnames(humans) <- c("Species", "pval")
# Combine the two
all_pval <- rbind(chimps[,1:2], humans[,1:2])
pal <- c("#00A4F4", "#E77642", "white")
p3_05 <- ggplot(all_pval, aes(pval, fill = Species)) + scale_fill_manual(values=pal[2:3]) +
geom_density(show.legend = F, alpha = 1) +
scale_x_continuous(limits = c(0,1), breaks = seq(0,1,0.25)) +
theme_bw() + labs(title = "Day 2 to 3") + theme(plot.title = element_text(face = "bold")) + labs(x = "Unadjusted p-values") + labs(y = "Density") +
geom_hline(yintercept = pi0est_chimps_given_humans, size = 2.5) + scale_y_continuous(labels=scaleFUN) +
geom_hline(yintercept = pi0est_chimps, size = 2.5, color = "#E77642") +
annotate("text", label= 'bold(bolditalic(hat(pi)[0][", chimps"])=="0.9")', parse=TRUE, x=0.8, y=(pi0est_chimps-0.07), colour = "#E77642", size = 6) + annotate("text", label = 'bold(bolditalic(hat(pi)[0][", shared"])=="1")', parse=TRUE, x=0.8, y=(pi0est_chimps_given_humans+0.07), size = 6)
p3_05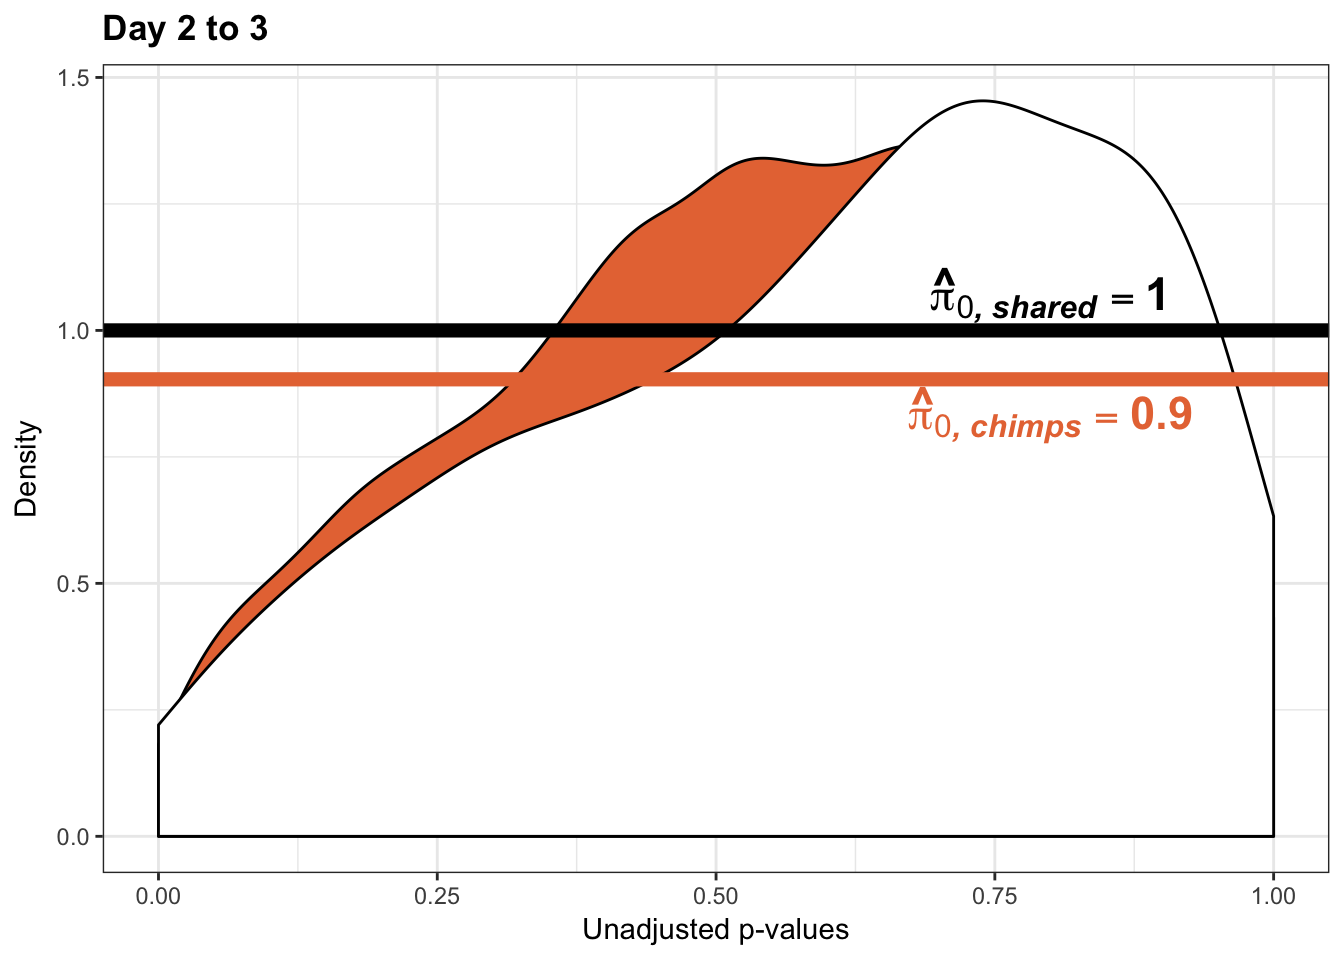
pval_c <- chimps[,1:2]
pval_h <- humans[,1:2]
pval_ch <- rbind(pval_c, pval_h)
resp <- rep(c("Day 2 to 3"), times = nrow(pval_c)+nrow(pval_h))
line <- rep(c("NA"), times = nrow(pval_c)+nrow(pval_h))
figS12A_fig <- cbind(pval_ch, resp, line)
figS12A <- rbind(figS12A, figS12A_fig)
# Day 1 to 3
# Obtain pvalues
chimp_p_values_gen <- as.data.frame(qqplot_red_day13[1])
shared_p_values_gen <- as.data.frame(qqplot_red_day13[2])
# Pi_0 estimate for the chimps
pi0est_chimps <- qvalue(p=chimp_p_values_gen, pi0.method="smoother", fdr.level=NULL, robust=TRUE)$pi0
pi0est_chimps[1] 1# Pi_1 estimate for the chimps
pi1est_chimps <- 1 - pi0est_chimps
pi1est_chimps[1] 0# Pi_0 estimate for the chimps given significant in the humans
pi0est_chimps_given_humans <- qvalue(p=shared_p_values_gen, pi0.method="smoother", fdr.level=NULL, robust=TRUE)$pi0
pi0est_chimps_given_humans[1] 1# Pi_1 estimate for the humans
pi1est_chimps_given_humans <- 1 - pi0est_chimps_given_humans
pi1est_chimps_given_humans[1] 0# Let's overlap the two histograms
labels_c <- array("Chimpanzee", dim = c(10304,1))
labels_h <- array("Shared (Chimpanzee|Significant in Humans)", dim = c(as.data.frame(qqplot_red_day13[[3]][2]),1))
chimps <- cbind(labels_c, chimp_p_values_gen)
colnames(chimps) <- c("Species", "pval")
humans <- cbind(labels_h, shared_p_values_gen)
colnames(humans) <- c("Species", "pval")
# Combine the two
all_pval <- rbind(chimps[,1:2], humans[,1:2])
pal <- c("#00A4F4", "#E77642", "white")
p4_05 <- ggplot(all_pval, aes(pval, fill = Species)) + scale_fill_manual(values=pal[2:3]) +
geom_density(show.legend = F, alpha = 1) +
scale_x_continuous(limits = c(0,1), breaks = seq(0,1,0.25)) +
theme_bw() + labs(title = "Day 1 to 3") + theme(plot.title = element_text(face = "bold")) + labs(x = "Unadjusted p-values") + labs(y = "Density") + scale_y_continuous(labels=scaleFUN) +
geom_hline(yintercept = pi0est_chimps_given_humans, size = 2.5) +
geom_hline(yintercept = pi0est_chimps, size = 2.5, color = "black") +
annotate("text", label= 'bold(bolditalic(hat(pi)[0][", chimps"])=="1")', parse=TRUE, x=0.2, y=(pi0est_chimps+0.2), colour = "#E77642", size = 6) + annotate("text", label = 'bold(bolditalic(hat(pi)[0][", shared"])=="1")', parse=TRUE, x=0.2, y=(pi0est_chimps_given_humans+0.07), size = 6)
p4_05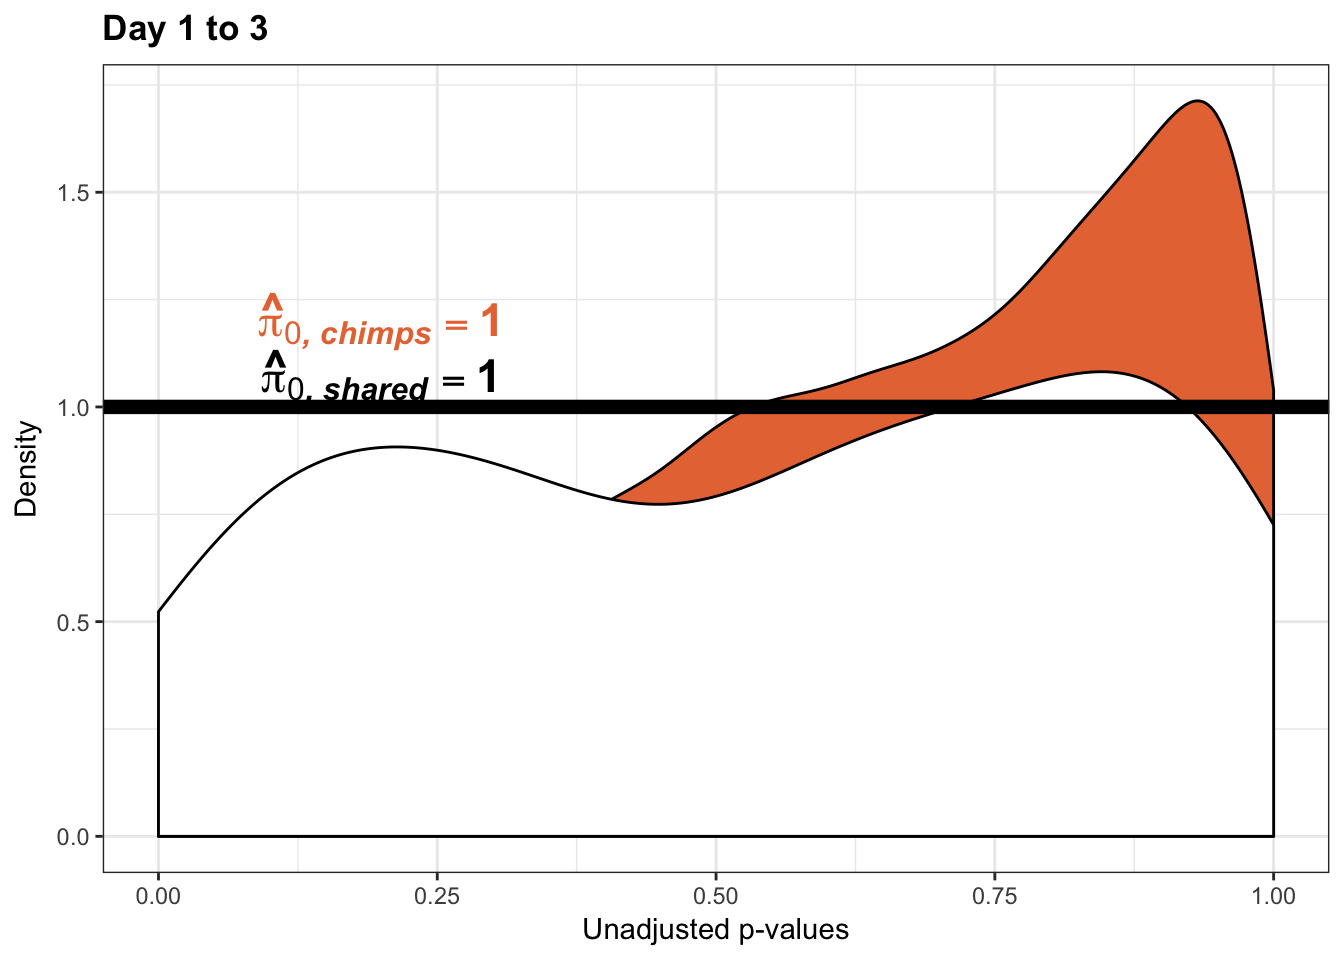
pval_c <- chimps[,1:2]
pval_h <- humans[,1:2]
pval_ch <- rbind(pval_c, pval_h)
resp <- rep(c("Day 1 to 3"), times = nrow(pval_c)+nrow(pval_h))
line <- rep(c("NA"), times = nrow(pval_c)+nrow(pval_h))
figS12A_fig <- cbind(pval_ch, resp, line)
figS12A <- rbind(figS12A, figS12A_fig)
write.csv(figS12A, "/Users/laurenblake/Dropbox/Endoderm TC/Draft versions/Resubmit1_Genome Biology/Supplemental/Data_figS13A.csv", quote = FALSE, row.names = FALSE)Estimates of pi0 and pi1 for increase of variation in chimps conditioned on significance in humans (p = 0.05)
############### Increase in Variation ############
# Day 0 to 1
# Obtain pvalues
chimp_p_values_gen <- as.data.frame(qqplot_inc_day01[1])
shared_p_values_gen <- as.data.frame(qqplot_inc_day01[2])
# Pi_0 estimate for the chimps
pi0est_chimps <- qvalue(p=chimp_p_values_gen, pi0.method="smoother", fdr.level=NULL, robust=TRUE)$pi0
pi0est_chimps[1] 1# Pi_1 estimate for the chimps
pi1est_chimps <- 1 - pi0est_chimps
pi1est_chimps[1] 0# Pi_0 estimate for the chimps given significant in the humans
pi0est_chimps_given_humans <- qvalue(p=shared_p_values_gen, pi0.method="smoother", fdr.level=NULL, robust=TRUE)$pi0
pi0est_chimps_given_humans[1] 1# Pi_1 estimate for the humans
pi1est_chimps_given_humans <- 1 - pi0est_chimps_given_humans
pi1est_chimps_given_humans[1] 0# Let's overlap the two histograms
labels_c <- array("Chimpanzee", dim = c(10304,1))
labels_h <- array("Shared (Chimpanzee|Significant in Humans)", dim = c(as.data.frame(qqplot_inc_day01[[3]][2]),1))
chimps <- cbind(labels_c, chimp_p_values_gen)
colnames(chimps) <- c("Species", "pval")
humans <- cbind(labels_h, shared_p_values_gen)
colnames(humans) <- c("Species", "pval")
# Combine the two
all_pval <- rbind(chimps[,1:2], humans[,1:2])
pal <- c("#00A4F4", "#E77642", "white")
p1_inc_05 <- ggplot(all_pval, aes(pval, fill = Species)) + scale_fill_manual(values=pal[2:3]) +
geom_density(show.legend = F, alpha = 1) +
scale_x_continuous(limits = c(0,1), breaks = seq(0,1,0.25)) +
theme_bw() + labs(title = "Day 0 to 1") + theme(plot.title = element_text(face = "bold")) + labs(x = "Unadjusted p-values") + labs(y = "Density") + scale_y_continuous(labels=scaleFUN) +
geom_hline(yintercept = pi0est_chimps_given_humans, size = 2.5) +
geom_hline(yintercept = pi0est_chimps, size = 2.5, color = "#E77642") +
annotate("text", label= 'bold(bolditalic(hat(pi)[0][", chimps"])=="1")', parse=TRUE, x=0.2, y=(pi0est_chimps+0.3), colour = "#E77642", size = 6) + annotate("text", label = 'bold(bolditalic(hat(pi)[0][", shared"])=="1")', parse=TRUE, x=0.2, y=(pi0est_chimps_given_humans+0.15), size = 6)
p1_inc_05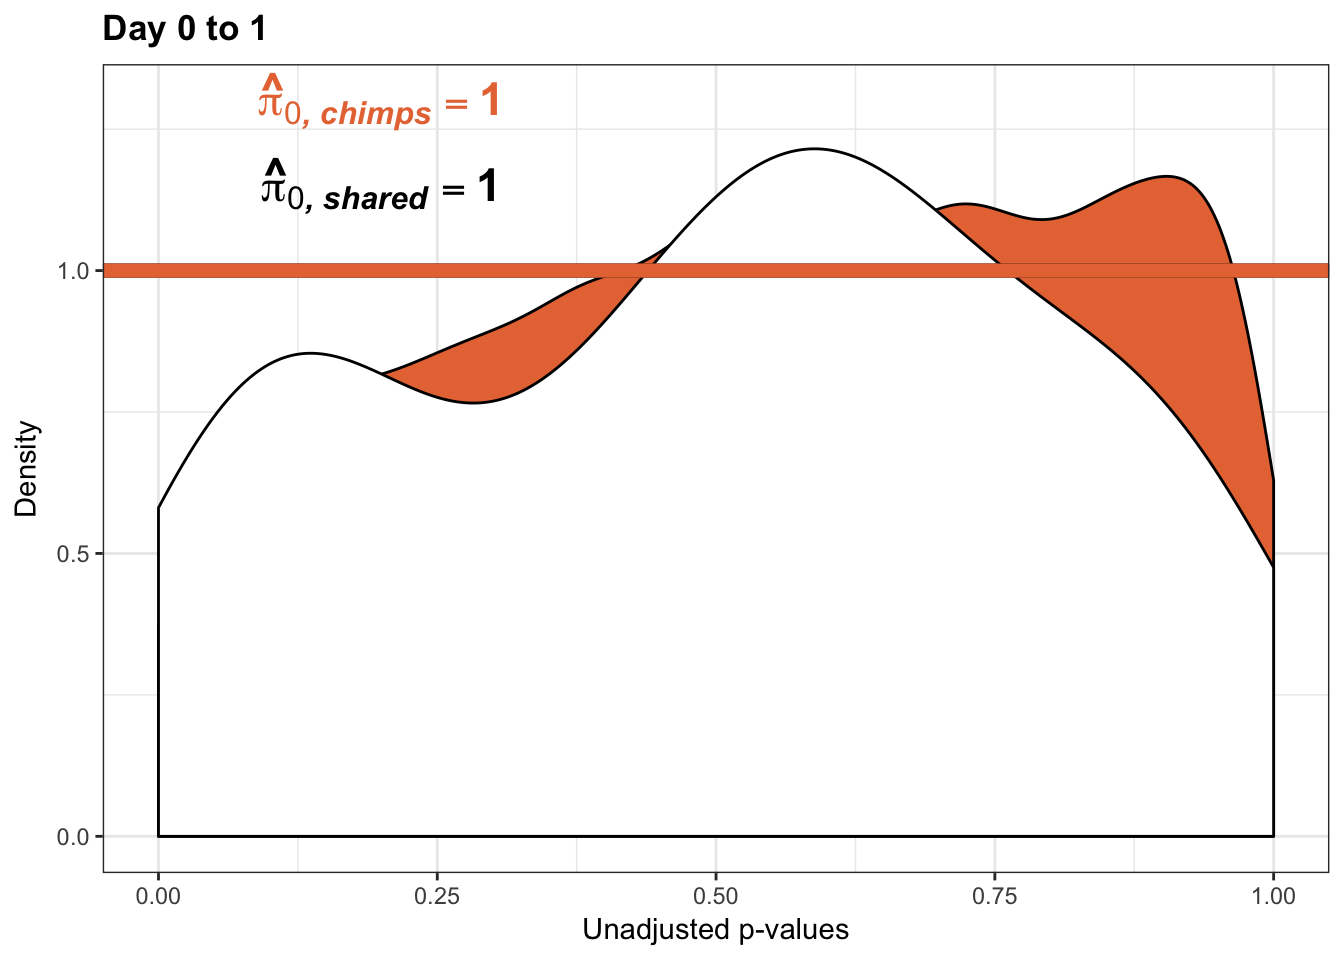
pval_c <- chimps[,1:2]
pval_h <- humans[,1:2]
pval_ch <- rbind(pval_c, pval_h)
resp <- rep(c("Day 0 to 1"), times = nrow(pval_c)+nrow(pval_h))
line <- rep(c("NA"), times = nrow(pval_c)+nrow(pval_h))
figS12A <- cbind(pval_ch, resp, line)
# Day 1 to 2
# Obtain pvalues
chimp_p_values_gen <- as.data.frame(qqplot_inc_day12[1])
shared_p_values_gen <- as.data.frame(qqplot_inc_day12[2])
# Pi_0 estimate for the chimps
pi0est_chimps <- qvalue(p=chimp_p_values_gen, pi0.method="smoother", fdr.level=NULL, robust=TRUE)$pi0
pi0est_chimps[1] 0.5221613# Pi_1 estimate for the chimps
pi1est_chimps <- 1 - pi0est_chimps
pi1est_chimps[1] 0.4778387# Pi_0 estimate for the chimps given significant in the humans
pi0est_chimps_given_humans <- qvalue(p=shared_p_values_gen, pi0.method="smoother", fdr.level=NULL, robust=TRUE)$pi0
pi0est_chimps_given_humans[1] 0.3388645# Pi_1 estimate for the humans
pi1est_chimps_given_humans <- 1 - pi0est_chimps_given_humans
pi1est_chimps_given_humans[1] 0.6611355# Let's overlap the two histograms
labels_c <- array("Chimpanzee", dim = c(10304,1))
labels_h <- array("Shared (Chimpanzee|Significant in Humans)", dim = c(as.data.frame(qqplot_inc_day12[[3]][2]),1))
chimps <- cbind(labels_c, chimp_p_values_gen)
colnames(chimps) <- c("Species", "pval")
humans <- cbind(labels_h, shared_p_values_gen)
colnames(humans) <- c("Species", "pval")
# Combine the two
all_pval <- rbind(chimps[,1:2], humans[,1:2])
pal <- c("#00A4F4", "#E77642", "white")
p2_inc_05 <- ggplot(all_pval, aes(pval, fill = Species)) + scale_fill_manual(values=pal[2:3]) +
geom_density(show.legend = F, alpha = 1) +
scale_x_continuous(limits = c(0,1), breaks = seq(0,1,0.25)) +
theme_bw() + labs(title = "Day 1 to 2") + theme(plot.title = element_text(face = "bold")) + labs(x = "Unadjusted p-values") + labs(y = "Density") + scale_y_continuous(labels=scaleFUN) +
geom_hline(yintercept = pi0est_chimps_given_humans, size = 2.5) +
geom_hline(yintercept = pi0est_chimps, size = 2.5, color = "#E77642") +
annotate("text", label= 'bold(bolditalic(hat(pi)[0][", chimps"])=="0.52")', parse=TRUE, x=0.2, y=(pi0est_chimps+0.07), colour = "#E77642", size = 6) + annotate("text", label = 'bold(bolditalic(hat(pi)[0][", shared"])=="0.34")', parse=TRUE, x=0.2, y=(pi0est_chimps_given_humans+0.07), size = 6)
p2_inc_05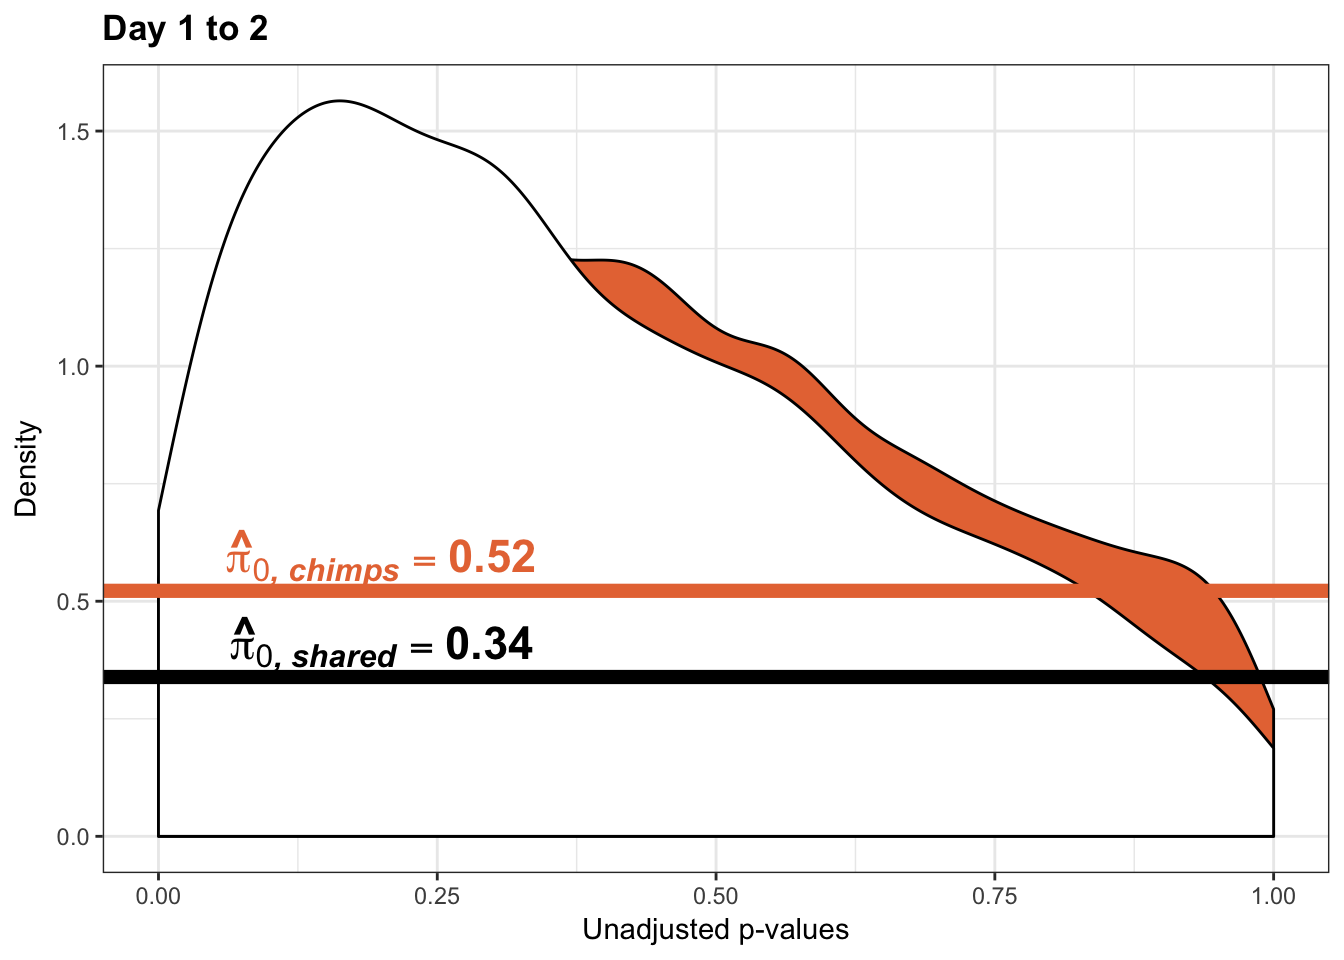
# Day 2 to 3
# Obtain pvalues
chimp_p_values_gen <- as.data.frame(qqplot_inc_day23[1])
shared_p_values_gen <- as.data.frame(qqplot_inc_day23[2])
# Pi_0 estimate for the chimps
pi0est_chimps <- qvalue(p=chimp_p_values_gen, pi0.method="smoother", fdr.level=NULL, robust=TRUE)$pi0
pi0est_chimps[1] 0.3652978# Pi_1 estimate for the chimps
pi1est_chimps <- 1 - pi0est_chimps
pi1est_chimps[1] 0.6347022# Pi_0 estimate for the chimps given significant in the humans
pi0est_chimps_given_humans <- qvalue(p=shared_p_values_gen, pi0.method="smoother", fdr.level=NULL, robust=TRUE)$pi0
pi0est_chimps_given_humans[1] 0.2443566# Pi_1 estimate for the humans
pi1est_chimps_given_humans <- 1 - pi0est_chimps_given_humans
pi1est_chimps_given_humans[1] 0.7556434# Let's overlap the two histograms
labels_c <- array("Chimpanzee", dim = c(10304,1))
labels_h <- array("Shared (Chimpanzee|Significant in Humans)", dim = c(as.data.frame(qqplot_inc_day23[[3]][2]),1))
chimps <- cbind(labels_c, chimp_p_values_gen)
colnames(chimps) <- c("Species", "pval")
humans <- cbind(labels_h, shared_p_values_gen)
colnames(humans) <- c("Species", "pval")
# Combine the two
all_pval <- rbind(chimps[,1:2], humans[,1:2])
pal <- c("#00A4F4", "#E77642", "white")
p3_inc_05 <- ggplot(all_pval, aes(pval, fill = Species)) + scale_fill_manual(values=pal[2:3]) +
geom_density(show.legend = F, alpha = 1) + scale_y_continuous(labels=scaleFUN) +
scale_x_continuous(limits = c(0,1), breaks = seq(0,1,0.25)) +
theme_bw() + labs(title = "Day 2 to 3") + theme(plot.title = element_text(face = "bold")) + labs(x = "Unadjusted p-values") + labs(y = "Density") +
geom_hline(yintercept = pi0est_chimps_given_humans, size = 2.5) +
geom_hline(yintercept = pi0est_chimps, size = 2.5, color = "#E77642") +
annotate("text", label= 'bold(bolditalic(hat(pi)[0][", chimps"])=="0.37")', parse=TRUE, x=0.2, y=(pi0est_chimps+0.07), colour = "#E77642", size = 6) + annotate("text", label = 'bold(bolditalic(hat(pi)[0][", shared"])=="0.24")', parse=TRUE, x=0.2, y=(pi0est_chimps_given_humans+0.06), size = 6)
p3_inc_05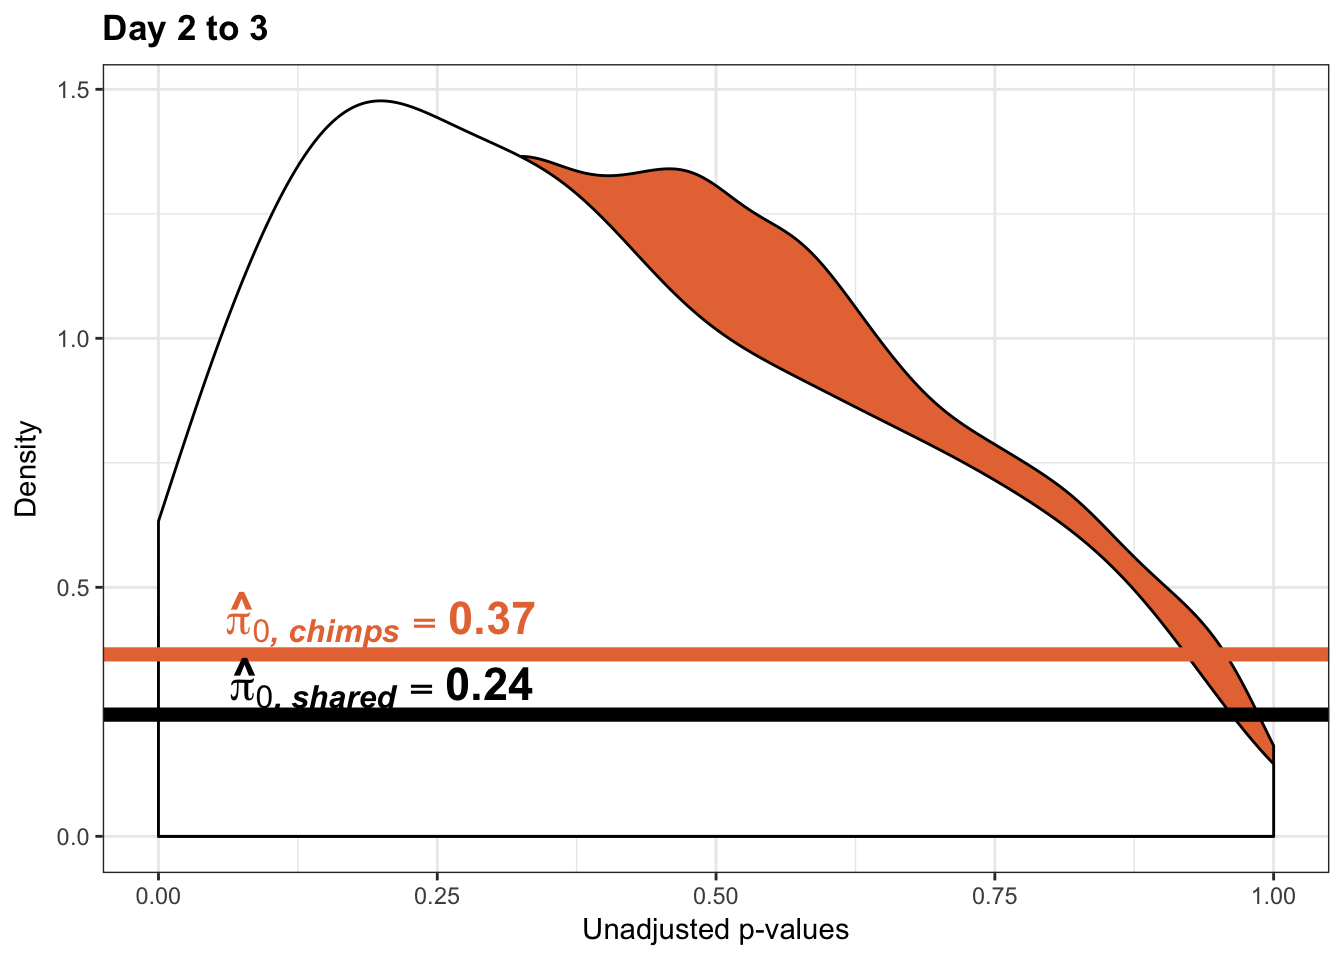
pval_c <- chimps[,1:2]
pval_h <- humans[,1:2]
pval_ch <- rbind(pval_c, pval_h)
resp <- rep(c("Day 2 to 3"), times = nrow(pval_c)+nrow(pval_h))
line1 <- as.data.frame(rep(c("0.37"), times = nrow(pval_c)))
colnames(line1) <- c("line")
line2 <- as.data.frame(rep(c("0.24"), times = nrow(pval_h)))
colnames(line2) <- c("line")
line <- rbind(line1, line2)
figS12A_fig <- cbind(pval_ch, resp, line)
figS12A <- rbind(figS12A, figS12A_fig)
write.csv(figS12A, "/Users/laurenblake/Dropbox/Endoderm TC/Draft versions/Resubmit1_Genome Biology/Supplemental/Data_figS13C.csv", quote = FALSE, row.names = FALSE)
# Day 1 to 3
# Obtain pvalues
chimp_p_values_gen <- as.data.frame(qqplot_inc_day13[1])
shared_p_values_gen <- as.data.frame(qqplot_inc_day13[2])
# Pi_0 estimate for the chimps
pi0est_chimps <- qvalue(p=chimp_p_values_gen, pi0.method="smoother", fdr.level=NULL, robust=TRUE)$pi0
pi0est_chimps[1] 0.5071291# Pi_1 estimate for the chimps
pi1est_chimps <- 1 - pi0est_chimps
pi1est_chimps[1] 0.4928709# Pi_0 estimate for the chimps given significant in the humans
pi0est_chimps_given_humans <- qvalue(p=shared_p_values_gen, pi0.method="smoother", fdr.level=NULL, robust=TRUE)$pi0
pi0est_chimps_given_humans[1] 0.3889643# Pi_1 estimate for the humans
pi1est_chimps_given_humans <- 1 - pi0est_chimps_given_humans
pi1est_chimps_given_humans[1] 0.6110357# Let's overlap the two histograms
labels_c <- array("Chimpanzee", dim = c(10304,1))
labels_h <- array("Shared (Chimpanzee|Significant in Humans)", dim = c(as.data.frame(qqplot_inc_day13[[3]][2]),1))
chimps <- cbind(labels_c, chimp_p_values_gen)
colnames(chimps) <- c("Species", "pval")
humans <- cbind(labels_h, shared_p_values_gen)
colnames(humans) <- c("Species", "pval")
# Combine the two
all_pval <- rbind(chimps[,1:2], humans[,1:2])
pal <- c("#00A4F4", "#E77642", "white")
p4_inc_05 <- ggplot(all_pval, aes(pval, fill = Species)) + scale_fill_manual(values=pal[2:3]) +
geom_density(show.legend = F, alpha = 1) +
scale_x_continuous(limits = c(0,1), breaks = seq(0,1,0.25)) + scale_y_continuous(labels=scaleFUN) +
theme_bw() + labs(title = "Day 1 to 3") + theme(plot.title = element_text(face = "bold")) + labs(x = "Unadjusted p-values") + labs(y = "Density") +
geom_hline(yintercept = pi0est_chimps_given_humans, size = 2.5) +
geom_hline(yintercept = pi0est_chimps, size = 2.5, color = "#E77642") +
annotate("text", label= 'bold(bolditalic(hat(pi)[0][", chimps"])=="0.51")', parse=TRUE, x=0.2, y=(pi0est_chimps+0.08), colour = "#E77642", size = 6) + annotate("text", label = 'bold(bolditalic(hat(pi)[0][", shared"])=="0.39")', parse=TRUE, x=0.2, y=(pi0est_chimps_given_humans-0.08), size = 6)
p4_inc_05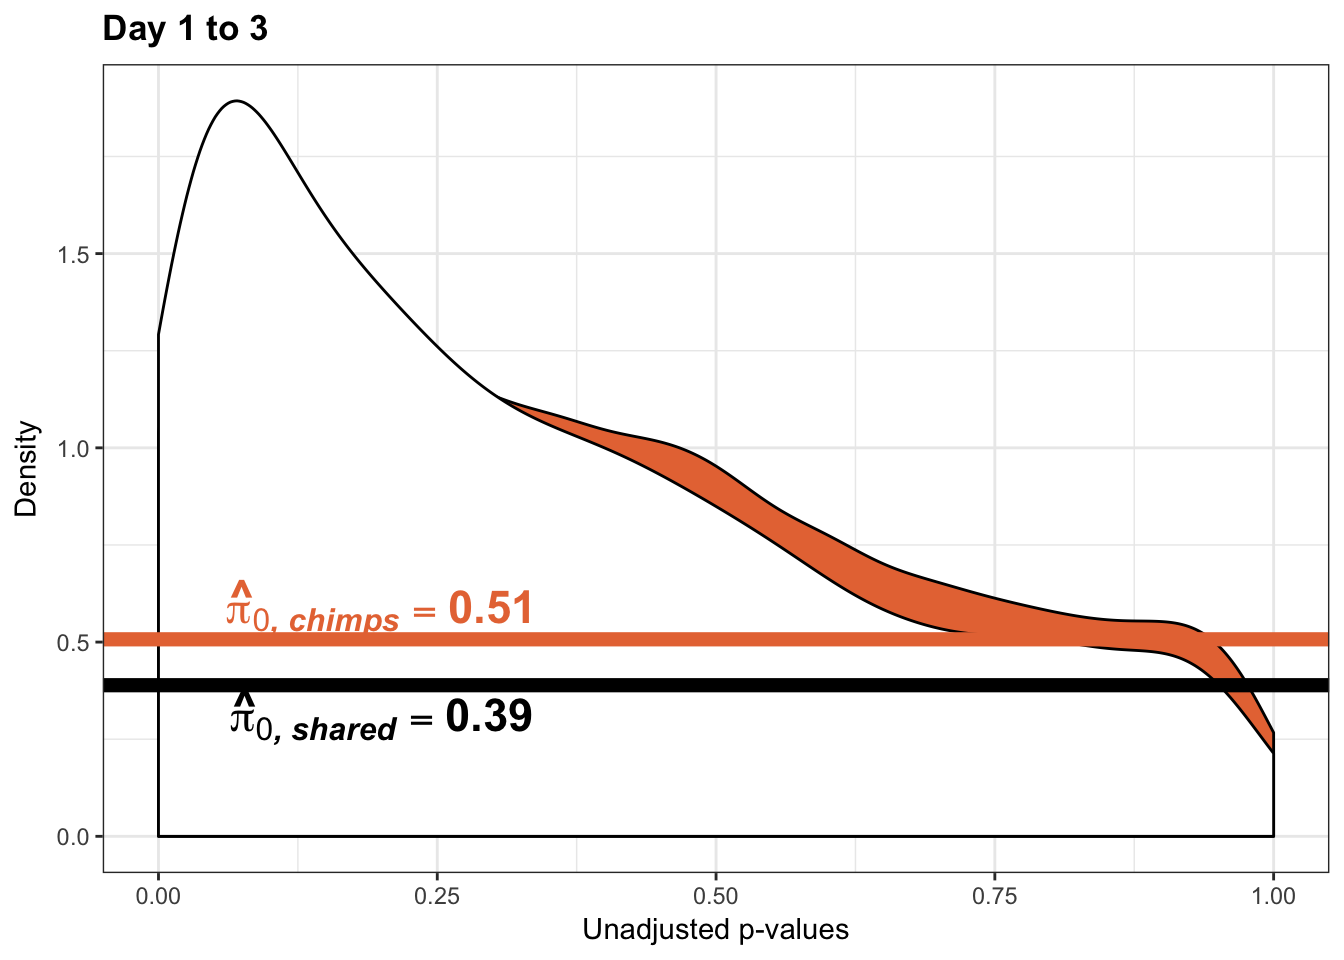
pval_c <- chimps[,1:2]
pval_h <- humans[,1:2]
pval_ch <- rbind(pval_c, pval_h)
resp <- rep(c("Days 1 to 3"), times = nrow(pval_c)+nrow(pval_h))
line1 <- as.data.frame(rep(c("0.51"), times = nrow(pval_c)))
colnames(line1) <- c("line")
line2 <- as.data.frame(rep(c("0.39"), times = nrow(pval_h)))
colnames(line2) <- c("line")
line <- rbind(line1, line2)
figS12A_fig <- cbind(pval_ch, resp, line)
figS12A <- rbind(figS12A, figS12A_fig)Changes of variation in humans
# Reduction in variance from day 0 to day 1 humans
qqplot_red_day01 <- find_qqplot_red_humans(7,10,17,20,1,6,11,16, 0.05)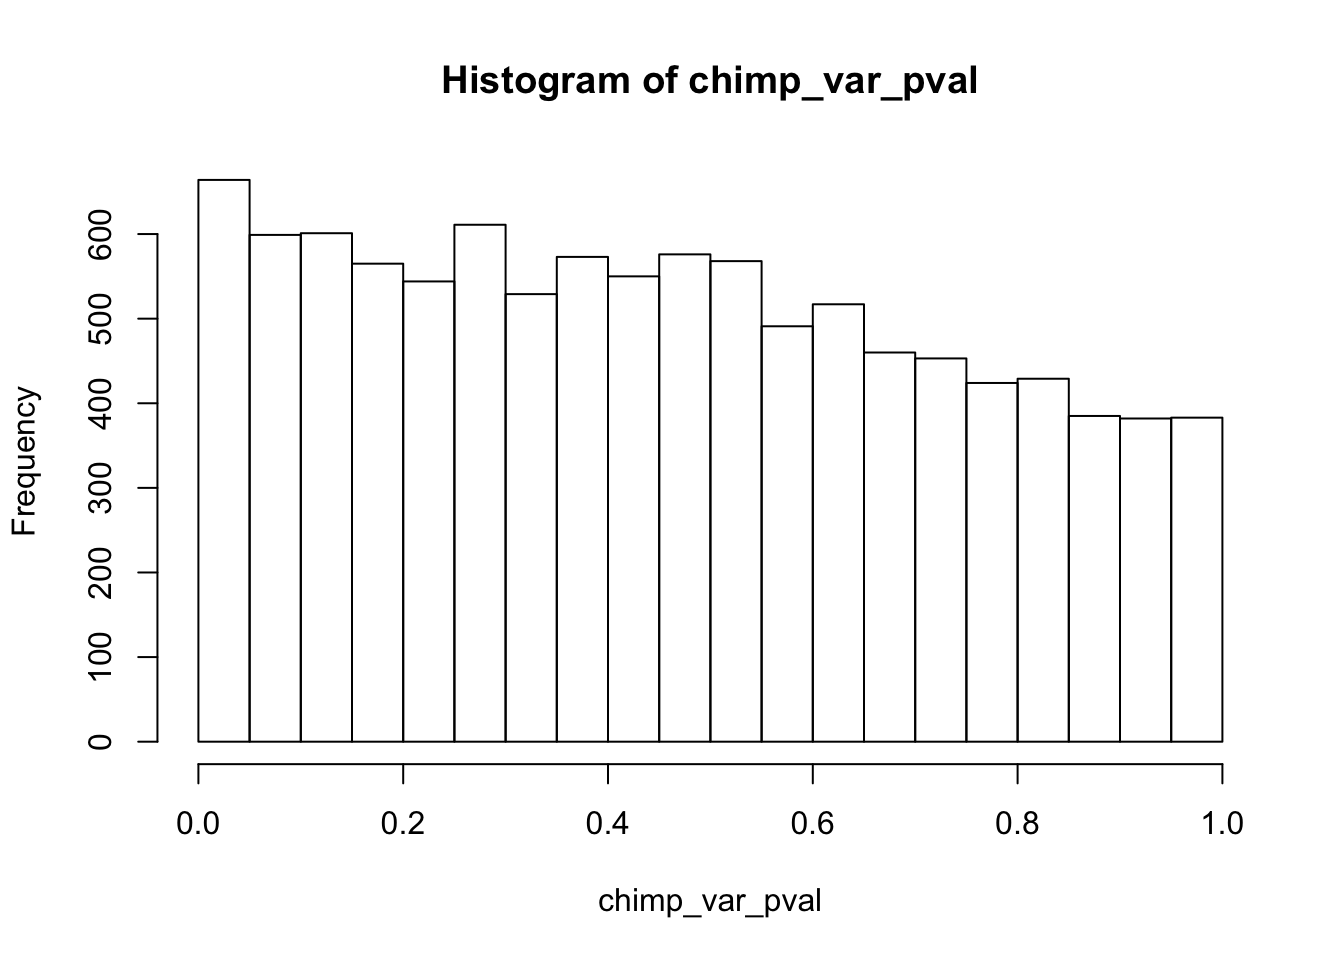

# Reduction in variance from day 1 to day 2 humans
qqplot_red_day12 <- find_qqplot_red_humans(17,20,27,30,11,16,21,26,0.05)
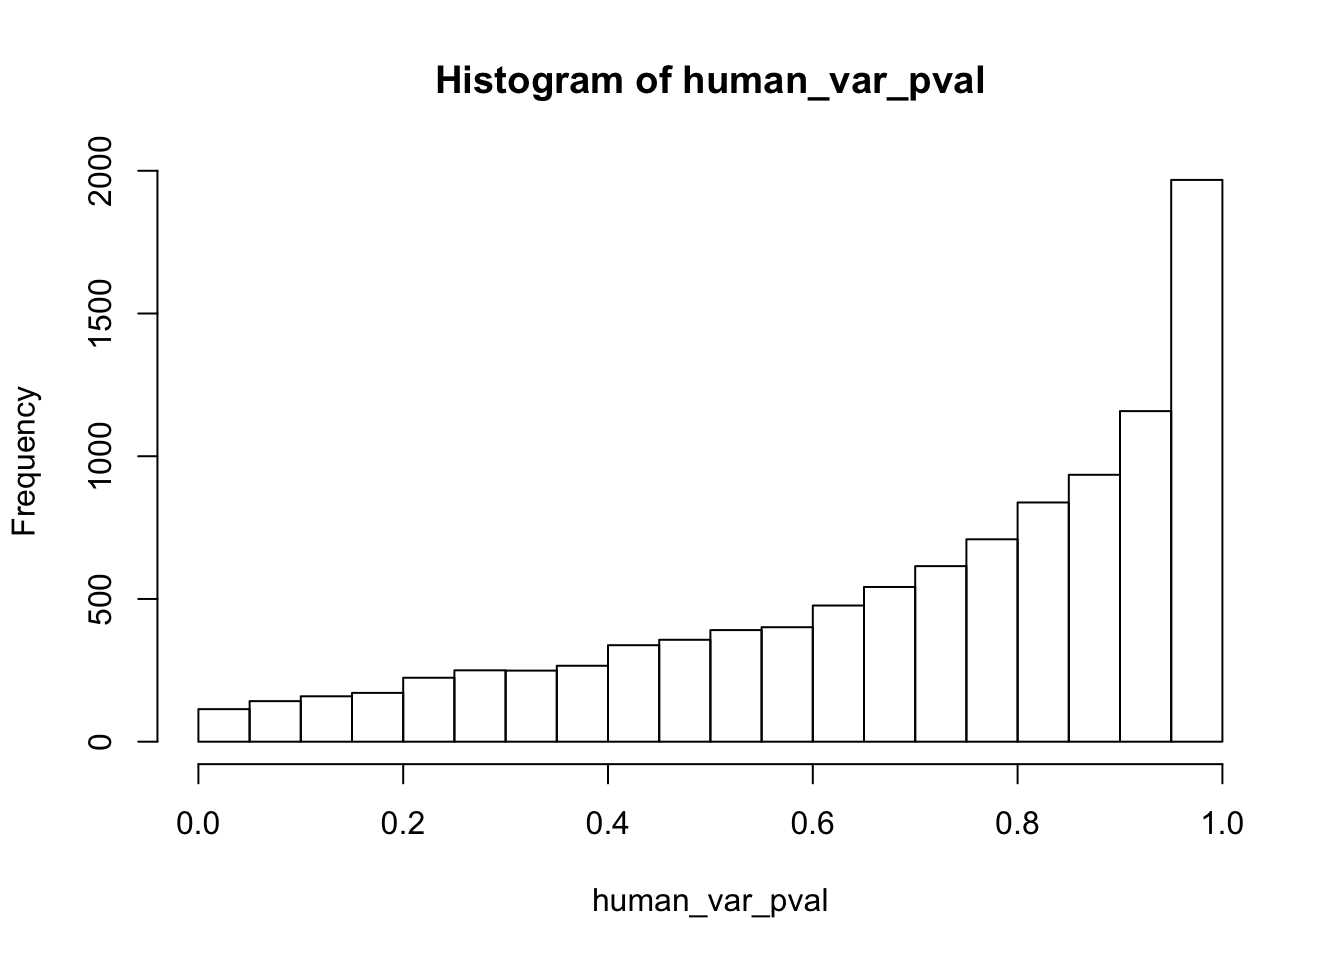
# Reduction in variance from day 2 to day 3 humans
qqplot_red_day23 <- find_qqplot_red_humans(27,30,37,40,21,26,31,36,0.05)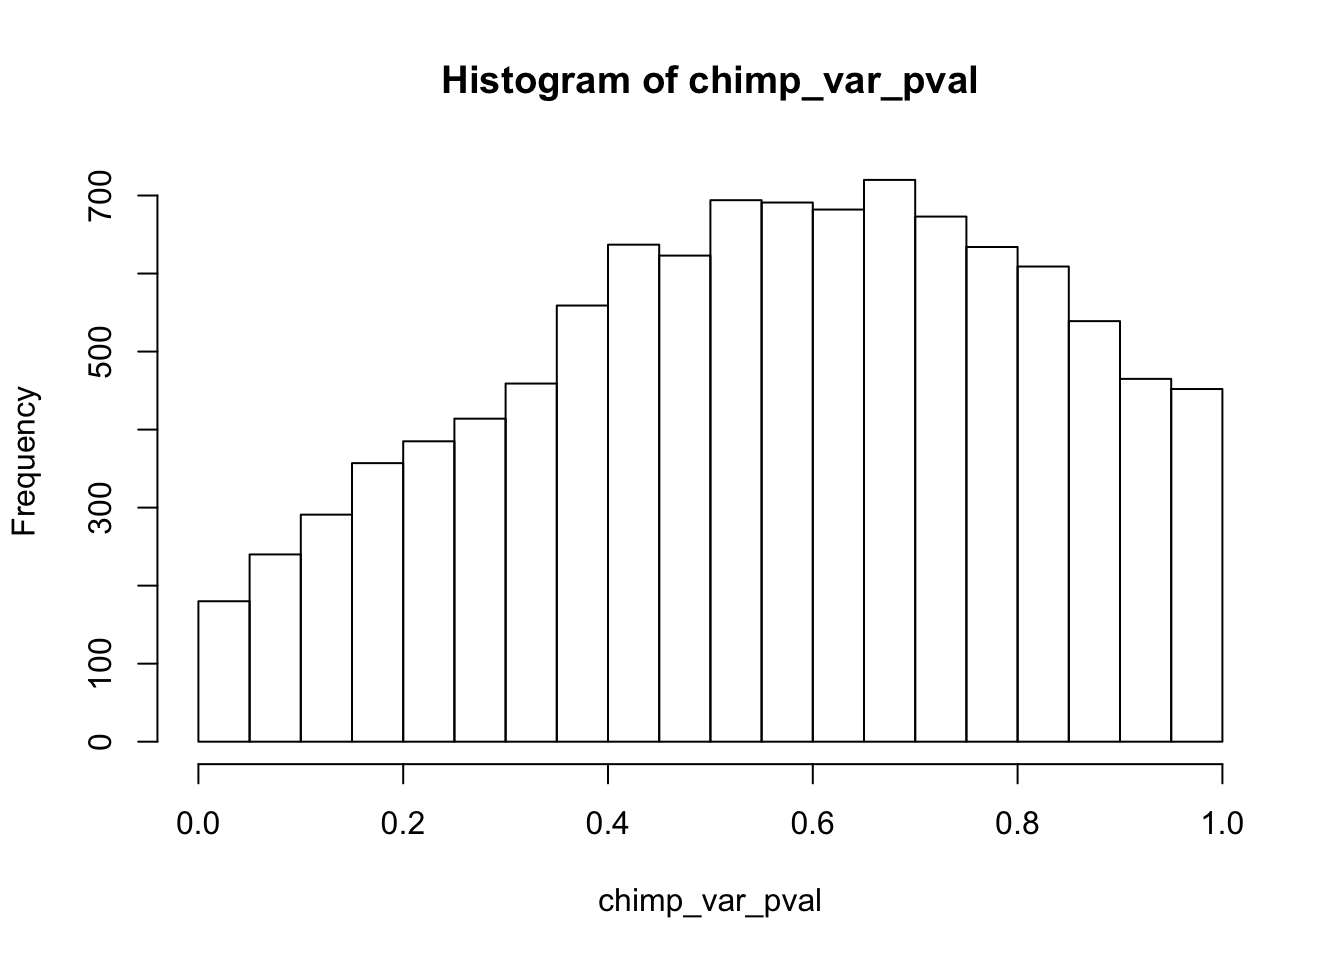

# Reduction in variance from day 1 to day 3 humans
qqplot_red_day13 <- find_qqplot_red_humans(17,20,37,40,11,16,31,36,0.05)
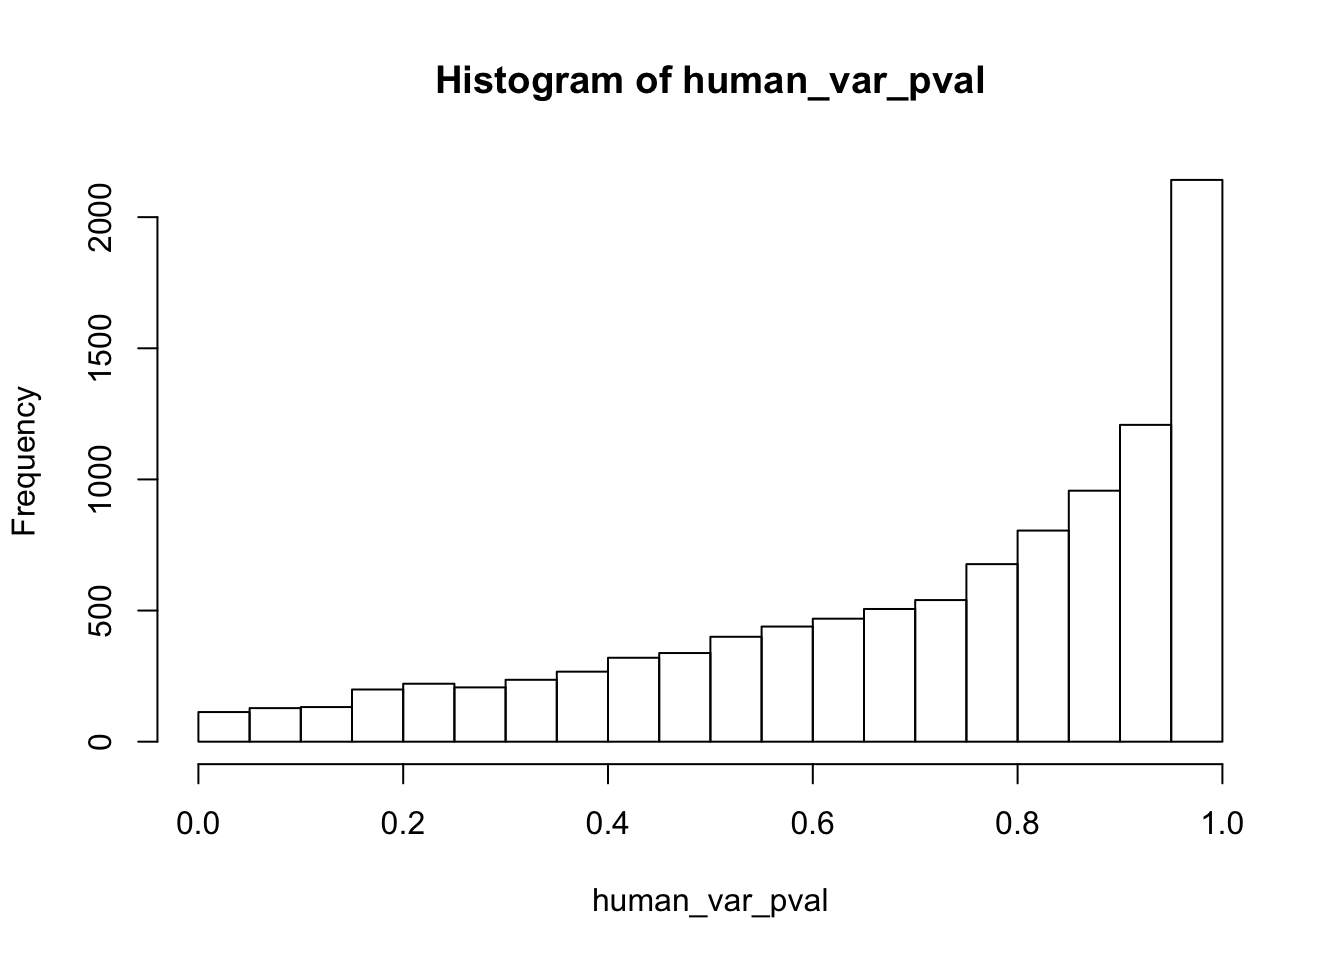
# Reduction in variance from day 0 to day 2 humans
qqplot_red_day02 <- find_qqplot_red_humans(7,10,27,30,1,6,21,26,0.05)

# Inc. in variance from day 0 to day 1 humans
qqplot_inc_day01 <- find_qqplot_inc_humans(7,10,17,20,1,6,11,16,0.05)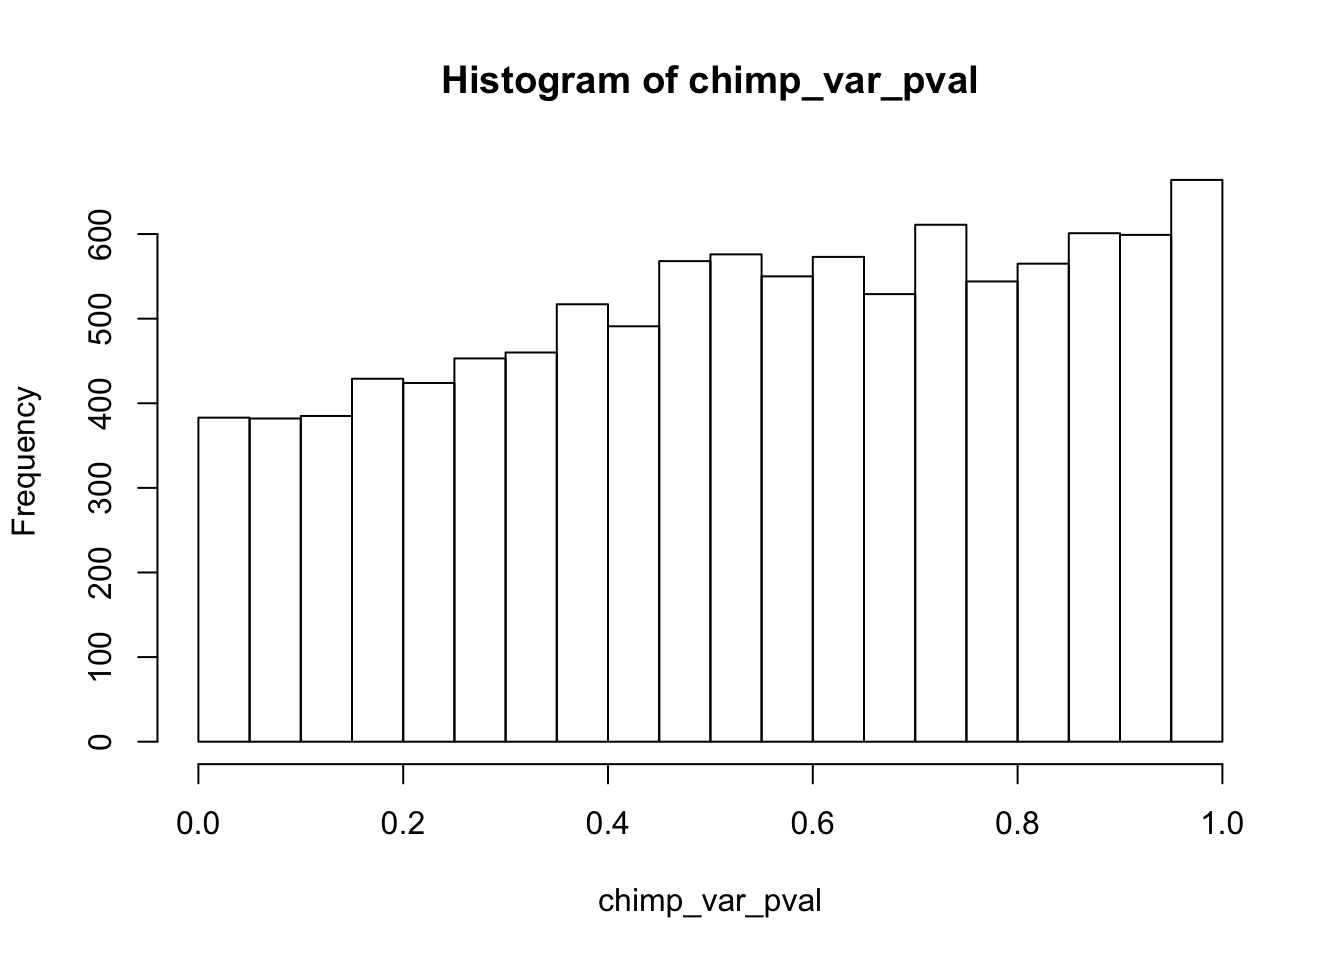

# Inc. in variance from day 1 to day 2 humans
qqplot_inc_day12 <- find_qqplot_inc_humans(17,20,27,30,11,16,21,26,0.05)

# Inc. in variance from day 2 to day 3 humans
qqplot_inc_day23 <- find_qqplot_inc_humans(27,30,37,40,21,26,31,36,0.05)

# Inc. in variance from day 0 to day 2
qqplot_inc_day02 <- find_qqplot_inc_humans(7,10,27,30,1,6,21,26,0.05)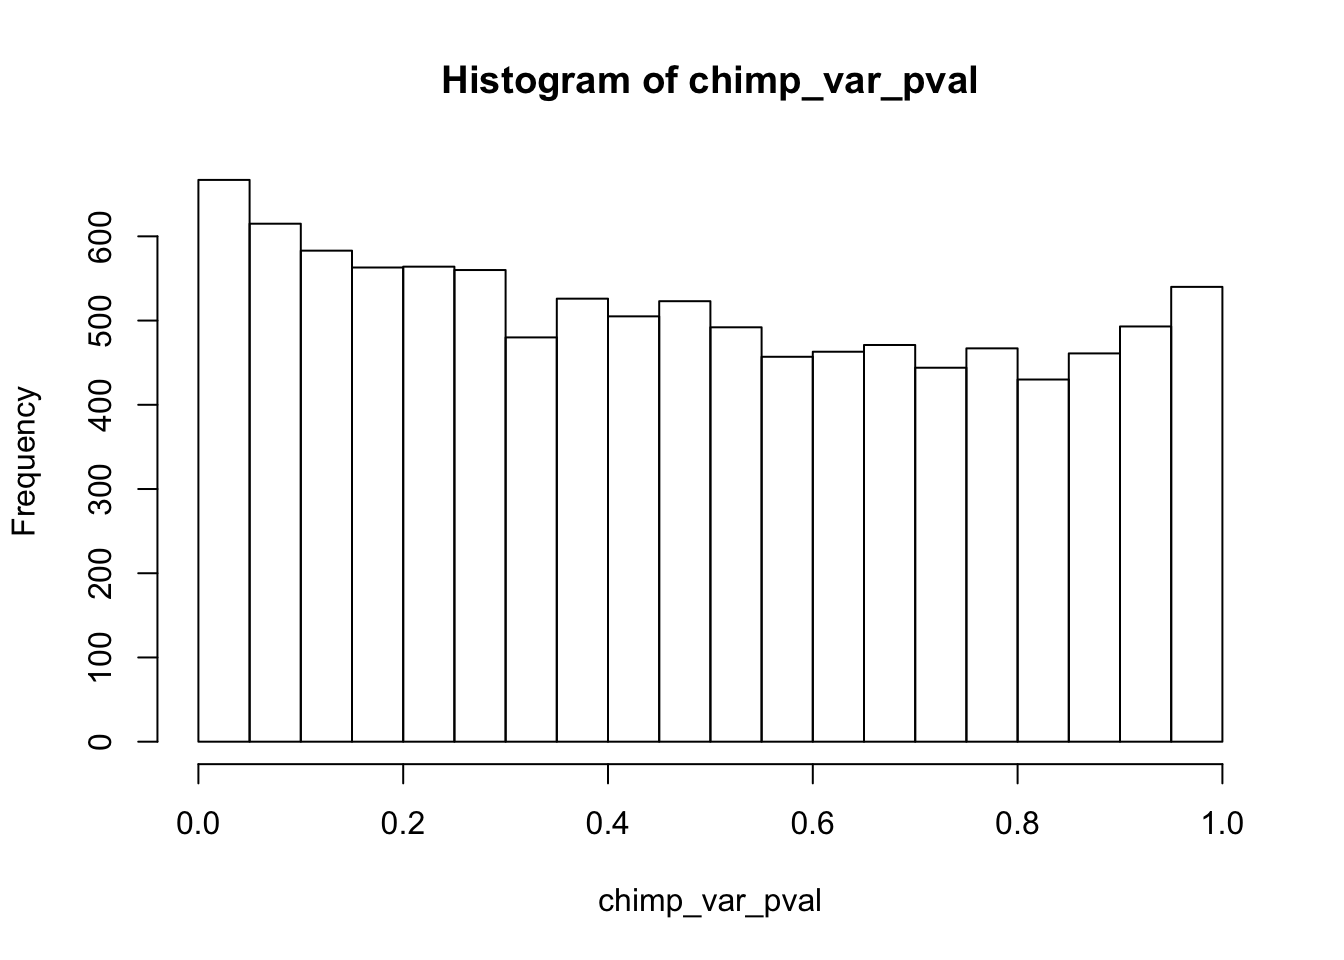

# Inc. in variance from day 1 to day 3 humans
qqplot_inc_day13 <- find_qqplot_inc_humans(17,20,37,40,11,16,31,36,0.05)

# Reduction of variance qqplots- humans
dev.off()null device
1 par(mfrow=c(2,4),oma = c(2, 2, 2, 2))
# Reduction of variance to day 0 to 1 humans
plot(qqplot_red_day01[[4]],qqplot_red_day01[[5]], pch = 16, xlim = c(0,6), ylim = c(0,6), col = pal[2], xlab = "-log10(p) Expected", ylab = "-log10(p) Obeserved", main = "Day 0 to 1")
abline(0,1, col = "black")
# Add to the plot
points(qqplot_red_day01[[6]],qqplot_red_day01[[7]], pch = 16, col = pal[3])
# Reduction of variance to day 1 to 2
plot(qqplot_red_day12[[4]],qqplot_red_day12[[5]], pch = 16, xlim = c(0,6), ylim = c(0,6), col = pal[2], xlab = "-log10(p) Expected", ylab = "-log10(p) Obeserved", main = "Day 1 to 2")
abline(0,1, col = "black")
# Add to the plot
points(qqplot_red_day12[[6]],qqplot_red_day12[[7]], pch = 16, col = pal[3])
# Reduction of variance to day 2 to 3
plot(qqplot_red_day23[[4]],qqplot_red_day23[[5]], pch = 16, xlim = c(0,6), ylim = c(0,6), col = pal[2], xlab = "-log10(p) Expected", ylab = "-log10(p) Obeserved", main = "Day 2 to 3")
abline(0,1, col = "black")
# Add to the plot
points(qqplot_red_day23[[6]],qqplot_red_day23[[7]], pch = 16, col = pal[3])
# Reduction of variance to day 0 to 2
plot(qqplot_red_day02[[4]],qqplot_red_day02[[5]], pch = 16, xlim = c(0,6), ylim = c(0,6), col = pal[2], xlab = "-log10(p) Expected", ylab = "-log10(p) Obeserved", main = "Day 0 to 2")
abline(0,1, col = "black")
# Add to the plot
points(qqplot_red_day02[[6]],qqplot_red_day02[[7]], pch = 16, col = pal[3])
# Add bottom title
mtext("Reduction in Variation", font = 2, side = 3, line = -1.5, outer = TRUE)
### Increase in variance
# Inc variance to day 0 to 1
plot(qqplot_inc_day01[[4]],qqplot_inc_day01[[5]], pch = 16, xlim = c(0,6), ylim = c(0,6), col = pal[2], xlab = "-log10(p) Expected", ylab = "-log10(p) Obeserved", main = "Day 0 to 1")
abline(0,1, col = "black")
# Add to the plot
points(qqplot_inc_day01[[6]],qqplot_inc_day01[[7]], pch = 16, col = pal[3])
# Increase of variance to day 1 to 2
plot(qqplot_inc_day12[[4]],qqplot_inc_day12[[5]], pch = 16, xlim = c(0,6), ylim = c(0,6), col = pal[2], xlab = "-log10(p) Expected", ylab = "-log10(p) Obeserved", main = "Day 1 to 2")
abline(0,1, col = "black")
# Add to the plot
points(qqplot_inc_day12[[6]],qqplot_inc_day12[[7]], pch = 16, col = pal[3])
# Increase of variance to day 2 to 3
plot(qqplot_inc_day23[[4]],qqplot_inc_day23[[5]], pch = 16, xlim = c(0,6), ylim = c(0,6), col = pal[2], xlab = "-log10(p) Expected", ylab = "-log10(p) Obeserved", main = "Day 2 to 3")
abline(0,1, col = "black")
# Add to the plot
points(qqplot_inc_day23[[6]],qqplot_inc_day23[[7]], pch = 16, col = pal[3])
# Increase of variance to day 0 to 2
plot(qqplot_inc_day02[[4]],qqplot_inc_day02[[5]], pch = 16, xlim = c(0,6), ylim = c(0,6), col = pal[2], xlab = "-log10(p) Expected", ylab = "-log10(p) Obeserved", main = "Day 0 to 2")
abline(0,1, col = "black")
# Add to the plot
points(qqplot_inc_day02[[6]],qqplot_inc_day02[[7]], pch = 16, col = pal[3])
mtext("Increase in Variation", font = 2, side = 3, line = -29, outer = TRUE)
par(fig = c(0, 1, 0, 1), oma = c(0, 0, 0, 0), mar = c(0, 0, 0, 0), new = TRUE)
plot(0, 0, type = "n", bty = "n", xaxt = "n", yaxt = "n")
legend("bottomright", c("Human", "Human|significant in chimpanzee"), xpd = TRUE, horiz = TRUE, inset = c(0, 0), bty = "n", pch = c(16, 16), col = pal[2:3], cex = 1.5)
#legend("top", c("Human", "Human|significant in chimpanzee"), xpd = TRUE, horiz = TRUE, inset = c(0, 0), bty = "n", pch = c(16, 16), col = pal[2:3], cex = 0.7)Estimates of pi0 and pi1 for reduction of variation in humans conditioned on significance in chimps (p = 0.05)
####################### REDUCTION OF VARIATION IN HUMANS (p = 0.05)
# Day 0 to 1
# Obtain pvalues
human_p_values_gen <- as.data.frame(qqplot_red_day01[1])
shared_p_values_gen <- as.data.frame(qqplot_red_day01[2])
# Pi_0 estimate for the humans
pi0est_humans <- qvalue(p= human_p_values_gen, pi0.method="smoother", fdr.level=NULL, robust=TRUE)$pi0
pi0est_humans[1] 0.174912# Pi_1 estimate for the humans
pi1est_humans <- 1 - pi0est_humans
pi1est_humans[1] 0.825088# Pi_0 estimate for the chimps given significant in the humans
pi0est_humans_given_chimps <- qvalue(p=shared_p_values_gen, pi0.method="smoother", fdr.level=NULL, robust=TRUE)$pi0
pi0est_humans_given_chimps[1] 0.1556767# Pi_1 estimate for the humans
pi1est_humans_given_chimps <- 1 - pi0est_humans_given_chimps
pi1est_humans_given_chimps[1] 0.8443233# Let's overlap the two histograms
labels_h <- array("Human", dim = c(10304,1))
labels_c <- array("Shared (Human|Significant in Chimps)", dim = c(as.data.frame(qqplot_red_day01[[3]][1]),1))
chimps <- cbind(labels_c, shared_p_values_gen)
colnames(chimps) <- c("Species", "pval")
humans <- cbind(labels_h, human_p_values_gen)
colnames(humans) <- c("Species", "pval")
# Combine the two
all_pval <- rbind(humans[,1:2], chimps[,1:2])
pal <- c("#00A4F4", "white")
p5_05 <- ggplot(all_pval, aes(pval, fill = Species)) + scale_fill_manual(values=pal[1:2]) +
geom_density(show.legend = F, alpha = 1) +
scale_x_continuous(limits = c(0,1), breaks = seq(0,1,0.25)) +
theme_bw() + labs(title = "Day 0 to 1") + theme(plot.title = element_text(face = "bold")) + labs(x = "Unadjusted p-values") + labs(y = "Density") + scale_y_continuous(labels=scaleFUN) +
geom_hline(yintercept = pi0est_humans_given_chimps, size = 2.5) +
geom_hline(yintercept = pi0est_humans, size = 2.5, color = "#00A4F4") +
annotate("text", label= 'bold(bolditalic(hat(pi)[0][", humans"])=="0.17")', parse=TRUE, x=0.2, y=(pi0est_humans+0.32), colour = "#00A4F4", size = 6) + annotate("text", label = 'bold(bolditalic(hat(pi)[0][", shared"])=="0.16")', parse=TRUE, x=0.2, y=(pi0est_humans_given_chimps+0.15), size = 6)
p5_05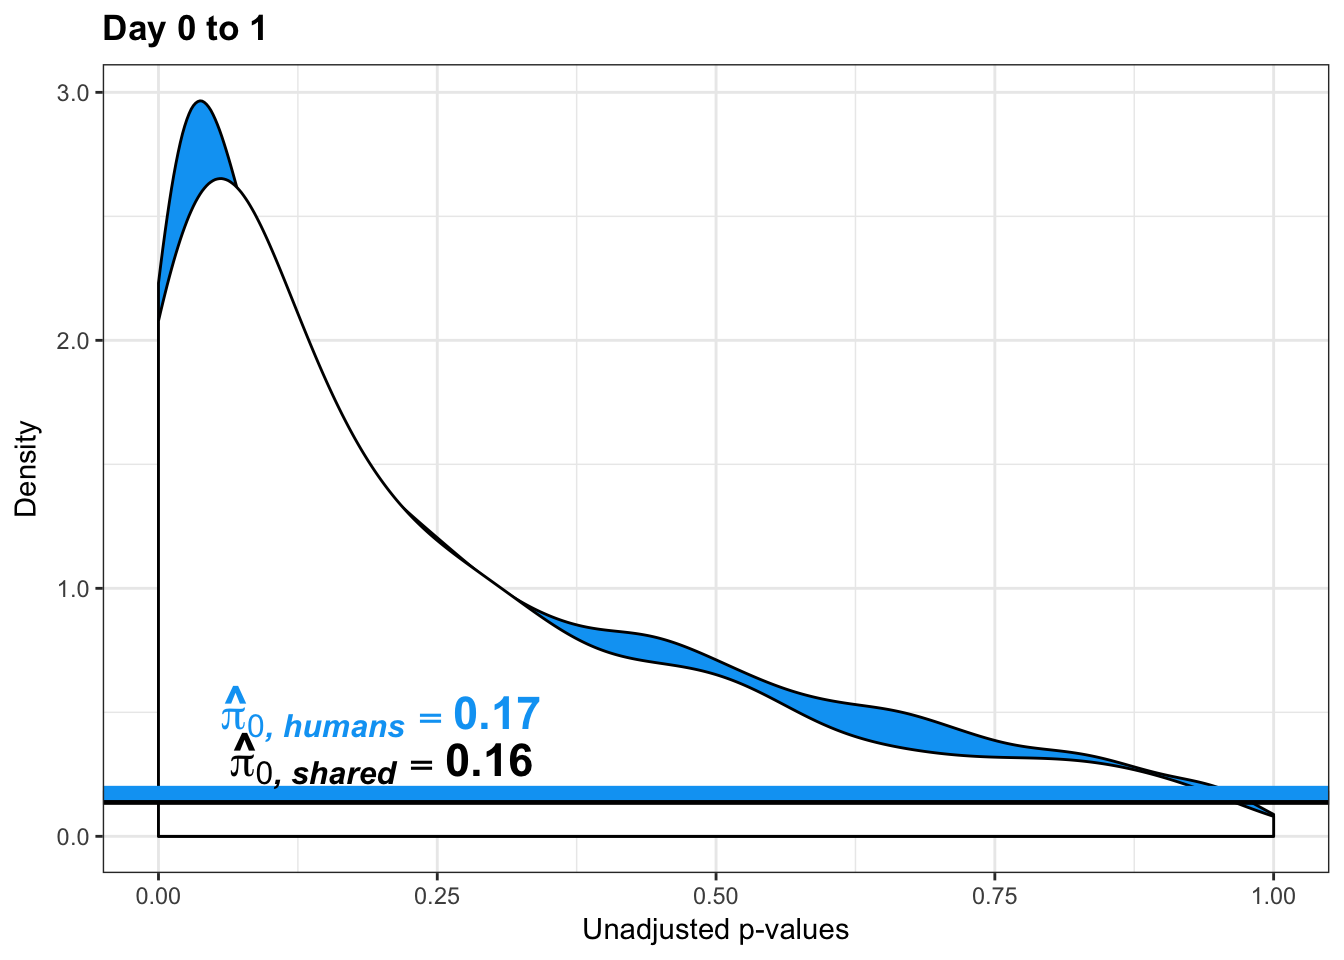
# Day 1 to 2
# Obtain pvalues
human_p_values_gen <- as.data.frame(qqplot_red_day12[1])
shared_p_values_gen <- as.data.frame(qqplot_red_day12[2])
# Pi_0 estimate for the humans
pi0est_humans <- qvalue(p= human_p_values_gen, pi0.method="smoother", fdr.level=NULL, robust=TRUE)$pi0
pi0est_humans[1] 1# Pi_1 estimate for the humans
pi1est_humans <- 1 - pi0est_humans
pi1est_humans[1] 0# Pi_0 estimate for the chimps given significant in the humans
pi0est_humans_given_chimps <- qvalue(p=shared_p_values_gen, pi0.method="smoother", fdr.level=NULL, robust=TRUE)$pi0
pi0est_humans_given_chimps[1] 1# Pi_1 estimate for the humans
pi1est_humans_given_chimps <- 1 - pi0est_humans_given_chimps
pi1est_humans_given_chimps[1] 0# Let's overlap the two histograms
labels_h <- array("Human", dim = c(10304,1))
labels_c <- array("Shared (Human|Significant in Chimps)", dim = c(as.data.frame(qqplot_red_day12[[3]][1]),1))
chimps <- cbind(labels_c, shared_p_values_gen)
colnames(chimps) <- c("Species", "pval")
humans <- cbind(labels_h, human_p_values_gen)
colnames(humans) <- c("Species", "pval")
# Combine the two
all_pval <- rbind(humans[,1:2], chimps[,1:2])
pal <- c("#00A4F4", "white")
p6_05 <- ggplot(all_pval, aes(pval, fill = Species)) + scale_fill_manual(values=pal[1:2]) +
geom_density(show.legend = F, alpha = 1) +
scale_x_continuous(limits = c(0,1), breaks = seq(0,1,0.25)) +
theme_bw() + labs(title = "Day 1 to 2") + theme(plot.title = element_text(face = "bold")) + labs(x = "Unadjusted p-values") + labs(y = "Density") + scale_y_continuous(labels=scaleFUN) +
geom_hline(yintercept = pi0est_humans_given_chimps, size = 2.5) +
geom_hline(yintercept = pi0est_humans, size = 2.5, color = "#00A4F4") +
annotate("text", label= 'bold(bolditalic(hat(pi)[0][", humans"])=="1")', parse=TRUE, x=0.2, y=(pi0est_humans+0.3), colour = "#00A4F4", size = 6) + annotate("text", label = 'bold(bolditalic(hat(pi)[0][", shared"])=="1")', parse=TRUE, x=0.2, y=(pi0est_humans_given_chimps+0.15), size = 6)
p6_05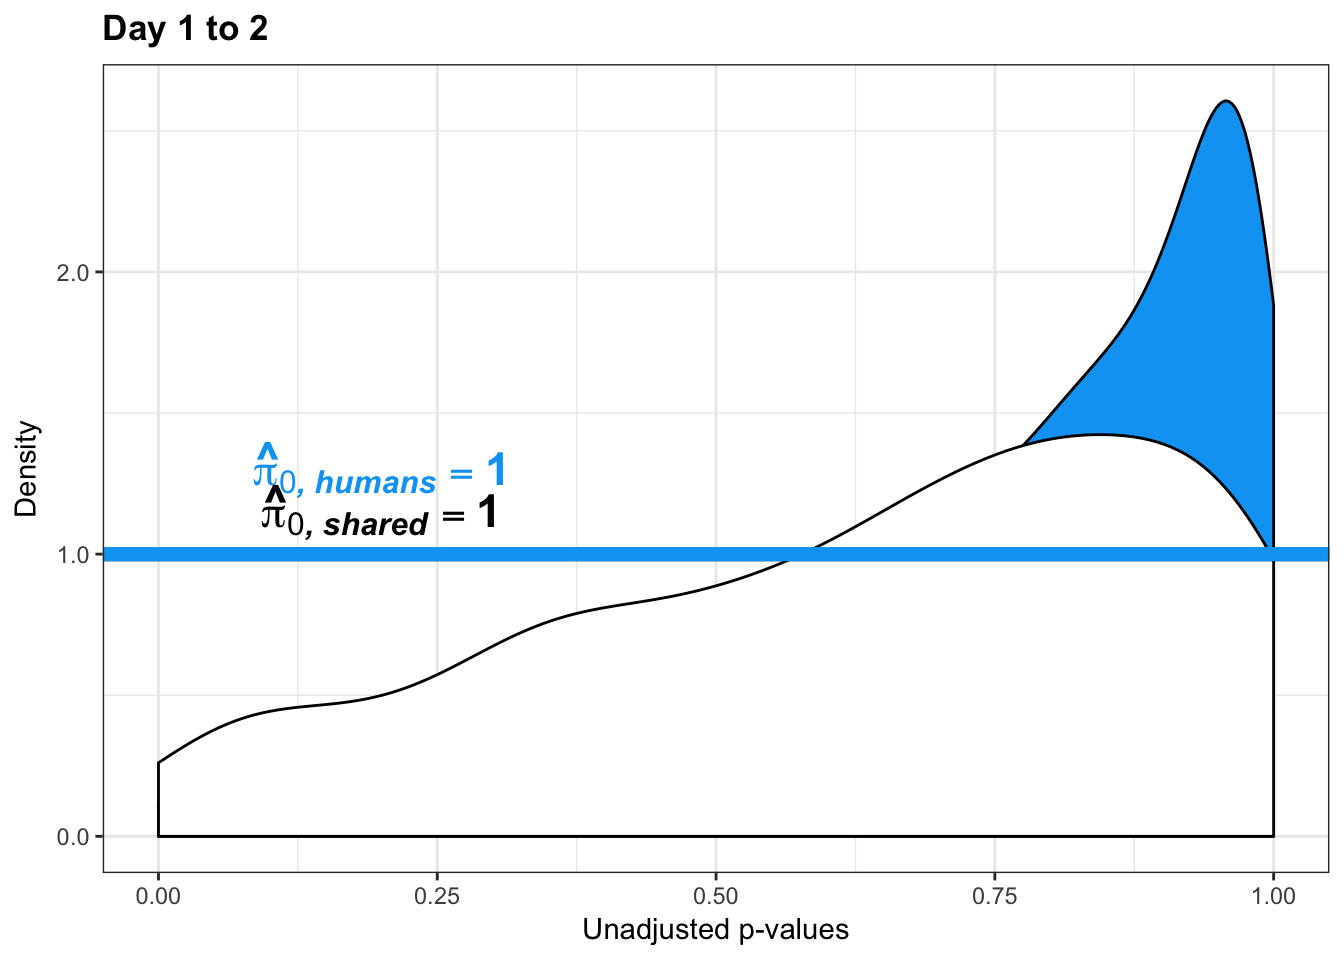
pval_h <- humans[,1:2]
pval_c <- chimps[,1:2]
pval_ch <- rbind(pval_h, pval_c)
resp <- rep(c("Day 1 to 2"), times = nrow(pval_c)+nrow(pval_h))
line1 <- as.data.frame(rep(c("NA"), times = nrow(pval_h)))
colnames(line1) <- c("line")
line2 <- as.data.frame(rep(c("NA"), times = nrow(pval_c)))
colnames(line2) <- c("line")
line <- rbind(line1, line2)
figS12A <- cbind(pval_ch, resp, line)
# Day 2 to 3
# Obtain pvalues
human_p_values_gen <- as.data.frame(qqplot_red_day23[1])
shared_p_values_gen <- as.data.frame(qqplot_red_day23[2])
# Pi_0 estimate for the humans
pi0est_humans <- qvalue(p= human_p_values_gen, pi0.method="smoother", fdr.level=NULL, robust=TRUE)$pi0
pi0est_humans[1] 0.8664877# Pi_1 estimate for the humans
pi1est_humans <- 1 - pi0est_humans
pi1est_humans[1] 0.1335123# Pi_0 estimate for the chimps given significant in the humans
pi0est_humans_given_chimps <- qvalue(p=shared_p_values_gen, pi0.method="smoother", fdr.level=NULL, robust=TRUE)$pi0
pi0est_humans_given_chimps[1] 0.8071014# Pi_1 estimate for the humans
pi1est_humans_given_chimps <- 1 - pi0est_humans_given_chimps
pi1est_humans_given_chimps[1] 0.1928986# Let's overlap the two histograms
labels_h <- array("Human", dim = c(10304,1))
labels_c <- array("Shared (Human|Significant in Chimps)", dim = c(as.data.frame(qqplot_red_day23[[3]][1]),1))
chimps <- cbind(labels_c, shared_p_values_gen)
colnames(chimps) <- c("Species", "pval")
humans <- cbind(labels_h, human_p_values_gen)
colnames(humans) <- c("Species", "pval")
# Combine the two
all_pval <- rbind(humans[,1:2], chimps[,1:2])
pal <- c("#00A4F4", "white")
p7_05 <- ggplot(all_pval, aes(pval, fill = Species)) + scale_fill_manual(values=pal[1:2]) +
geom_density(show.legend = F, alpha = 1) +
scale_x_continuous(limits = c(0,1), breaks = seq(0,1,0.25)) +
theme_bw() + labs(title = "Day 2 to 3") + theme(plot.title = element_text(face = "bold")) + labs(x = "Unadjusted p-values") + labs(y = "Density") + scale_y_continuous(labels=scaleFUN) +
geom_hline(yintercept = pi0est_humans_given_chimps, size = 2.5) +
geom_hline(yintercept = pi0est_humans, size = 2.5, color = "#00A4F4") +
annotate("text", label= 'bold(bolditalic(hat(pi)[0][", humans"])=="0.87")', parse=TRUE, x=0.2, y=(pi0est_humans+0.3), colour = "#00A4F4", size = 6) + annotate("text", label = 'bold(bolditalic(hat(pi)[0][", shared"])=="0.81")', parse=TRUE, x=0.2, y=(pi0est_humans_given_chimps+0.3), size = 6)
p7_05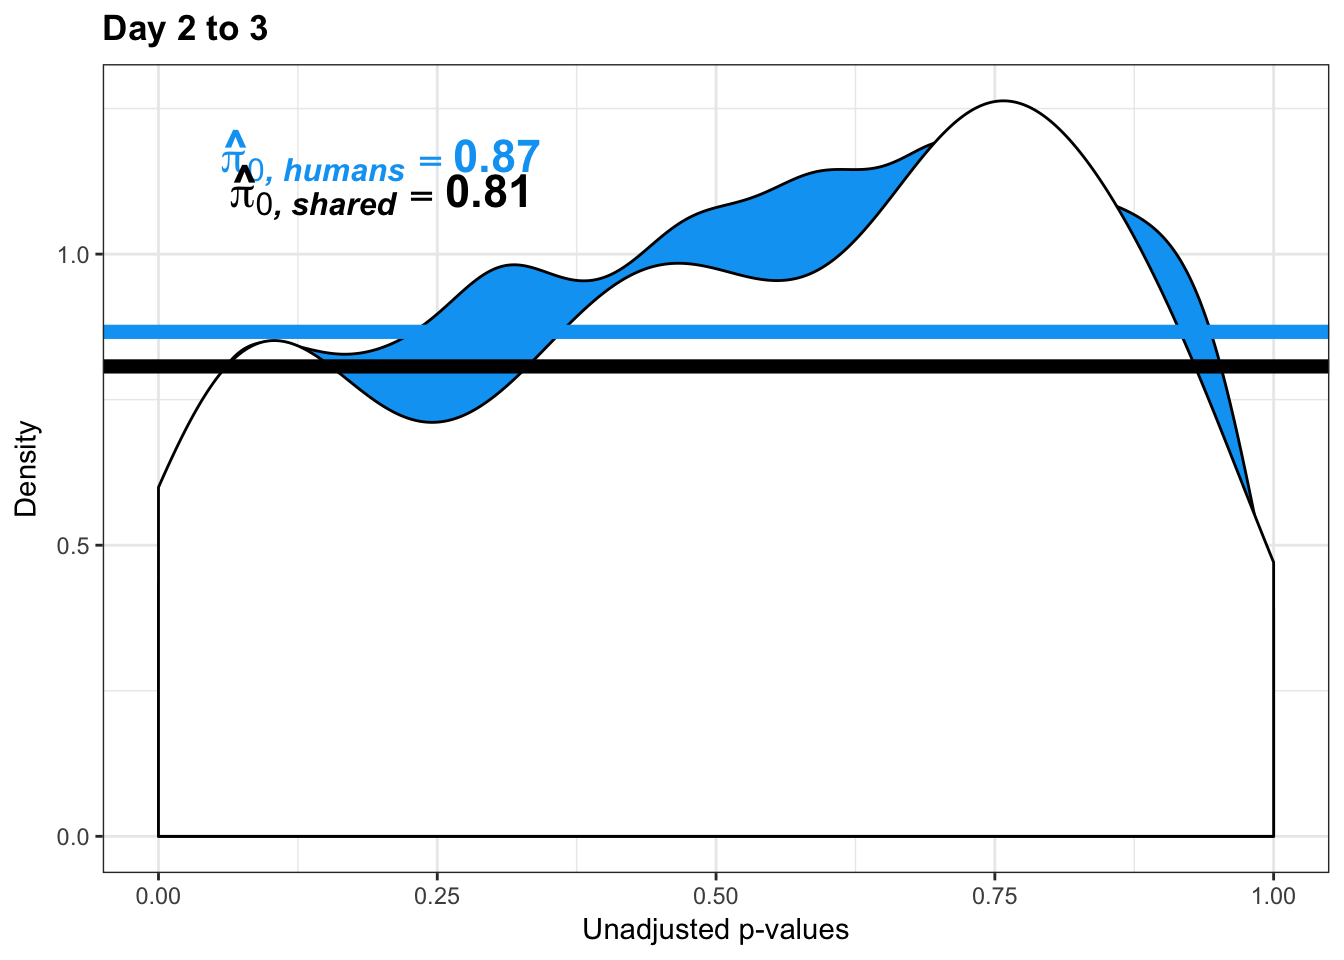
pval_h <- humans[,1:2]
pval_c <- chimps[,1:2]
pval_ch <- rbind(pval_h, pval_c)
resp <- rep(c("Day 2 to 3"), times = nrow(pval_c)+nrow(pval_h))
line1 <- as.data.frame(rep(c("NA"), times = nrow(pval_h)))
colnames(line1) <- c("line")
line2 <- as.data.frame(rep(c("NA"), times = nrow(pval_c)))
colnames(line2) <- c("line")
line <- rbind(line1, line2)
figS12A_fig <- cbind(pval_ch, resp, line)
figS12A <- rbind(figS12A, figS12A_fig)
write.csv(figS12A, "/Users/laurenblake/Dropbox/Endoderm TC/Draft versions/Resubmit1_Genome Biology/Supplemental/Data_figS13B.csv", quote = FALSE, row.names = FALSE)
# Day 1 to 3
# Obtain pvalues
human_p_values_gen <- as.data.frame(qqplot_red_day13[1])
shared_p_values_gen <- as.data.frame(qqplot_red_day13[2])
# Pi_0 estimate for the humans
pi0est_humans <- qvalue(p= human_p_values_gen, pi0.method="smoother", fdr.level=NULL, robust=TRUE)$pi0
pi0est_humans[1] 1# Pi_1 estimate for the humans
pi1est_humans <- 1 - pi0est_humans
pi1est_humans[1] 0# Pi_0 estimate for the chimps given significant in the humans
pi0est_humans_given_chimps <- qvalue(p=shared_p_values_gen, pi0.method="smoother", fdr.level=NULL, robust=TRUE)$pi0
pi0est_humans_given_chimps[1] 1# Pi_1 estimate for the humans
pi1est_humans_given_chimps <- 1 - pi0est_humans_given_chimps
pi1est_humans_given_chimps[1] 0# Let's overlap the two histograms
labels_h <- array("Human", dim = c(10304,1))
labels_c <- array("Shared (Human|Significant in Chimps)", dim = c(as.data.frame(qqplot_red_day13[[3]][1]),1))
chimps <- cbind(labels_c, shared_p_values_gen)
colnames(chimps) <- c("Species", "pval")
humans <- cbind(labels_h, human_p_values_gen)
colnames(humans) <- c("Species", "pval")
# Combine the two
all_pval <- rbind(humans[,1:2], chimps[,1:2])
pal <- c("#00A4F4", "white")
p8_05 <- ggplot(all_pval, aes(pval, fill = Species)) + scale_fill_manual(values=pal[1:2]) +
geom_density(show.legend = F, alpha = 1) +
scale_x_continuous(limits = c(0,1), breaks = seq(0,1,0.25)) +
theme_bw() + labs(title = "Day 1 to 3") + theme(plot.title = element_text(face = "bold")) + labs(x = "Unadjusted p-values") + labs(y = "Density") + scale_y_continuous(labels=scaleFUN) +
geom_hline(yintercept = pi0est_humans_given_chimps, size = 2.5) +
geom_hline(yintercept = pi0est_humans, size = 2.5, color = "#00A4F4") +
annotate("text", label= 'bold(bolditalic(hat(pi)[0][", humans"])=="1")', parse=TRUE, x=0.2, y=(pi0est_humans+0.30), colour = "#00A4F4", size = 6) + annotate("text", label = 'bold(bolditalic(hat(pi)[0][", shared"])=="1")', parse=TRUE, x=0.2, y=(pi0est_humans_given_chimps+0.12), size = 6)
p8_05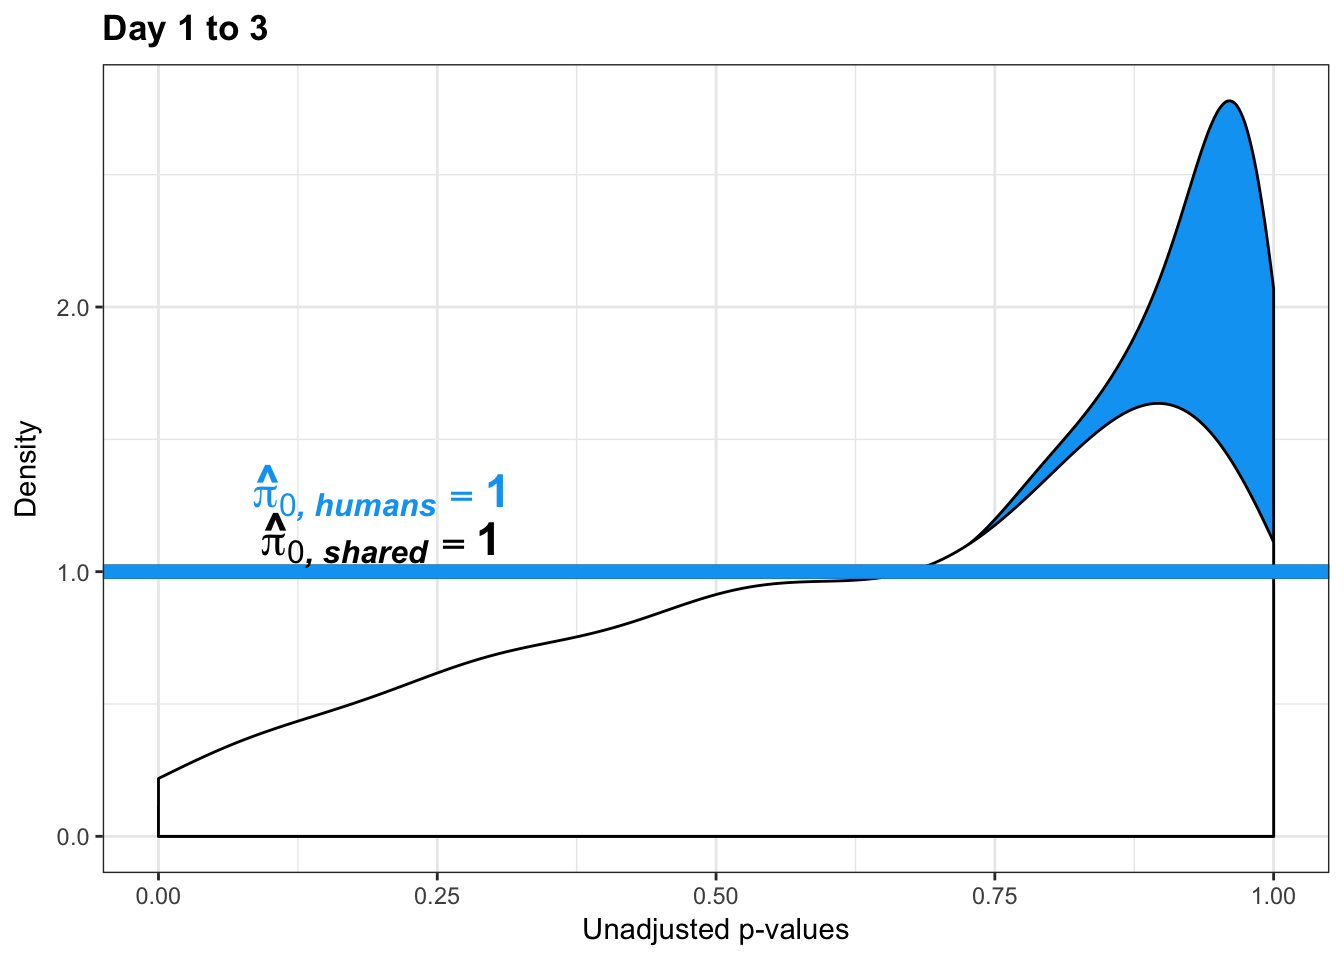
pval_h <- humans[,1:2]
pval_c <- chimps[,1:2]
pval_ch <- rbind(pval_h, pval_c)
resp <- rep(c("Day 1 to 3"), times = nrow(pval_c)+nrow(pval_h))
line1 <- as.data.frame(rep(c("NA"), times = nrow(pval_h)))
colnames(line1) <- c("line")
line2 <- as.data.frame(rep(c("NA"), times = nrow(pval_c)))
colnames(line2) <- c("line")
line <- rbind(line1, line2)
figS12A_fig <- cbind(pval_ch, resp, line)
figS12A <- rbind(figS12A, figS12A_fig)
multiplot(p1_05,p5_05,p2_05,p6_05,p3_05,p7_05,p4_05,p8_05,cols=4)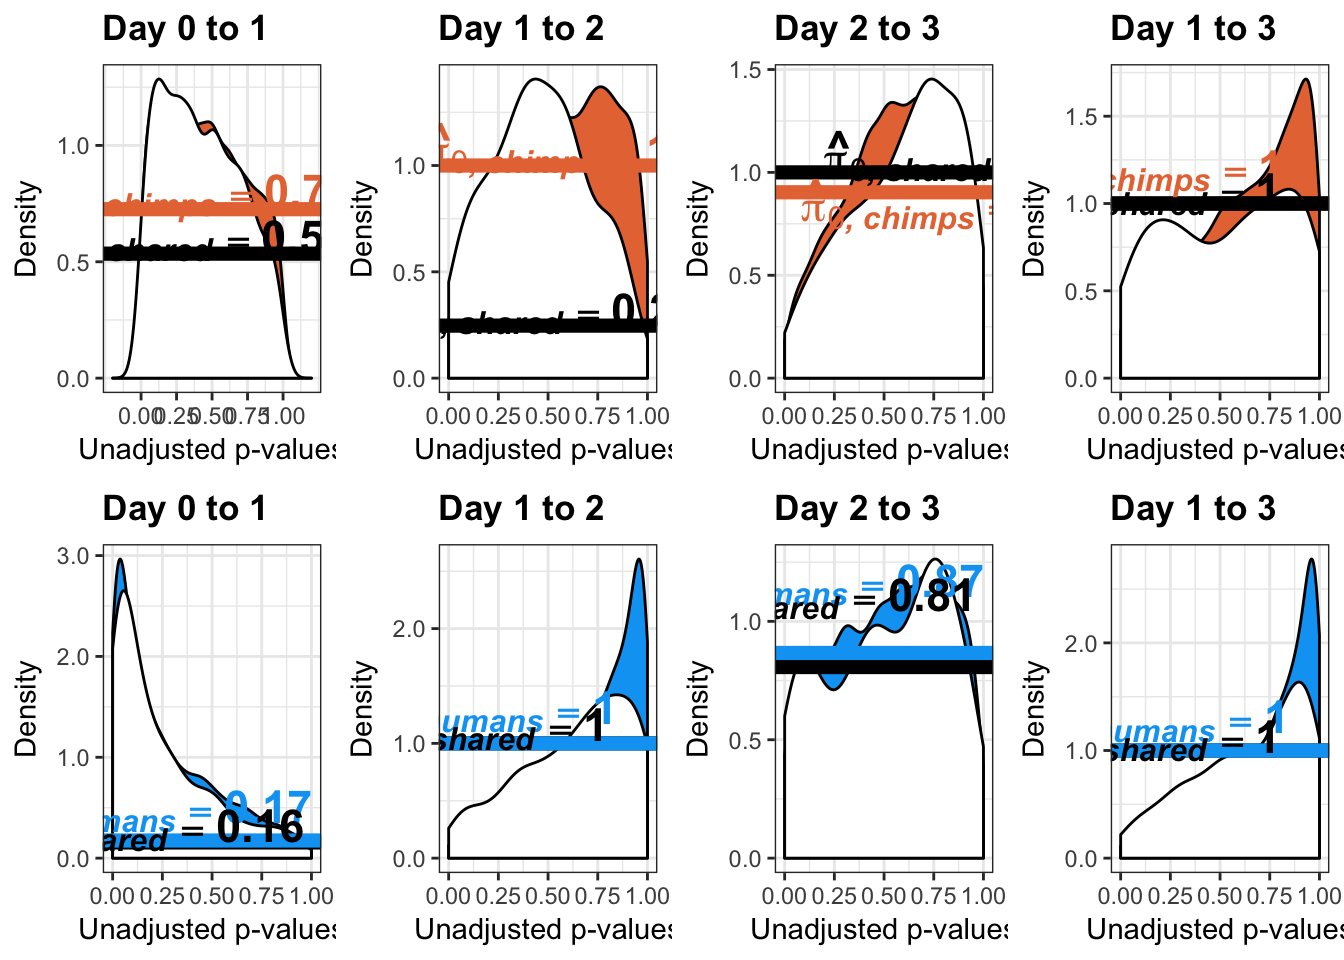
Estimates of pi0 and pi1 for increase of variation in humans conditioned on significance in chimps (p = 0.05)
####################### INCREASE IN VARIATION IN HUMANS (p = 0.05)
# Day 0 to 1
# Obtain pvalues
human_p_values_gen <- as.data.frame(qqplot_inc_day01[1])
shared_p_values_gen <- as.data.frame(qqplot_inc_day01[2])
# Pi_0 estimate for the humans
pi0est_humans <- qvalue(p= human_p_values_gen, pi0.method="smoother", fdr.level=NULL, robust=TRUE)$pi0
pi0est_humans[1] 1# Pi_1 estimate for the humans
pi1est_humans <- 1 - pi0est_humans
pi1est_humans[1] 0# Pi_0 estimate for the chimps given significant in the humans
pi0est_humans_given_chimps <- qvalue(p=shared_p_values_gen, pi0.method="smoother", fdr.level=NULL, robust=TRUE)$pi0
pi0est_humans_given_chimps[1] 1# Pi_1 estimate for the humans
pi1est_humans_given_chimps <- 1 - pi0est_humans_given_chimps
pi1est_humans_given_chimps[1] 0# Let's overlap the two histograms
labels_h <- array("Human", dim = c(10304,1))
labels_c <- array("Shared (Human|Significant in Chimps)", dim = c(as.data.frame(qqplot_inc_day01[[3]][1]),1))
chimps <- cbind(labels_c, shared_p_values_gen)
colnames(chimps) <- c("Species", "pval")
humans <- cbind(labels_h, human_p_values_gen)
colnames(humans) <- c("Species", "pval")
# Combine the two
all_pval <- rbind(humans[,1:2], chimps[,1:2])
pal <- c("#00A4F4", "white")
p5_inc_05 <- ggplot(all_pval, aes(pval, fill = Species)) + scale_fill_manual(values=pal[1:2]) +
geom_density(show.legend = F, alpha = 1) +
scale_x_continuous(limits = c(0,1), breaks = seq(0,1,0.25)) +
theme_bw() + labs(title = "Day 0 to 1") + theme(plot.title = element_text(face = "bold")) + labs(x = "Unadjusted p-values") + labs(y = "Density") + scale_y_continuous(labels=scaleFUN) +
geom_hline(yintercept = pi0est_humans_given_chimps, size = 2.5) +
geom_hline(yintercept = pi0est_humans, size = 2.5, color = "#00A4F4") +
annotate("text", label= 'bold(bolditalic(hat(pi)[0][", humans"])=="1")', parse=TRUE, x=0.2, y=(pi0est_humans+0.32), colour = "#00A4F4", size = 6) + annotate("text", label = 'bold(bolditalic(hat(pi)[0][", shared"])=="1")', parse=TRUE, x=0.2, y=(pi0est_humans_given_chimps+0.15), size = 6)
p5_inc_05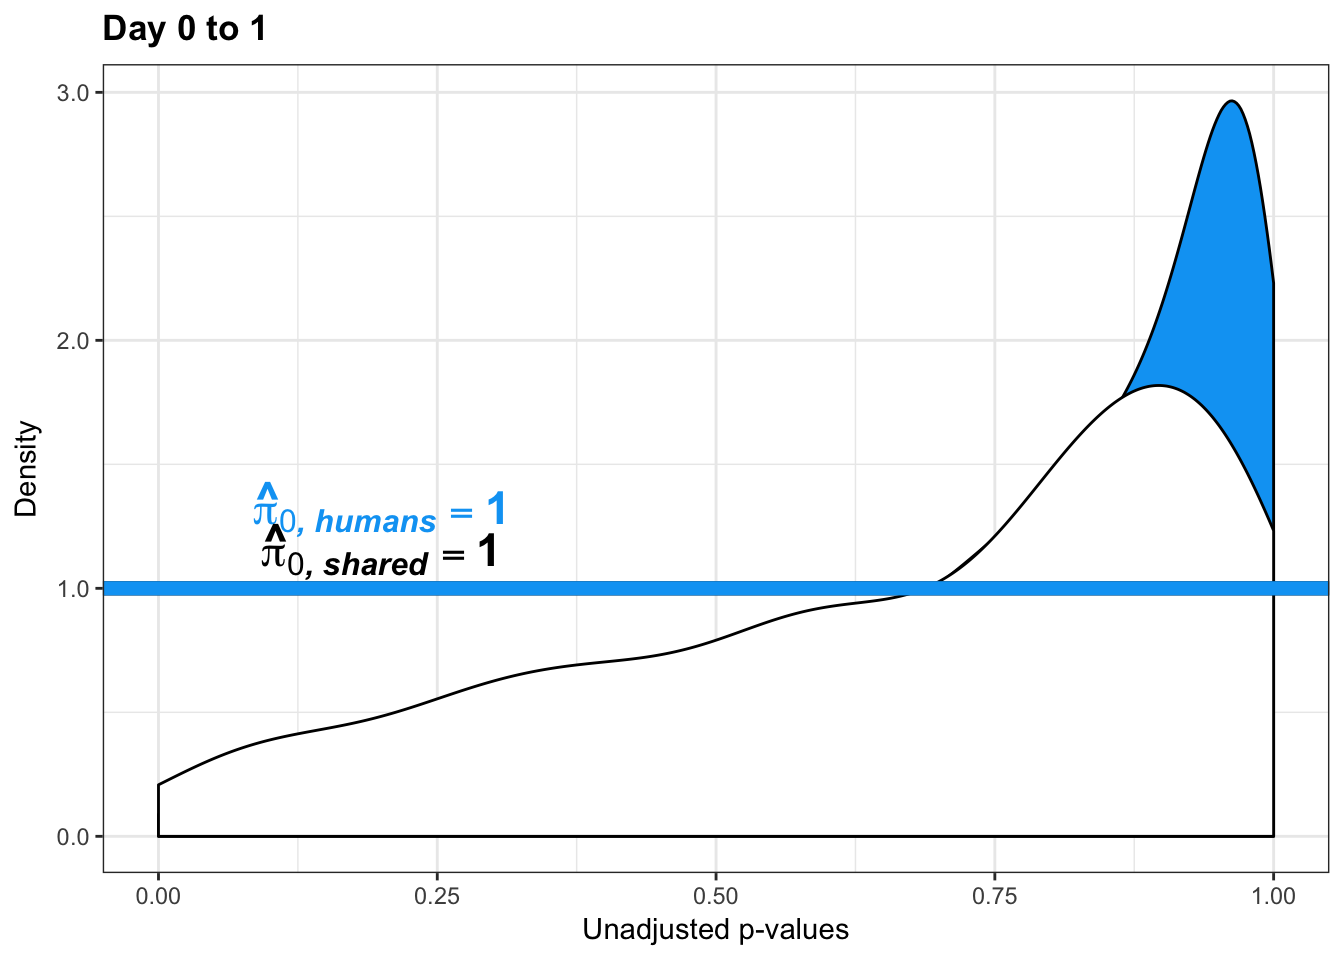
pval_h <- humans[,1:2]
pval_c <- chimps[,1:2]
pval_ch <- rbind(pval_h, pval_c)
resp <- rep(c("Day 0 to 1"), times = nrow(pval_c)+nrow(pval_h))
line1 <- as.data.frame(rep(c("NA"), times = nrow(pval_h)))
colnames(line1) <- c("line")
line2 <- as.data.frame(rep(c("NA"), times = nrow(pval_c)))
colnames(line2) <- c("line")
line <- rbind(line1, line2)
figS12A <- cbind(pval_ch, resp, line)
# Day 1 to 2
# Obtain pvalues
human_p_values_gen <- as.data.frame(qqplot_inc_day12[1])
shared_p_values_gen <- as.data.frame(qqplot_inc_day12[2])
# Pi_0 estimate for the humans
pi0est_humans <- qvalue(p= human_p_values_gen, pi0.method="smoother", fdr.level=NULL, robust=TRUE)$pi0
pi0est_humans[1] 0.2141993# Pi_1 estimate for the humans
pi1est_humans <- 1 - pi0est_humans
pi1est_humans[1] 0.7858007# Pi_0 estimate for the chimps given significant in the humans
pi0est_humans_given_chimps <- qvalue(p=shared_p_values_gen, pi0.method="smoother", fdr.level=NULL, robust=TRUE)$pi0
pi0est_humans_given_chimps[1] 0.09012664# Pi_1 estimate for the humans
pi1est_humans_given_chimps <- 1 - pi0est_humans_given_chimps
pi1est_humans_given_chimps[1] 0.9098734# Let's overlap the two histograms
labels_h <- array("Human", dim = c(10304,1))
labels_c <- array("Shared (Human|Significant in Chimps)", dim = c(as.data.frame(qqplot_inc_day12[[3]][1]),1))
chimps <- cbind(labels_c, shared_p_values_gen)
colnames(chimps) <- c("Species", "pval")
humans <- cbind(labels_h, human_p_values_gen)
colnames(humans) <- c("Species", "pval")
# Combine the two
all_pval <- rbind(humans[,1:2], chimps[,1:2])
pal <- c("#00A4F4", "white")
p6_inc_05 <- ggplot(all_pval, aes(pval, fill = Species)) + scale_fill_manual(values=pal[1:2]) +
geom_density(show.legend = F, alpha = 1) +
scale_x_continuous(limits = c(0,1), breaks = seq(0,1,0.25)) +
theme_bw() + labs(title = "Day 1 to 2") + theme(plot.title = element_text(face = "bold")) + labs(x = "Unadjusted p-values") + labs(y = "Density") + scale_y_continuous(labels=scaleFUN) +
geom_hline(yintercept = pi0est_humans_given_chimps, size = 2.5) +
geom_hline(yintercept = pi0est_humans, size = 2.5, color = "#00A4F4") +
annotate("text", label= 'bold(bolditalic(hat(pi)[0][", humans"])=="0.21")', parse=TRUE, x=0.2, y=(pi0est_humans+0.32), colour = "#00A4F4", size = 6) + annotate("text", label = 'bold(bolditalic(hat(pi)[0][", shared"])=="0.09")', parse=TRUE, x=0.2, y=(pi0est_humans_given_chimps+0.27), size = 6)
p6_inc_05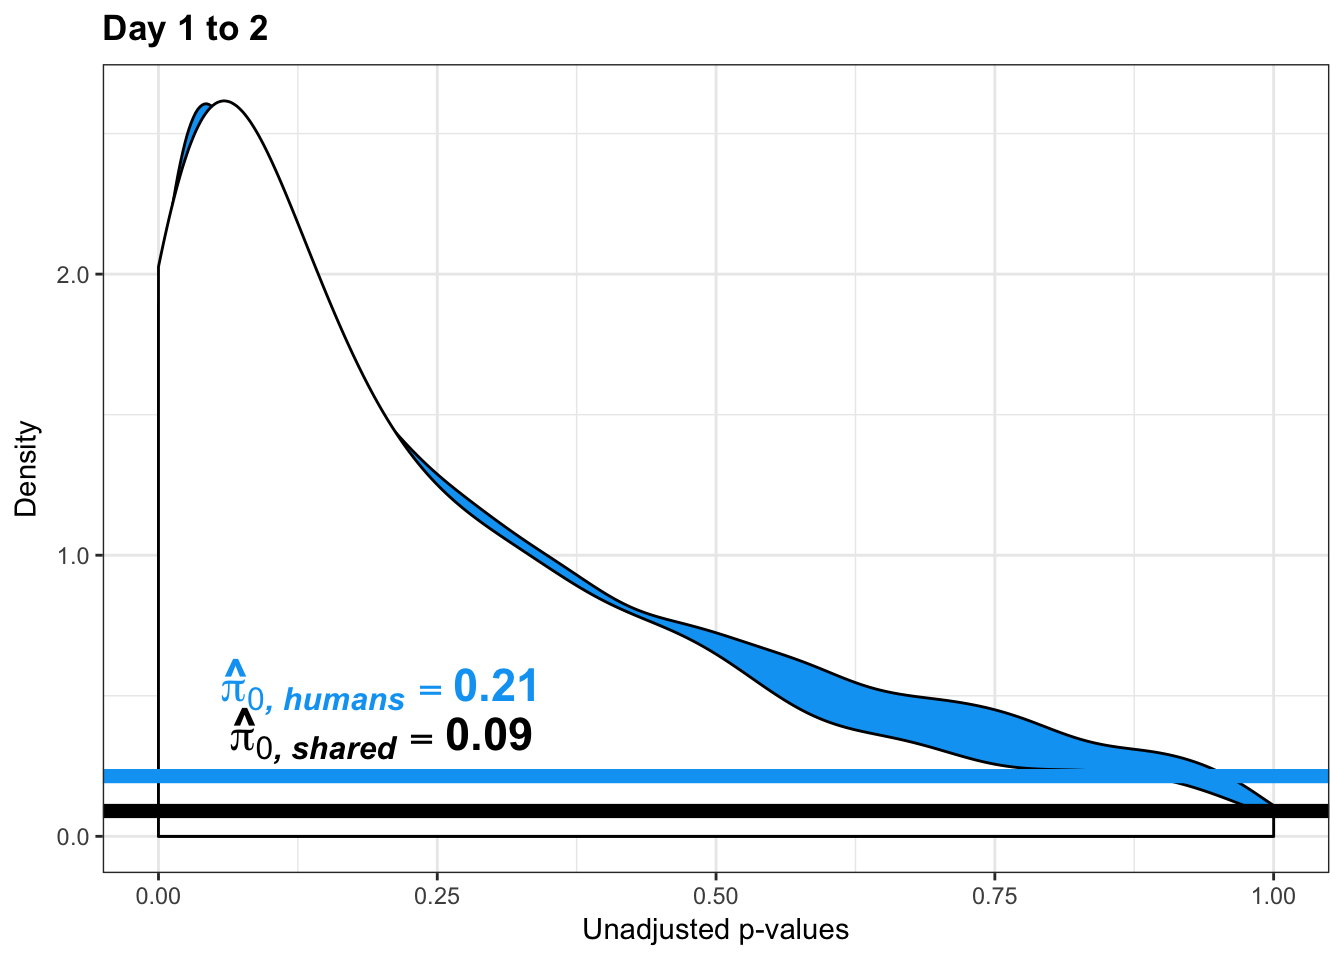
# Day 2 to 3
# Obtain pvalues
human_p_values_gen <- as.data.frame(qqplot_inc_day23[1])
shared_p_values_gen <- as.data.frame(qqplot_inc_day23[2])
# Pi_0 estimate for the humans
pi0est_humans <- qvalue(p= human_p_values_gen, pi0.method="smoother", fdr.level=NULL, robust=TRUE)$pi0
pi0est_humans[1] 0.8477893# Pi_1 estimate for the humans
pi1est_humans <- 1 - pi0est_humans
pi1est_humans[1] 0.1522107# Pi_0 estimate for the chimps given significant in the humans
pi0est_humans_given_chimps <- qvalue(p=shared_p_values_gen, pi0.method="smoother", fdr.level=NULL, robust=TRUE)$pi0
pi0est_humans_given_chimps[1] 0.9526267# Pi_1 estimate for the humans
pi1est_humans_given_chimps <- 1 - pi0est_humans_given_chimps
pi1est_humans_given_chimps[1] 0.04737329# Let's overlap the two histograms
labels_h <- array("Human", dim = c(10304,1))
labels_c <- array("Shared (Human|Significant in Chimps)", dim = c(as.data.frame(qqplot_inc_day23[[3]][1]),1))
chimps <- cbind(labels_c, shared_p_values_gen)
colnames(chimps) <- c("Species", "pval")
humans <- cbind(labels_h, human_p_values_gen)
colnames(humans) <- c("Species", "pval")
# Combine the two
all_pval <- rbind(humans[,1:2], chimps[,1:2])
pal <- c("#00A4F4", "white")
p7_inc_05 <- ggplot(all_pval, aes(pval, fill = Species)) + scale_fill_manual(values=pal[1:2]) +
geom_density(show.legend = F, alpha = 1) +
scale_x_continuous(limits = c(0,1), breaks = seq(0,1,0.25)) + scale_y_continuous(labels=scaleFUN) +
theme_bw() + labs(title = "Day 2 to 3") + theme(plot.title = element_text(face = "bold")) +
geom_hline(yintercept = pi0est_humans_given_chimps, size = 2.5) + labs(x = "Unadjusted p-values") + labs(y = "Density") +
geom_hline(yintercept = pi0est_humans, size = 2.5, color = "#00A4F4") +
annotate("text", label= 'bold(bolditalic(hat(pi)[0][", humans"])=="0.85")', parse=TRUE, x=0.25, y=(pi0est_humans+0.05), colour = "#00A4F4", size = 6) + annotate("text", label = 'bold(bolditalic(hat(pi)[0][", shared"])=="0.95")', parse=TRUE, x=0.25, y=(pi0est_humans_given_chimps+0.07), size = 6)
p7_inc_05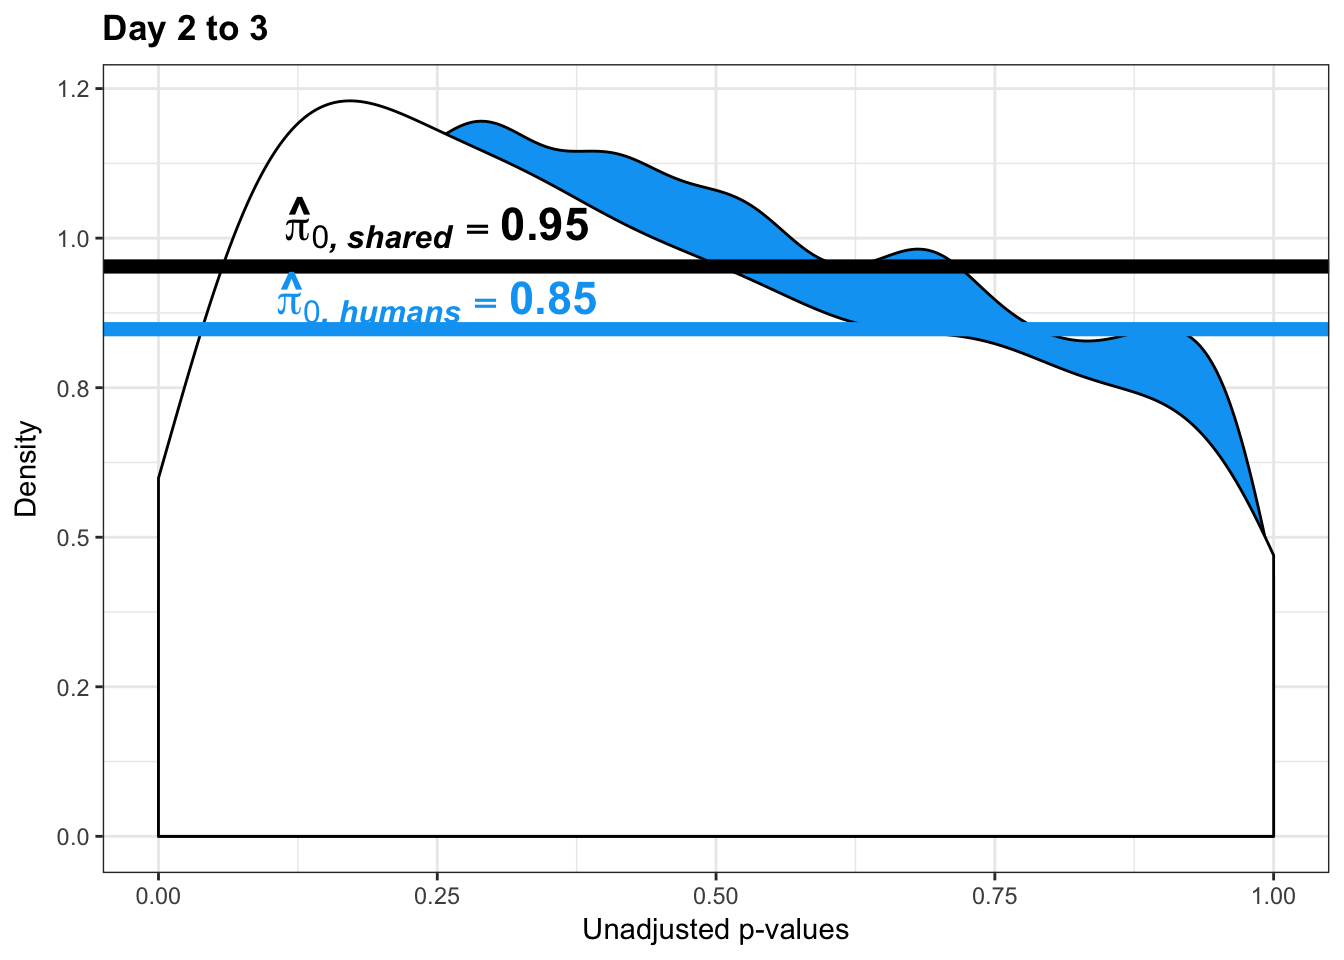
pval_h <- humans[,1:2]
pval_c <- chimps[,1:2]
pval_ch <- rbind(pval_h, pval_c)
resp <- rep(c("Day 2 to 3"), times = nrow(pval_c)+nrow(pval_h))
line1 <- as.data.frame(rep(c("0.95"), times = nrow(pval_h)))
colnames(line1) <- c("line")
line2 <- as.data.frame(rep(c("0.85"), times = nrow(pval_c)))
colnames(line2) <- c("line")
line <- rbind(line1, line2)
figS12A_fig <- cbind(pval_ch, resp, line)
figS12A <- rbind(figS12A, figS12A_fig)
#write.csv(figS12A, "/Users/laurenblake/Dropbox/Endoderm TC/Draft versions/Resubmit1_Genome Biology/Supplemental/Data_figS13D.csv", quote = FALSE, row.names = FALSE)
# Day 1 to 3
# Obtain pvalues
human_p_values_gen <- as.data.frame(qqplot_inc_day13[1])
shared_p_values_gen <- as.data.frame(qqplot_inc_day13[2])
# Pi_0 estimate for the humans
pi0est_humans <- qvalue(p= human_p_values_gen, pi0.method="smoother", fdr.level=NULL, robust=TRUE)$pi0
pi0est_humans[1] 0.203399# Pi_1 estimate for the humans
pi1est_humans <- 1 - pi0est_humans
pi1est_humans[1] 0.796601# Pi_0 estimate for the chimps given significant in the humans
pi0est_humans_given_chimps <- qvalue(p=shared_p_values_gen, pi0.method="smoother", fdr.level=NULL, robust=TRUE)$pi0
pi0est_humans_given_chimps[1] 0.177843# Pi_1 estimate for the humans
pi1est_humans_given_chimps <- 1 - pi0est_humans_given_chimps
pi1est_humans_given_chimps[1] 0.822157# Let's overlap the two histograms
labels_h <- array("Human", dim = c(10304,1))
labels_c <- array("Shared (Human|Significant in Chimps)", dim = c(as.data.frame(qqplot_inc_day13[[3]][1]),1))
chimps <- cbind(labels_c, shared_p_values_gen)
colnames(chimps) <- c("Species", "pval")
humans <- cbind(labels_h, human_p_values_gen)
colnames(humans) <- c("Species", "pval")
# Combine the two
all_pval <- rbind(humans[,1:2], chimps[,1:2])
pal <- c("#00A4F4", "white")
p8_inc_05 <- ggplot(all_pval, aes(pval, fill = Species)) + scale_fill_manual(values=pal[1:2]) +
geom_density(show.legend = F, alpha = 1) +
scale_x_continuous(limits = c(0,1), breaks = seq(0,1,0.25)) + scale_y_continuous(labels=scaleFUN) +
theme_bw() + labs(title = "Day 1 to 3") + theme(plot.title = element_text(face = "bold")) +
geom_hline(yintercept = pi0est_humans_given_chimps, size = 2.5) + labs(x = "Unadjusted p-values") + labs(y = "Density") + geom_hline(yintercept = pi0est_humans, size = 2.5, color = "#00A4F4") +
annotate("text", label= 'bold(bolditalic(hat(pi)[0][", humans"])=="0.20")', parse=TRUE, x=0.2, y=(pi0est_humans+0.3), colour = "#00A4F4", size = 6) + annotate("text", label = 'bold(bolditalic(hat(pi)[0][", shared"])=="0.18")', parse=TRUE, x=0.2, y=(pi0est_humans_given_chimps+0.16), size = 6)
p8_inc_05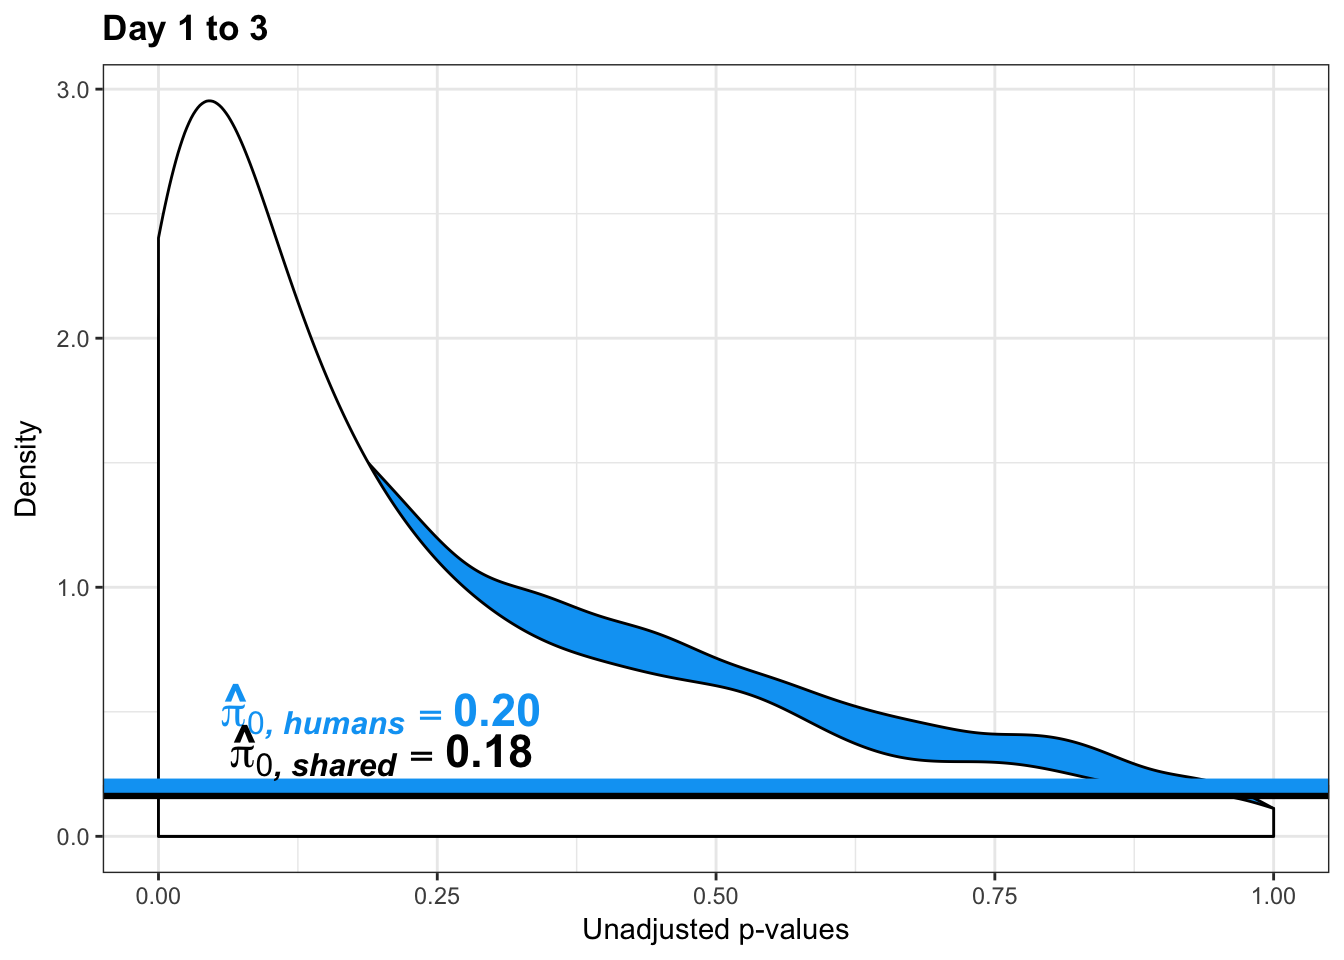
pval_h <- humans[,1:2]
pval_c <- chimps[,1:2]
pval_ch <- rbind(pval_h, pval_c)
resp <- rep(c("Day 1 to 3"), times = nrow(pval_c)+nrow(pval_h))
line1 <- as.data.frame(rep(c("0.20"), times = nrow(pval_h)))
colnames(line1) <- c("line")
line2 <- as.data.frame(rep(c("0.18"), times = nrow(pval_c)))
colnames(line2) <- c("line")
line <- rbind(line1, line2)
figS12A_fig <- cbind(pval_ch, resp, line)
figS12A <- rbind(figS12A, figS12A_fig)
multiplot(p1_inc_05,p5_inc_05,p2_inc_05,p6_inc_05,p3_inc_05,p7_inc_05,p4_inc_05,p8_inc_05,cols=4)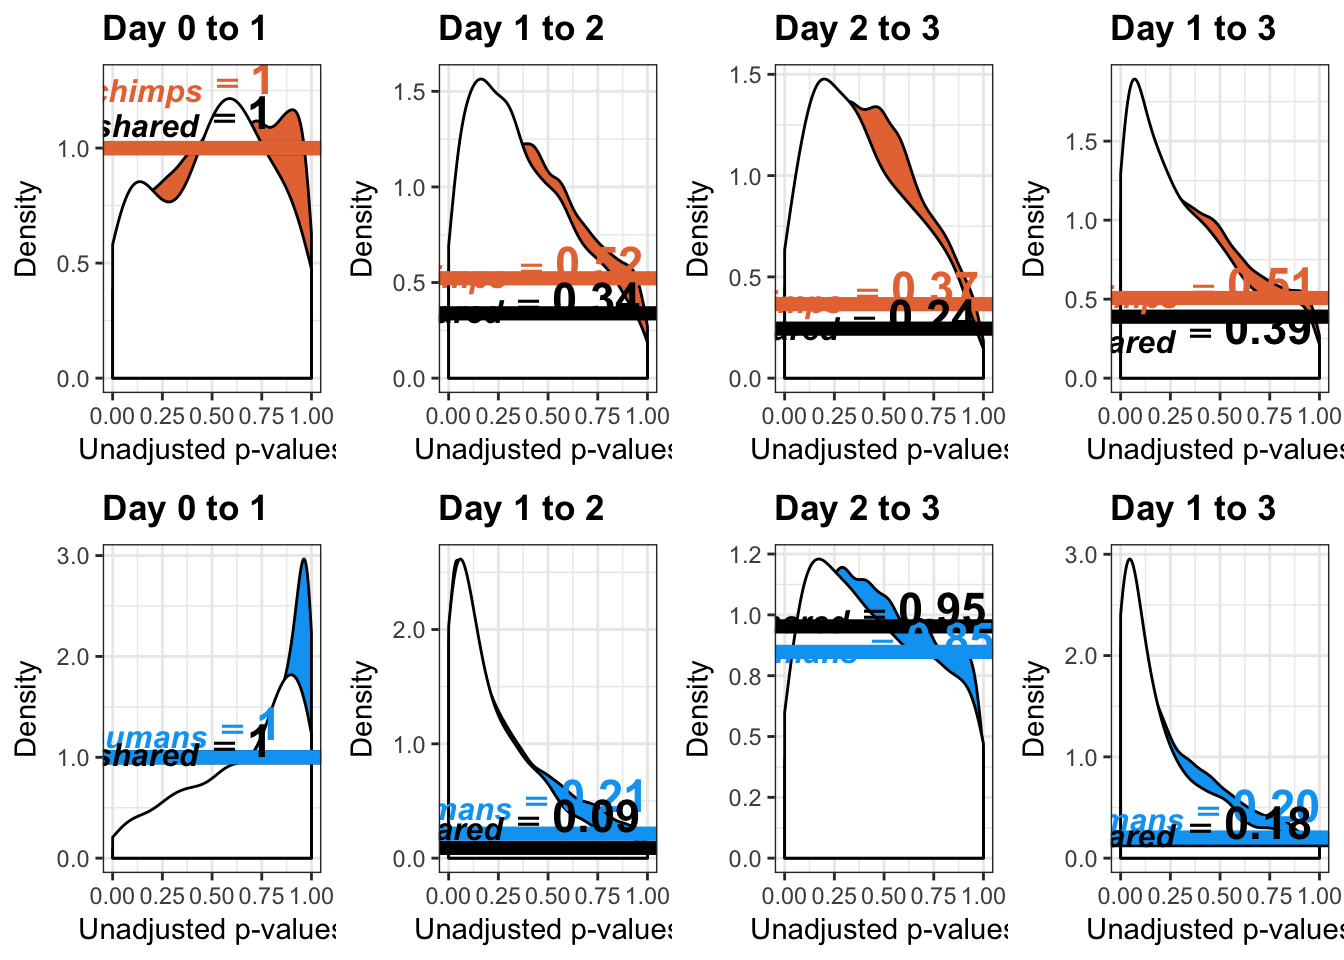
Permutation tests (This code should not be run on a laptop computer. Use a HPC instead. For sample results, see Supplemental Data S15 of the Endoderm paper)
Permutation test to find the null hypothesis of sharing (reduction in chimps | significant in humans for day 0 to 1 with p-value cutoff of 0.05)
### library
#library("picante")
### Make a matrix of the p-values ###
# Chimp p-values
#chimp_var_pval <- array(NA, dim = c(10304, 1))
#for(i in 1:10304){
# x <- t(mean_tech_reps[i,7:10])
# y <- t(mean_tech_reps[i,17:20])
# htest <- var.test(x, y, alternative = c("greater"))
# chimp_var_pval[i,1] <- htest$p.value
#}
# Human p-values
#human_var_pval <- array(NA, dim = c(10304, 1))
#for(i in 1:10304){
# x <- t(mean_tech_reps[i,1:6])
# y <- t(mean_tech_reps[i,11:16])
# htest <- var.test(x, y, alternative = c("greater"))
# human_var_pval[i,1] <- htest$p.value
# }
### Matrix for the permuation values
#shared_p0_given_permutation <- array(NA, dim = c(100000, 1))
### Randomize chimp p-values ###
#for(i in 1:100000){
#out_p_val <- randomizeMatrix(chimp_var_pval, null.model = "frequency",iterations = 1000)
#var_pval <- as.data.frame(cbind(out_p_val, human_var_pval))
#rownames(var_pval) <- rownames(mean_tech_reps)
#colnames(var_pval) <- c("Chimpanzee", "Human")
#summary(var_pval)
# Set p-value
#p_val <- 0.05
# P-val < 0.05 for chimps only
# num_var_pval_chimps <- var_pval[ which(var_pval[,1] < p_val), ]
# P-val < 0.05 for humans only
# num_var_pval_humans <- var_pval[ which(var_pval[,2] < p_val), ]
# Run for the shared
# Find the p-values of the chimps given that it was significant in the humans
# subset_var <- as.data.frame(var_pval[ which(var_pval[,2] < p_val), 1:2])
# num_var_pval_chimp_given_human_no_df <- subset_var[,1]
# num_var_pval_chimp_given_human <- as.data.frame(subset_var[,1])
### Find the Pi_0 estimate for the chimps given significant in the humans
# Obtain pvalues
#chimp_p_values_gen <- as.data.frame(num_var_pval_chimps)
#shared_p_values_gen <- as.data.frame(num_var_pval_chimp_given_human)
# Pi_0 estimate for the chimps given significant in the humans
#pi0est_chimps_given_humans <- qvalue(p=shared_p_values_gen, pi0.method="smoother", fdr.level=NULL, robust=TRUE)$pi0
#shared_p0_given_permutation[i,1] <- pi0est_chimps_given_humans
#print(i)
#}
#exp_p1 <- 1-mean(shared_p0_given_permutation)
#exp_p1
#sd_p1 <- sd(1-shared_p0_given_permutation)
#1-pnorm(0.47, exp_p1, sd_p1)Permutation test to find the null hypothesis of sharing (reduction in humans | significant in chimps for day 0 to 1 with p-value cutoff of 0.05)
### Now do the same thing but with humans given significant in chimps
### Make a matrix of the p-values ###
# Chimp p-values
#chimp_var_pval <- array(NA, dim = c(10304, 1))
#for(i in 1:10304){
# x <- t(mean_tech_reps[i,7:10])
# y <- t(mean_tech_reps[i,17:20])
# htest <- var.test(x, y, alternative = c("greater"))
# chimp_var_pval[i,1] <- htest$p.value
# }
# Human p-values
# human_var_pval <- array(NA, dim = c(10304, 1))
#for(i in 1:10304){
# x <- t(mean_tech_reps[i,1:6])
# y <- t(mean_tech_reps[i,11:16])
# htest <- var.test(x, y, alternative = c("greater"))
# human_var_pval[i,1] <- htest$p.value
# }
### Matrix for the permuation values
# shared_p0_given_permutation_human <- array(NA, dim = c(100000, 1))
### Randomize chimp p-values ###
# for(i in 1:100000){
# out_p_val <- randomizeMatrix(human_var_pval,null.model = "frequency",iterations = 1000)
# var_pval <- as.data.frame(cbind(out_p_val, chimp_var_pval))
# rownames(var_pval) <- rownames(mean_tech_reps)
# colnames(var_pval) <- c("Human", "Chimpanzee")
# summary(var_pval)
# Set p-value
# p_val <- 0.05
# P-val < 0.05 for chimps only
# num_var_pval_humans <- var_pval[ which(var_pval[,1] < p_val), ]
# P-val < 0.05 for humans only
# num_var_pval_chimps <- var_pval[ which(var_pval[,2] < p_val), ]
# Run for the shared
# Find the p-values of the humans given that it was significant in the chimps
# subset_var <- as.data.frame(var_pval[ which(var_pval[,2] < p_val), 1:2])
# num_var_pval_human_given_chimp_no_df <- subset_var[,1]
# num_var_pval_human_given_chimp <- as.data.frame(subset_var[,1])
### Find the Pi_0 estimate for the humans given significant in the chimps
# Obtain pvalues
# shared_p_values_gen <- as.data.frame(num_var_pval_human_given_chimp)
# Pi_0 estimate for the humans given significant in the chimps
# pi0est_humans_given_chimps <- qvalue(p=shared_p_values_gen, pi0.method="smoother", fdr.level=NULL, robust=TRUE)$pi0
# shared_p0_given_permutation_human[i,1] <- pi0est_humans_given_chimps
# print(i)
# }
# comp_mean <- 1-mean(shared_p0_given_permutation_human)
# comp_mean
# sd_human <- 1-shared_p0_given_permutation_human
# 1-pnorm(0.84, comp_mean, sd(sd_human))Estimates of pi0 and pi1 for reduction of variation in chimps conditioned on significance in humans (p = 0.01)
Changes in variance in chimp samples (p-value cutoff 0.01)
# Reduction in variance from day 0 to day 1 chimps
qqplot_red_day01 <- find_qqplot_red_chimps(7,10,17,20,1,6,11,16, 0.01)

# Reduction in variance from day 1 to day 2 chimps
qqplot_red_day12 <- find_qqplot_red_chimps(17,20,27,30,11,16,21,26, 0.01)

# Reduction in variance from day 2 to day 3 chimps
qqplot_red_day23 <- find_qqplot_red_chimps(27,30,37,40,21,26,31,36, 0.01)
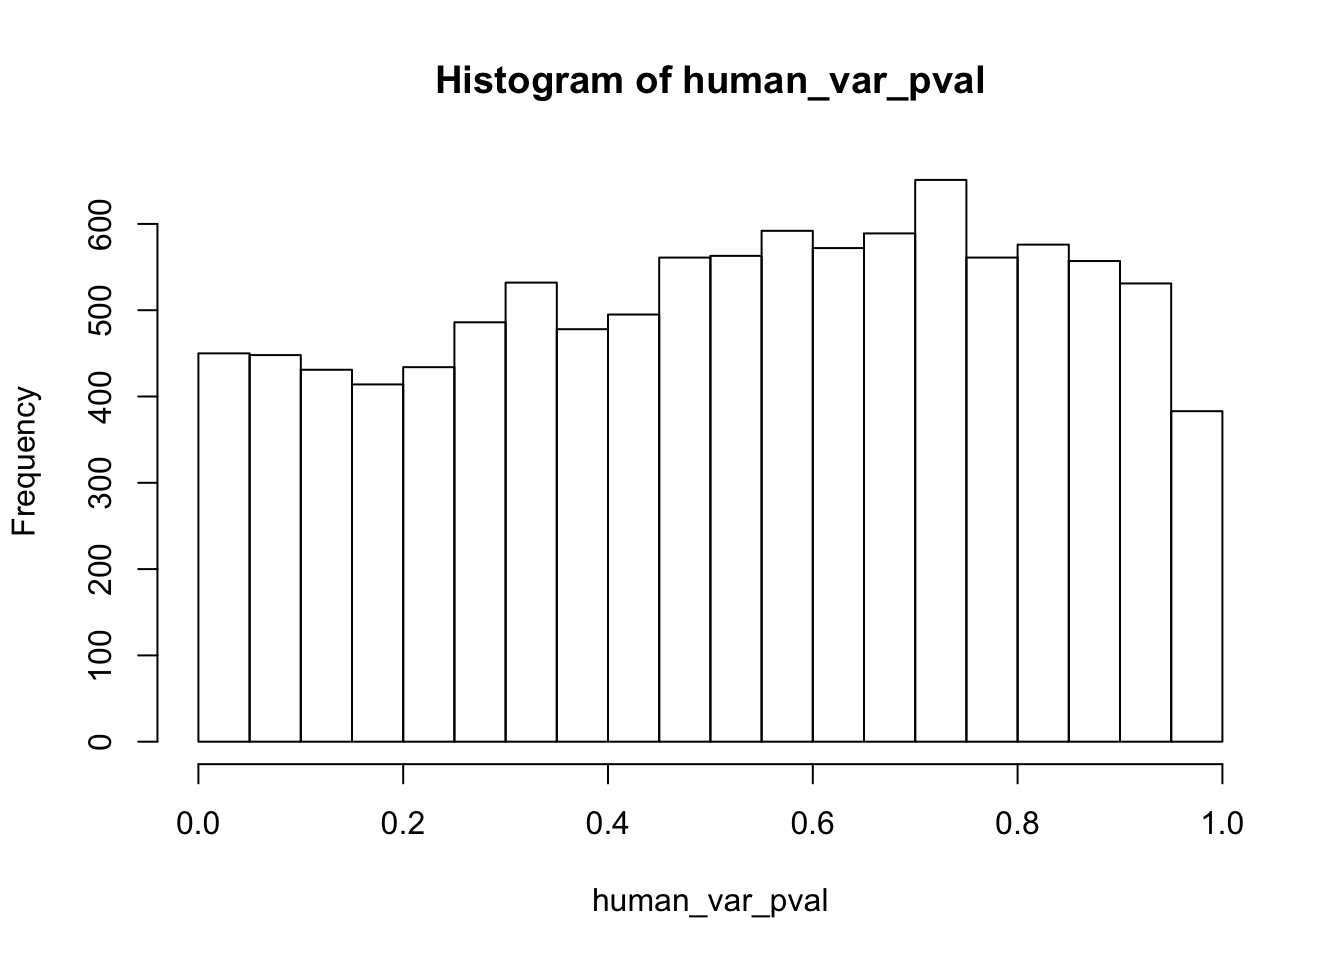
# Reduction in variance from day 0 to day 2 chimps
qqplot_red_day02 <- find_qqplot_red_chimps(7,10,27,30,1,6,21,26, 0.01)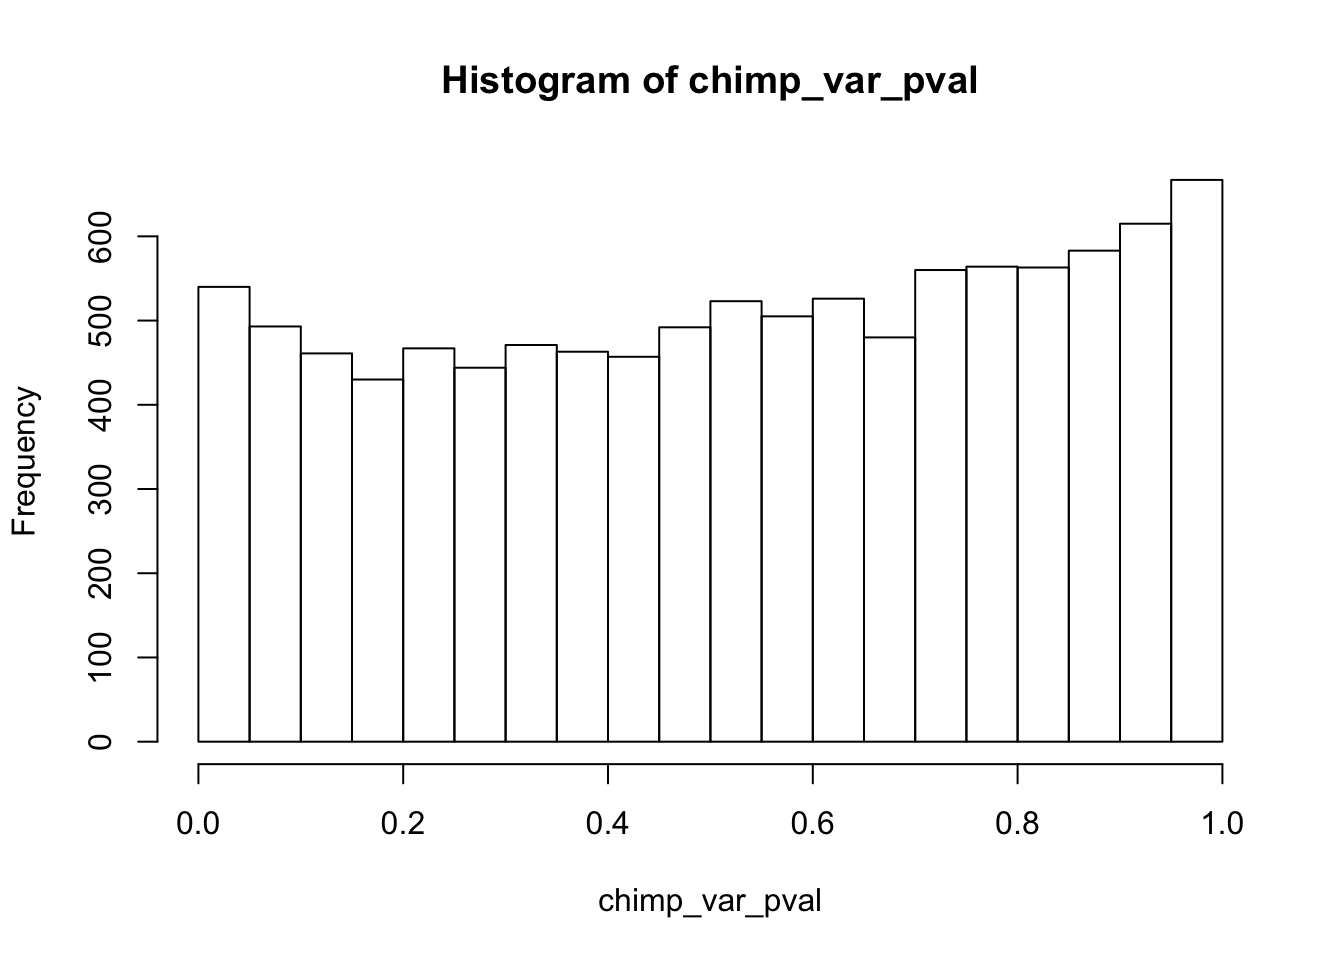
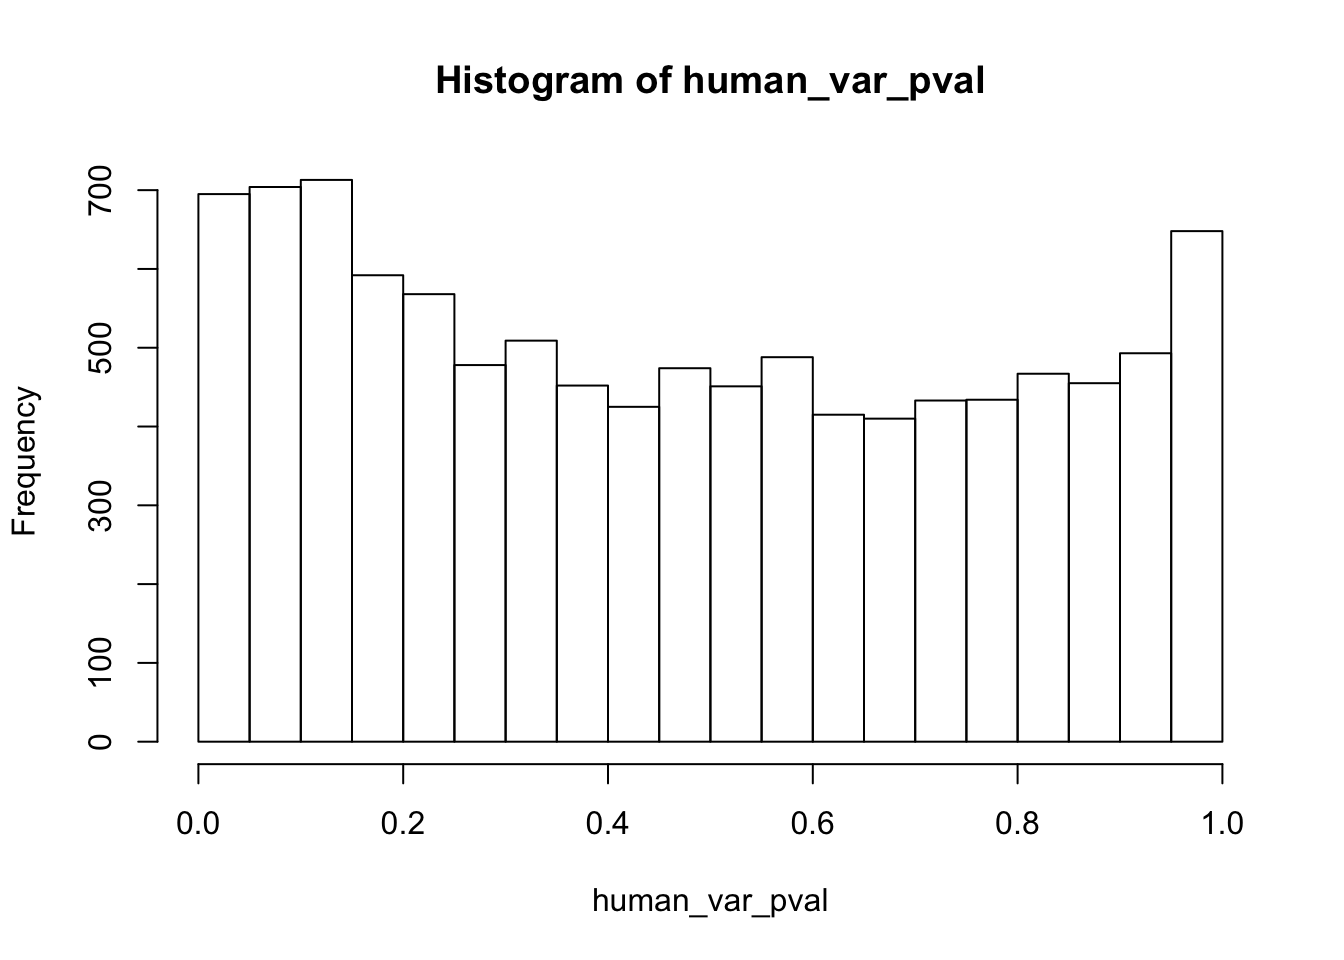
# Reduction in variance from day 1 to day 3 chimps
qqplot_red_day13 <- find_qqplot_red_chimps(17,20,37,40,11,16,31,36, 0.01)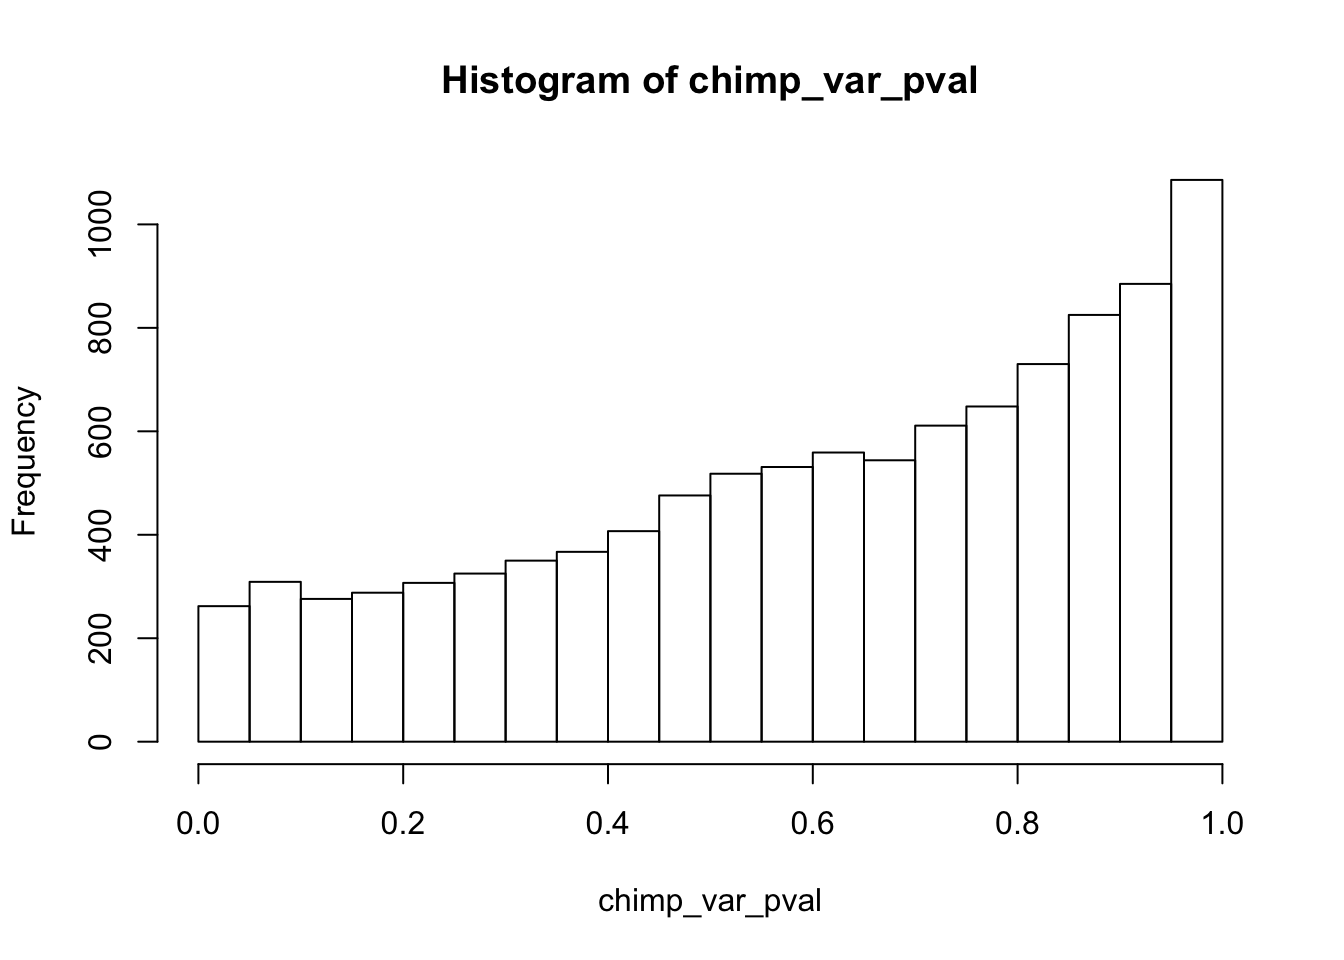

# Inc. in variance from day 0 to day 1
qqplot_inc_day01 <- find_qqplot_inc_chimps(7,10,17,20,1,6,11,16, 0.01)

# Inc. in variance from day 1 to day 2
qqplot_inc_day12 <- find_qqplot_inc_chimps(17,20,27,30,11,16,21,26, 0.01)

# Inc. in variance from day 2 to day 3
qqplot_inc_day23 <- find_qqplot_inc_chimps(27,30,37,40,21,26,31,36, 0.01)

# Inc. in variance from day 0 to day 2
qqplot_inc_day02 <- find_qqplot_inc_chimps(7,10,27,30,1,6,21,26, 0.01)

# Inc. in variance from day 1 to day 3
qqplot_inc_day13 <- find_qqplot_inc_chimps(17,20,37,40,11,16,31,36, 0.01)

Estimates of pi0 and pi1 for reduction of variation in chimps conditioned on significance in humans (p = 0.01)
library("qvalue")
################ REDUCTION IN VARIATION FOR CHIMPS (p = 0.01) ################
# Day 0 to 1
# Obtain pvalues
chimp_p_values_gen <- as.data.frame(qqplot_red_day01[1])
shared_p_values_gen <- as.data.frame(qqplot_red_day01[2])
# Pi_0 estimate for the chimps
pi0est_chimps <- qvalue(p=chimp_p_values_gen, pi0.method="smoother", fdr.level=NULL, robust=TRUE)$pi0
pi0est_chimps[1] 0.7259161# Pi_1 estimate for the chimps
pi1est_chimps <- 1 - pi0est_chimps
pi1est_chimps[1] 0.2740839# Pi_0 estimate for the chimps given significant in the humans
pi0est_chimps_given_humans <- qvalue(p=shared_p_values_gen, pi0.method="smoother", fdr.level=NULL, robust=TRUE)$pi0
pi0est_chimps_given_humans[1] 0.4760713# Pi_1 estimate for the humans
pi1est_chimps_given_humans <- 1 - pi0est_chimps_given_humans
pi1est_chimps_given_humans[1] 0.5239287# Let's overlap the two histograms
labels_c <- array("Chimpanzee", dim = c(10304,1))
labels_h <- array("Shared (Chimpanzee|Significant in Humans)", dim = c(as.data.frame(qqplot_red_day01[[3]][2]),1))
chimps <- cbind(labels_c, chimp_p_values_gen)
colnames(chimps) <- c("Species", "pval")
humans <- cbind(labels_h, shared_p_values_gen)
colnames(humans) <- c("Species", "pval")
# Combine the two
all_pval <- rbind(chimps[,1:2], humans[,1:2])
pal <- c("#00A4F4", "#E77642", "white")
p1_01 <- ggplot(all_pval, aes(pval, fill = Species)) + scale_fill_manual(values=pal[2:3]) +
geom_density(show.legend = F, alpha = 1) +
scale_x_continuous(limits = c(0,1), breaks = seq(0,1,0.25)) +
theme_bw() + labs(title = "Day 0 to 1") + theme(plot.title = element_text(face = "bold")) + labs(x = "Unadjusted p-values") + labs(y = "Density") +
geom_hline(yintercept = pi0est_chimps_given_humans, size = 2.5) +
geom_hline(yintercept = pi0est_chimps, size = 2.5, color = "#E77642") +
annotate("text", label= 'bold(bolditalic(hat(pi)[0][", chimps"])=="0.73")', parse=TRUE, x=0.2, y=(pi0est_chimps+0.07), colour = "#E77642", size = 6) + annotate("text", label = 'bold(bolditalic(hat(pi)[0][", shared"])=="0.48")', parse=TRUE, x=0.2, y=(pi0est_chimps_given_humans+0.07), size = 6)
p1_01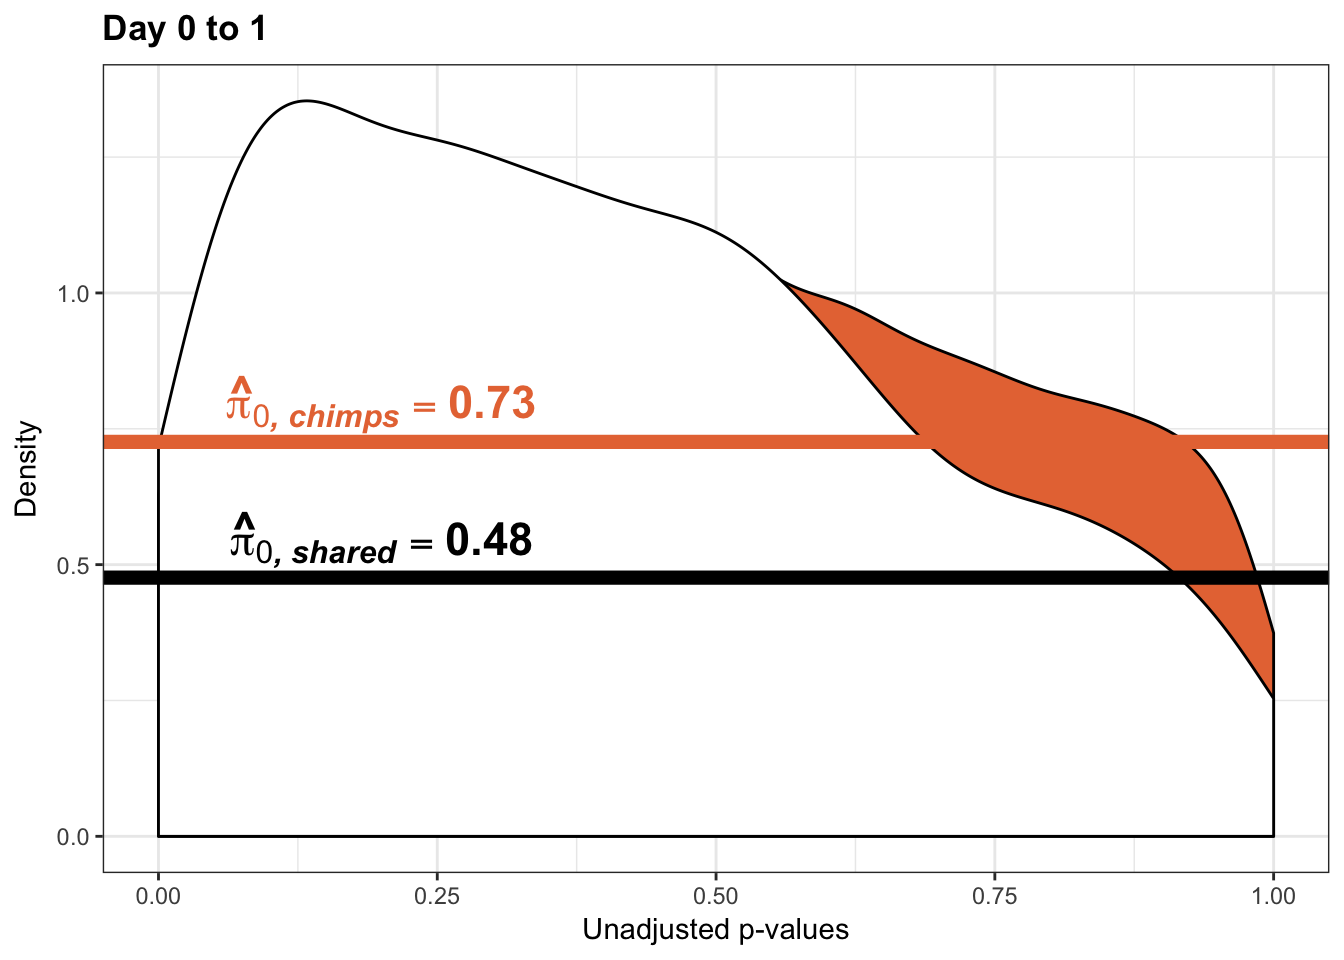
pval_c <- chimps[,1:2]
pval_h <- humans[,1:2]
pval_ch <- rbind(pval_c, pval_h)
resp <- rep(c("Days 0 to 1"), times = nrow(pval_c)+nrow(pval_h))
line1 <- as.data.frame(rep(c("0.73"), times = nrow(pval_c)))
colnames(line1) <- c("line")
line2 <- as.data.frame(rep(c("0.48"), times = nrow(pval_h)))
colnames(line2) <- c("line")
line <- rbind(line1, line2)
figS12A <- cbind(pval_ch, resp, line)
# Day 1 to 2
# Obtain pvalues
chimp_p_values_gen <- as.data.frame(qqplot_red_day12[1])
shared_p_values_gen <- as.data.frame(qqplot_red_day12[2])
labels_c <- array("Chimpanzee", dim = c(10304,1))
labels_h <- array("Shared (Chimpanzee|Significant in Humans)", dim = c(as.data.frame(qqplot_red_day12[[3]][2]),1))
chimps <- cbind(labels_c, chimp_p_values_gen)
colnames(chimps) <- c("Species", "pval")
humans <- cbind(labels_h, shared_p_values_gen)
colnames(humans) <- c("Species", "pval")
# Combine the two
all_pval <- rbind(chimps[,1:2], humans[,1:2])
pal <- c("#00A4F4", "#E77642", "white")
p1_01 <- ggplot(all_pval, aes(pval, fill = Species)) + scale_fill_manual(values=pal[2:3]) +
geom_density(show.legend = F, alpha = 1) +
scale_x_continuous(limits = c(0,1), breaks = seq(0,1,0.25)) +
theme_bw() + labs(title = "Days 1 to 2") + theme(plot.title = element_text(face = "bold")) + labs(x = "Unadjusted p-values") + labs(y = "Density")
p1_01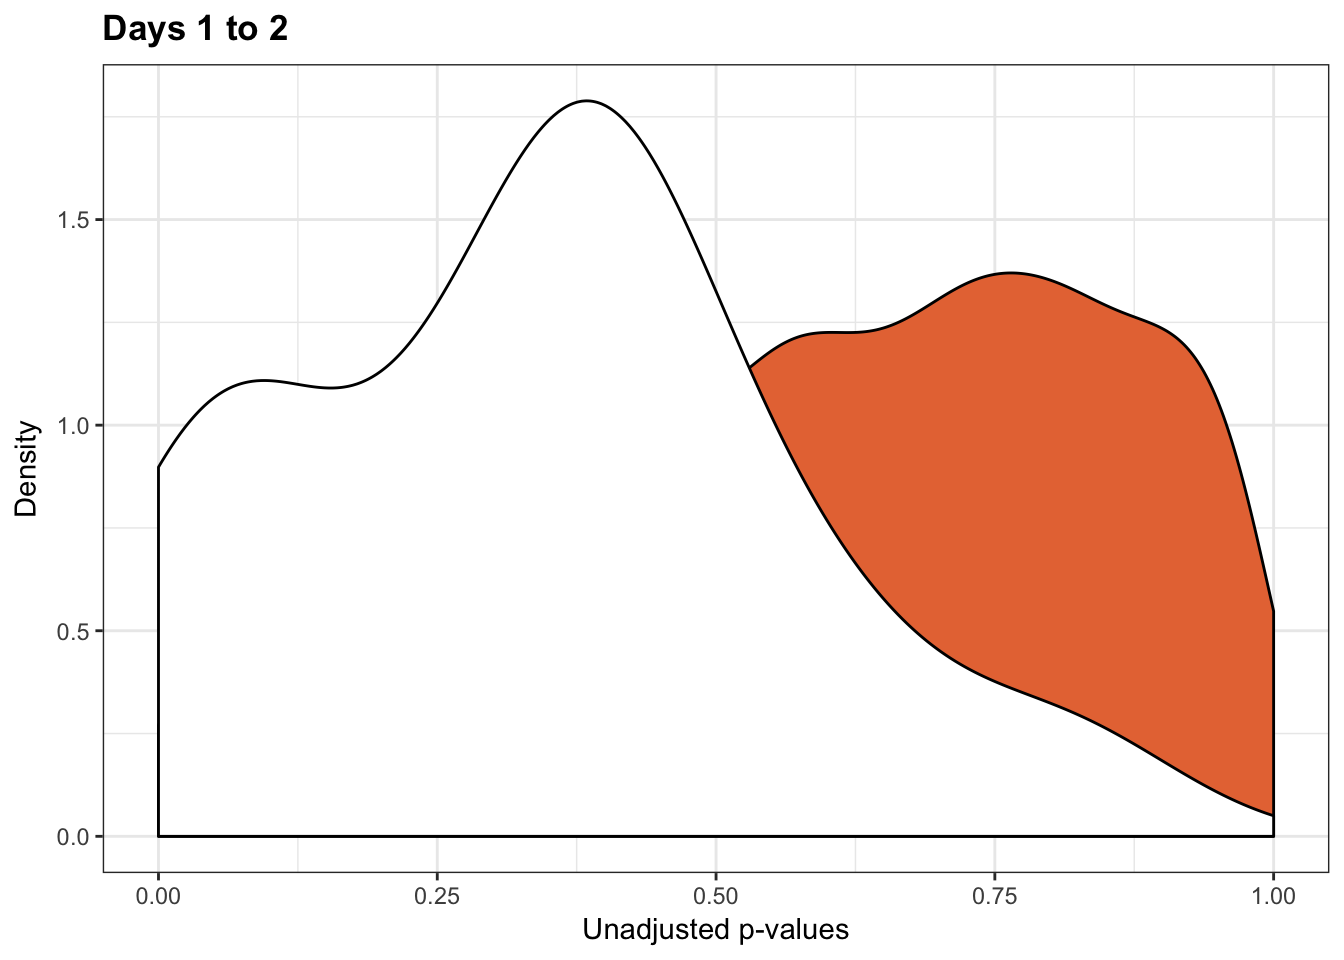
pval_c <- chimps[,1:2]
pval_h <- humans[,1:2]
pval_ch <- rbind(pval_c, pval_h)
resp <- rep(c("Days 1 to 2"), times = nrow(pval_c)+nrow(pval_h))
line1 <- as.data.frame(rep(c("NA"), times = nrow(pval_c)))
colnames(line1) <- c("line")
line2 <- as.data.frame(rep(c("NA"), times = nrow(pval_h)))
colnames(line2) <- c("line")
line <- rbind(line1, line2)
figS12A_fig <- cbind(pval_ch, resp, line)
figS12A <- rbind(figS12A, figS12A_fig)
# Pi_0 estimate for the chimps
pi0est_chimps <- qvalue(p=chimp_p_values_gen, pi0.method="smoother", fdr.level=NULL, robust=TRUE)$pi0
pi0est_chimps[1] 1# Pi_1 estimate for the chimps
pi1est_chimps <- 1 - pi0est_chimps
pi1est_chimps[1] 0# Pi_0 estimate for the chimps given significant in the humans
# pi0est_chimps_given_humans <- qvalue(p=shared_p_values_gen, pi0.method="smoother", fdr.level=NULL, robust=TRUE)$pi0
# Note: There's an issue with estimating pi_0 from only 15 points.
# Day 2 to 3
# Obtain pvalues
chimp_p_values_gen <- as.data.frame(qqplot_red_day23[1])
shared_p_values_gen <- as.data.frame(qqplot_red_day23[2])
# Pi_0 estimate for the chimps
pi0est_chimps <- qvalue(p=chimp_p_values_gen, pi0.method="smoother", fdr.level=NULL, robust=TRUE)$pi0
pi0est_chimps[1] 0.903342# Pi_1 estimate for the chimps
pi1est_chimps <- 1 - pi0est_chimps
pi1est_chimps[1] 0.09665802# Pi_0 estimate for the chimps given significant in the humans
pi0est_chimps_given_humans <- qvalue(p=shared_p_values_gen, pi0.method="smoother", fdr.level=NULL, robust=TRUE)$pi0
pi0est_chimps_given_humans[1] 1# Pi_1 estimate for the humans
pi1est_chimps_given_humans <- 1 - pi0est_chimps_given_humans
pi1est_chimps_given_humans[1] 0# Let's overlap the two histograms
labels_c <- array("Chimpanzee", dim = c(10304,1))
labels_h <- array("Shared (Chimpanzee|Significant in Humans)", dim = c(as.data.frame(qqplot_red_day23[[3]][2]),1))
chimps <- cbind(labels_c, chimp_p_values_gen)
colnames(chimps) <- c("Species", "pval")
humans <- cbind(labels_h, shared_p_values_gen)
colnames(humans) <- c("Species", "pval")
# Combine the two
all_pval <- rbind(chimps[,1:2], humans[,1:2])
pal <- c("#00A4F4", "#E77642", "white")
p3_01 <- ggplot(all_pval, aes(pval, fill = Species)) + scale_fill_manual(values=pal[2:3]) +
geom_density(show.legend = F, alpha = 1) +
scale_x_continuous(limits = c(0,1), breaks = seq(0,1,0.25)) +
theme_bw() + labs(title = "Day 2 to 3") + theme(plot.title = element_text(face = "bold")) + labs(x = "Unadjusted p-values") + labs(y = "Density") + scale_y_continuous(labels=scaleFUN) +
geom_hline(yintercept = pi0est_chimps_given_humans, size = 2.5) +
geom_hline(yintercept = pi0est_chimps, size = 2.5, color = "#E77642") +
annotate("text", label= 'bold(bolditalic(hat(pi)[0][", chimps"])=="0.9")', parse=TRUE, x=0.8, y=(pi0est_chimps-0.07), colour = "#E77642", size = 6) + annotate("text", label = 'bold(bolditalic(hat(pi)[0][", shared"])=="1")', parse=TRUE, x=0.8, y=(pi0est_chimps_given_humans+0.07), size = 6)
p3_01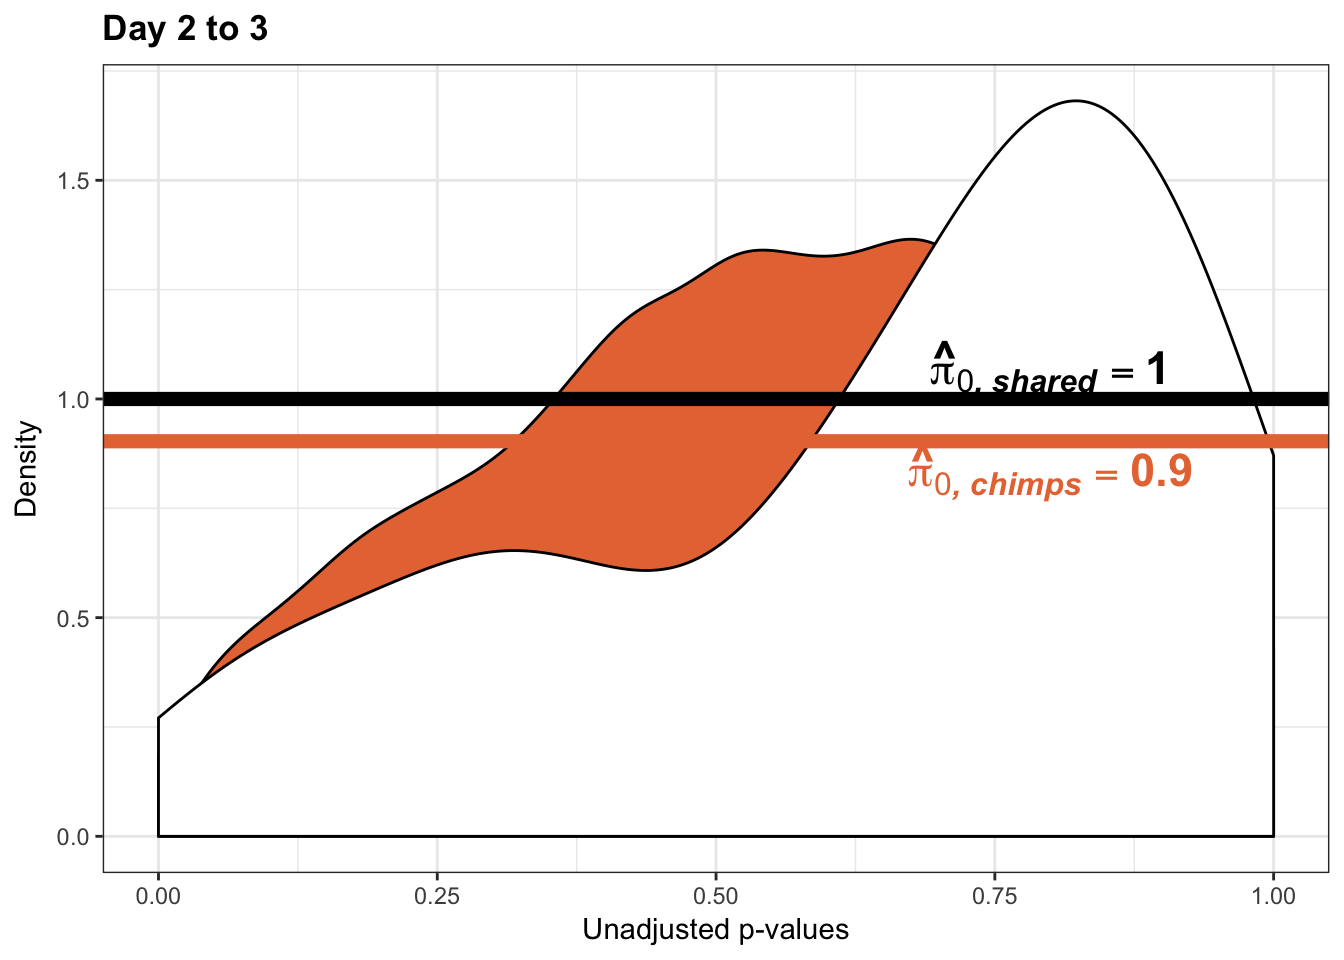
pval_c <- chimps[,1:2]
pval_h <- humans[,1:2]
pval_ch <- rbind(pval_c, pval_h)
resp <- rep(c("Days 2 to 3"), times = nrow(pval_c)+nrow(pval_h))
line1 <- as.data.frame(rep(c("NA"), times = nrow(pval_c)))
colnames(line1) <- c("line")
line2 <- as.data.frame(rep(c("NA"), times = nrow(pval_h)))
colnames(line2) <- c("line")
line <- rbind(line1, line2)
figS12A_fig <- cbind(pval_ch, resp, line)
figS12A <- rbind(figS12A, figS12A_fig)
# Day 1 to 3
# Obtain pvalues
chimp_p_values_gen <- as.data.frame(qqplot_red_day13[1])
shared_p_values_gen <- as.data.frame(qqplot_red_day13[2])
# Pi_0 estimate for the chimps
pi0est_chimps <- qvalue(p=chimp_p_values_gen, pi0.method="smoother", fdr.level=NULL, robust=TRUE)$pi0
pi0est_chimps[1] 1# Pi_1 estimate for the chimps
pi1est_chimps <- 1 - pi0est_chimps
pi1est_chimps[1] 0# Pi_0 estimate for the chimps given significant in the humans
pi0est_chimps_given_humans <- qvalue(p=shared_p_values_gen, pi0.method="smoother", fdr.level=NULL, robust=TRUE)$pi0
pi0est_chimps_given_humans[1] 1# Pi_1 estimate for the humans
pi1est_chimps_given_humans <- 1 - pi0est_chimps_given_humans
pi1est_chimps_given_humans[1] 0# Let's overlap the two histograms
labels_c <- array("Chimpanzee", dim = c(10304,1))
labels_h <- array("Shared (Chimpanzee|Significant in Humans)", dim = c(as.data.frame(qqplot_red_day13[[3]][2]),1))
chimps <- cbind(labels_c, chimp_p_values_gen)
colnames(chimps) <- c("Species", "pval")
humans <- cbind(labels_h, shared_p_values_gen)
colnames(humans) <- c("Species", "pval")
# Combine the two
all_pval <- rbind(chimps[,1:2], humans[,1:2])
pal <- c("#00A4F4", "#E77642", "white")
p4_01 <- ggplot(all_pval, aes(pval, fill = Species)) + scale_fill_manual(values=pal[2:3]) +
geom_density(show.legend = F, alpha = 1) +
scale_x_continuous(limits = c(0,1), breaks = seq(0,1,0.25)) +
theme_bw() + labs(title = "Day 1 to 3") + theme(plot.title = element_text(face = "bold")) + labs(x = "Unadjusted p-values") + labs(y = "Density") + scale_y_continuous(labels=scaleFUN) +
geom_hline(yintercept = pi0est_chimps_given_humans, size = 2.5) +
geom_hline(yintercept = pi0est_chimps, size = 2.5, color = "black") +
annotate("text", label= 'bold(bolditalic(hat(pi)[0][", chimps"])=="1")', parse=TRUE, x=0.2, y=(pi0est_chimps+0.2), colour = "#E77642", size = 6) + annotate("text", label = 'bold(bolditalic(hat(pi)[0][", shared"])=="1")', parse=TRUE, x=0.2, y=(pi0est_chimps_given_humans+0.07), size = 6)
p4_01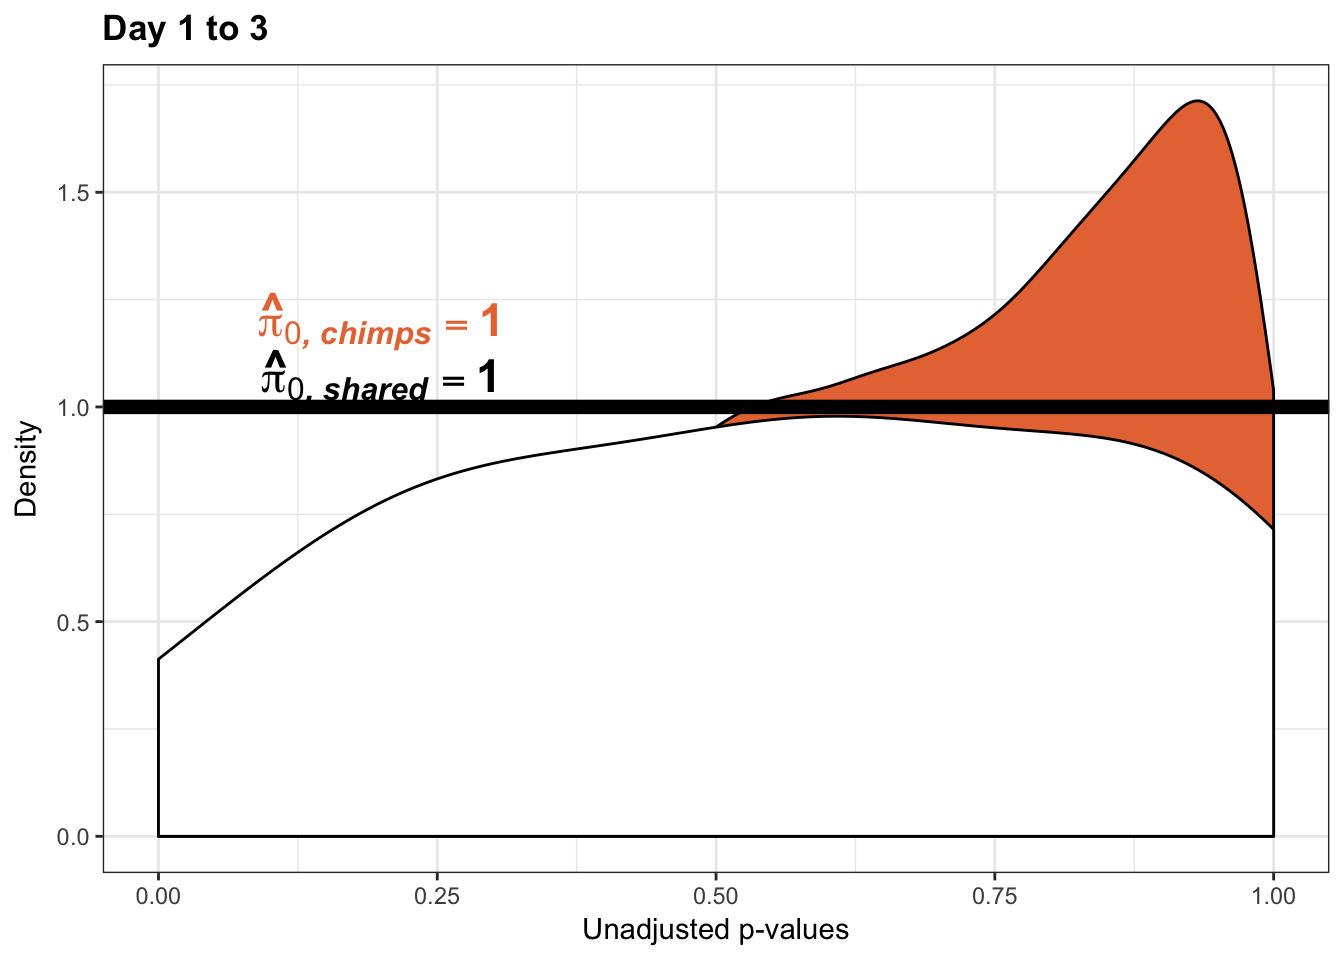
pval_c <- chimps[,1:2]
pval_h <- humans[,1:2]
pval_ch <- rbind(pval_c, pval_h)
resp <- rep(c("Days 1 to 3"), times = nrow(pval_c)+nrow(pval_h))
line1 <- as.data.frame(rep(c("NA"), times = nrow(pval_c)))
colnames(line1) <- c("line")
line2 <- as.data.frame(rep(c("NA"), times = nrow(pval_h)))
colnames(line2) <- c("line")
line <- rbind(line1, line2)
figS12A_fig <- cbind(pval_ch, resp, line)
figS12A <- rbind(figS12A, figS12A_fig)
write.csv(figS12A, "/Users/laurenblake/Dropbox/Endoderm TC/Draft versions/Resubmit1_Genome Biology/Supplemental/Data_figS14E_with_days12.csv", quote = FALSE, row.names = FALSE)Estimates of pi0 and pi1 for increase of variation in chimps conditioned on significance in humans (p = 0.01)
############### Increase in Variation ############
# Day 0 to 1
# Obtain pvalues
chimp_p_values_gen <- as.data.frame(qqplot_inc_day01[1])
shared_p_values_gen <- as.data.frame(qqplot_inc_day01[2])
# Pi_0 estimate for the chimps
#pi0est_chimps <- qvalue(p=chimp_p_values_gen, pi0.method="smoother", fdr.level=NULL, robust=TRUE)$pi0
#pi0est_chimps
# Pi_1 estimate for the chimps
#pi1est_chimps <- 1 - pi0est_chimps
#pi1est_chimps
# Pi_0 estimate for the chimps given significant in the humans
#pi0est_chimps_given_humans <- qvalue(p=shared_p_values_gen, pi0.method="smoother", fdr.level=NULL, robust=TRUE)$pi0
#pi0est_chimps_given_humans
# Pi_1 estimate for the humans
#pi1est_chimps_given_humans <- 1 - pi0est_chimps_given_humans
#pi1est_chimps_given_humans
# Let's overlap the two histograms
labels_c <- array("Chimpanzee", dim = c(10304,1))
labels_h <- array("Shared (Chimpanzee|Significant in Humans)", dim = c(nrow(shared_p_values_gen[1]),1))
chimps <- cbind(labels_c, chimp_p_values_gen)
colnames(chimps) <- c("Species", "pval")
humans <- cbind(labels_h, shared_p_values_gen)
colnames(humans) <- c("Species", "pval")
# Combine the two
all_pval <- rbind(chimps[,1:2], humans[,1:2])
pal <- c("#00A4F4", "#E77642", "white")
p1_inc_01 <- ggplot(all_pval, aes(pval, fill = Species)) + scale_fill_manual(values=pal[2:3]) +
geom_density(show.legend = F, alpha = 1) +
scale_x_continuous(limits = c(0,1), breaks = seq(0,1,0.25)) +
theme_bw() + labs(title = "Day 0 to 1") + theme(plot.title = element_text(face = "bold")) + labs(x = "Unadjusted p-values") + labs(y = "Density") + scale_y_continuous(labels=scaleFUN) +
geom_hline(yintercept = pi0est_chimps_given_humans, size = 2.5) +
geom_hline(yintercept = pi0est_chimps, size = 2.5, color = "#E77642") +
annotate("text", label= 'bold(bolditalic(hat(pi)[0][", chimps"])=="1")', parse=TRUE, x=0.2, y=(pi0est_chimps+0.07), colour = "#E77642", size = 6) + annotate("text", label = 'bold(bolditalic(hat(pi)[0][", shared"])=="0.80")', parse=TRUE, x=0.2, y=(pi0est_chimps_given_humans+0.07), size = 6)
p1_inc_01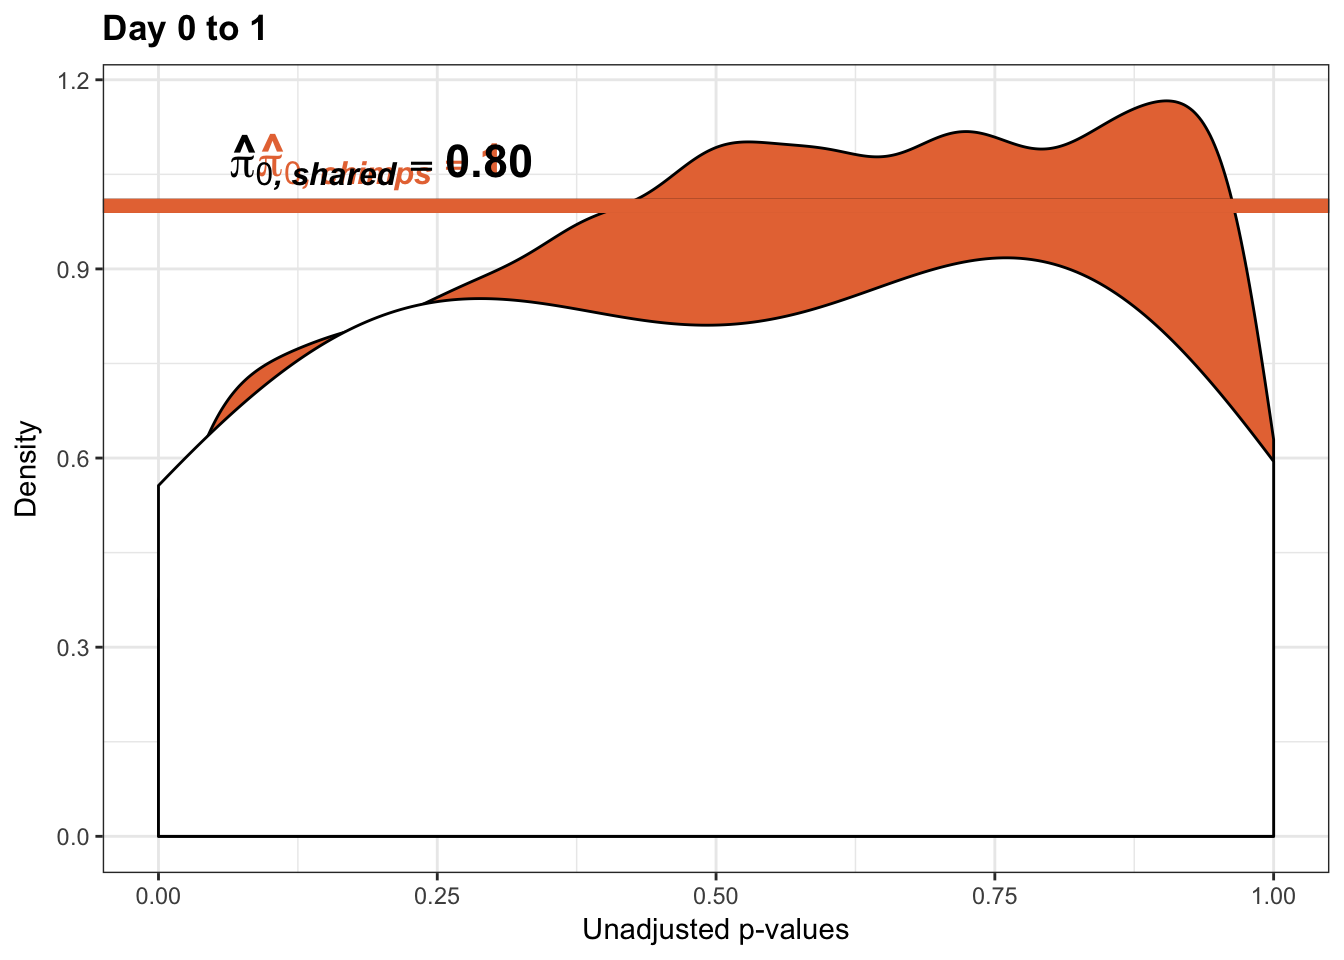
pval_c <- chimps[,1:2]
pval_h <- humans[,1:2]
pval_ch <- rbind(pval_c, pval_h)
resp <- rep(c("Days 0 to 1"), times = nrow(pval_c)+nrow(pval_h))
line1 <- as.data.frame(rep(c("NA"), times = nrow(pval_c)))
colnames(line1) <- c("line")
line2 <- as.data.frame(rep(c("NA"), times = nrow(pval_h)))
colnames(line2) <- c("line")
line <- rbind(line1, line2)
figS12A <- cbind(pval_ch, resp, line)# Day 1 to 2
# Obtain pvalues
chimp_p_values_gen <- as.data.frame(qqplot_inc_day12[1])
shared_p_values_gen <- as.data.frame(qqplot_inc_day12[2])
# Pi_0 estimate for the chimps
pi0est_chimps <- qvalue(p=chimp_p_values_gen, pi0.method="smoother", fdr.level=NULL, robust=TRUE)$pi0
pi0est_chimps[1] 0.5221613# Pi_1 estimate for the chimps
pi1est_chimps <- 1 - pi0est_chimps
pi1est_chimps[1] 0.4778387# Pi_0 estimate for the chimps given significant in the humans
pi0est_chimps_given_humans <- qvalue(p=shared_p_values_gen, pi0.method="smoother", fdr.level=NULL, robust=TRUE)$pi0
pi0est_chimps_given_humans[1] 0.448485# Pi_1 estimate for the humans
pi1est_chimps_given_humans <- 1 - pi0est_chimps_given_humans
pi1est_chimps_given_humans[1] 0.551515# Let's overlap the two histograms
labels_c <- array("Chimpanzee", dim = c(10304,1))
labels_h <- array("Shared (Chimpanzee|Significant in Humans)", dim = c(as.data.frame(qqplot_inc_day12[[3]][2]),1))
chimps <- cbind(labels_c, chimp_p_values_gen)
colnames(chimps) <- c("Species", "pval")
humans <- cbind(labels_h, shared_p_values_gen)
colnames(humans) <- c("Species", "pval")
# Combine the two
all_pval <- rbind(chimps[,1:2], humans[,1:2])
pal <- c("#00A4F4", "#E77642", "white")
p2_inc_01 <- ggplot(all_pval, aes(pval, fill = Species)) + scale_fill_manual(values=pal[2:3]) +
geom_density(show.legend = F, alpha = 1) +
scale_x_continuous(limits = c(0,1), breaks = seq(0,1,0.25)) +
theme_bw() + labs(title = "Day 1 to 2") + theme(plot.title = element_text(face = "bold")) + labs(x = "Unadjusted p-values") + labs(y = "Density") + scale_y_continuous(labels=scaleFUN) +
geom_hline(yintercept = pi0est_chimps_given_humans, size = 2.5) +
geom_hline(yintercept = pi0est_chimps, size = 2.5, color = "#E77642") +
annotate("text", label= 'bold(bolditalic(hat(pi)[0][", chimps"])=="0.52")', parse=TRUE, x=0.2, y=(pi0est_chimps+0.07), colour = "#E77642", size = 6) + annotate("text", label = 'bold(bolditalic(hat(pi)[0][", shared"])=="0.45")', parse=TRUE, x=0.2, y=(pi0est_chimps_given_humans-0.07), size = 6)
p2_inc_01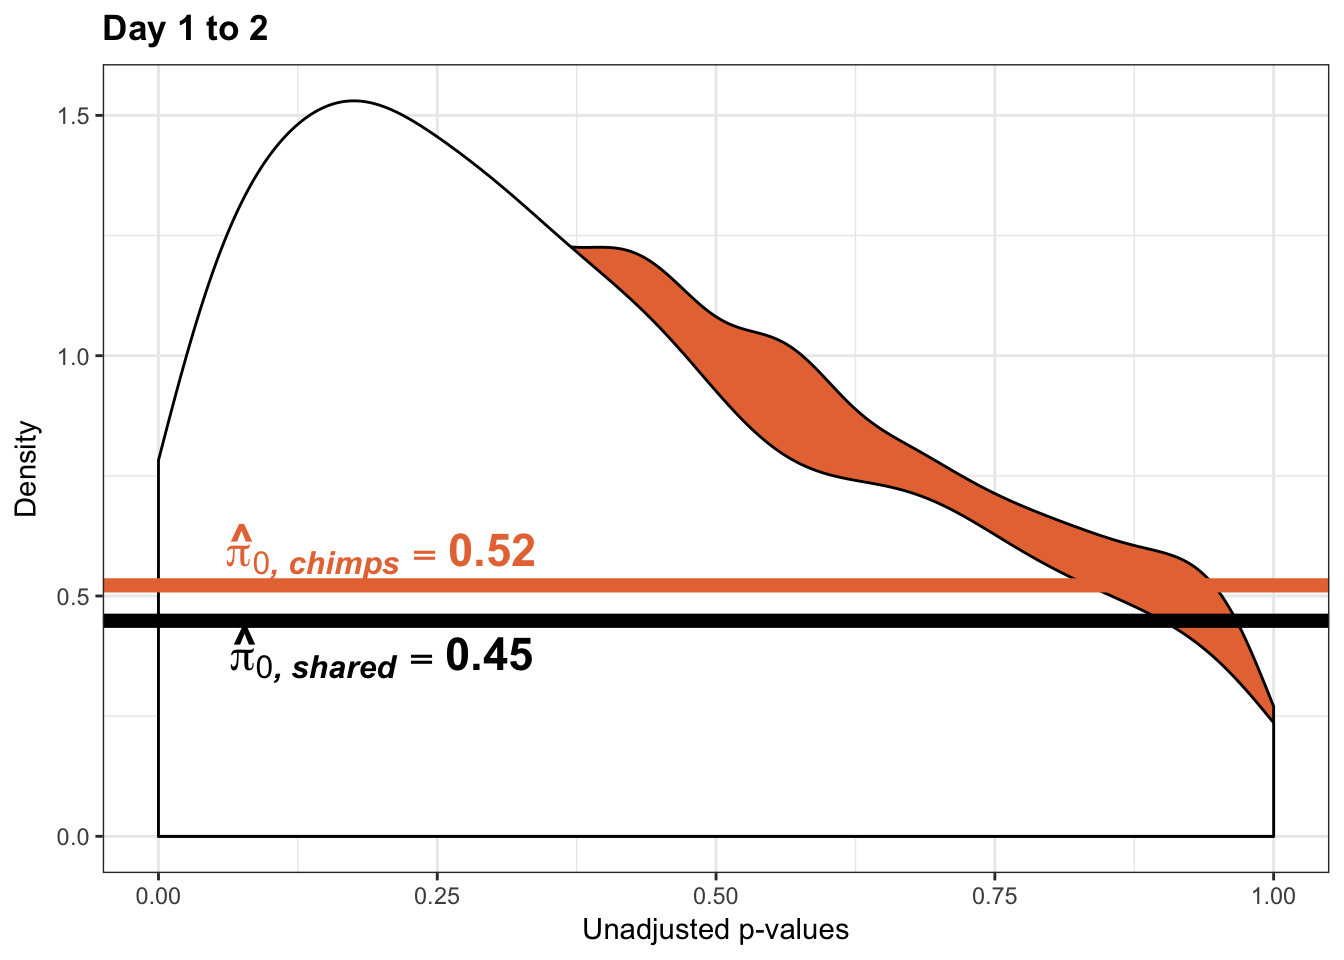
pval_c <- chimps[,1:2]
pval_h <- humans[,1:2]
pval_ch <- rbind(pval_c, pval_h)
resp <- rep(c("Days 1 to 2"), times = nrow(pval_c)+nrow(pval_h))
line1 <- as.data.frame(rep(c("0.52"), times = nrow(pval_c)))
colnames(line1) <- c("line")
line2 <- as.data.frame(rep(c("0.45"), times = nrow(pval_h)))
colnames(line2) <- c("line")
line <- rbind(line1, line2)
figS12A_fig <- cbind(pval_ch, resp, line)
figS12A <- rbind(figS12A, figS12A_fig)# Day 2 to 3
# Obtain pvalues
chimp_p_values_gen <- as.data.frame(qqplot_inc_day23[1])
shared_p_values_gen <- as.data.frame(qqplot_inc_day23[2])
# Pi_0 estimate for the chimps
pi0est_chimps <- qvalue(p=chimp_p_values_gen, pi0.method="smoother", fdr.level=NULL, robust=TRUE)$pi0
pi0est_chimps[1] 0.3652978# Pi_1 estimate for the chimps
pi1est_chimps <- 1 - pi0est_chimps
pi1est_chimps[1] 0.6347022# Pi_0 estimate for the chimps given significant in the humans
pi0est_chimps_given_humans <- qvalue(p=shared_p_values_gen, pi0.method="smoother", fdr.level=NULL, robust=TRUE)$pi0
pi0est_chimps_given_humans[1] 0.3625405# Pi_1 estimate for the humans
pi1est_chimps_given_humans <- 1 - pi0est_chimps_given_humans
pi1est_chimps_given_humans[1] 0.6374595# Let's overlap the two histograms
labels_c <- array("Chimpanzee", dim = c(10304,1))
labels_h <- array("Shared (Chimpanzee|Significant in Humans)", dim = c(as.data.frame(qqplot_inc_day23[[3]][2]),1))
chimps <- cbind(labels_c, chimp_p_values_gen)
colnames(chimps) <- c("Species", "pval")
humans <- cbind(labels_h, shared_p_values_gen)
colnames(humans) <- c("Species", "pval")
# Combine the two
all_pval <- rbind(chimps[,1:2], humans[,1:2])
pal <- c("#00A4F4", "#E77642", "white")
p3_inc_01 <- ggplot(all_pval, aes(pval, fill = Species)) + scale_fill_manual(values=pal[2:3]) +
geom_density(show.legend = F, alpha = 1) +
scale_x_continuous(limits = c(0,1), breaks = seq(0,1,0.25)) +
theme_bw() + labs(title = "Day 2 to 3") + theme(plot.title = element_text(face = "bold")) + labs(x = "Unadjusted p-values") + labs(y = "Density") + scale_y_continuous(labels=scaleFUN) +
geom_hline(yintercept = pi0est_chimps_given_humans, size = 2.5) +
geom_hline(yintercept = pi0est_chimps, size = 2.5, color = "#E77642") +
annotate("text", label= 'bold(bolditalic(hat(pi)[0][", chimps"])=="0.37")', parse=TRUE, x=0.2, y=(pi0est_chimps+0.15), colour = "#E77642", size = 6) + annotate("text", label = 'bold(bolditalic(hat(pi)[0][", shared"])=="0.36")', parse=TRUE, x=0.2, y=(pi0est_chimps_given_humans+0.07), size = 6)
p3_inc_01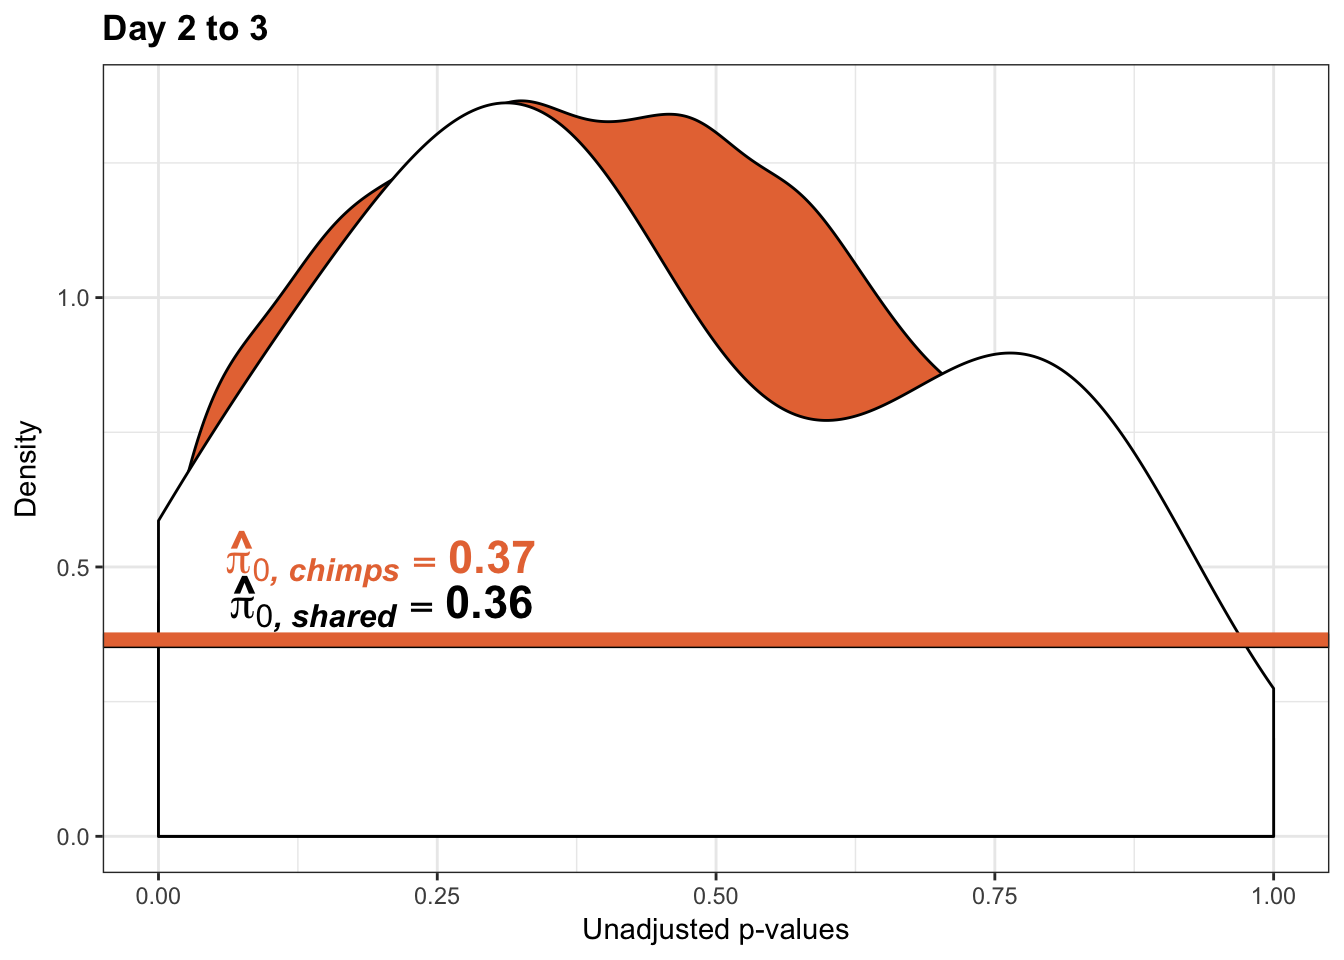
pval_c <- chimps[,1:2]
pval_h <- humans[,1:2]
pval_ch <- rbind(pval_c, pval_h)
resp <- rep(c("Days 2 to 3"), times = nrow(pval_c)+nrow(pval_h))
line1 <- as.data.frame(rep(c("0.37"), times = nrow(pval_c)))
colnames(line1) <- c("line")
line2 <- as.data.frame(rep(c("0.36"), times = nrow(pval_h)))
colnames(line2) <- c("line")
line <- rbind(line1, line2)
figS12A_fig <- cbind(pval_ch, resp, line)
figS12A <- rbind(figS12A, figS12A_fig)# Day 1 to 3
# Obtain pvalues
chimp_p_values_gen <- as.data.frame(qqplot_inc_day13[1])
shared_p_values_gen <- as.data.frame(qqplot_inc_day13[2])
# Pi_0 estimate for the chimps
pi0est_chimps <- qvalue(p=chimp_p_values_gen, pi0.method="smoother", fdr.level=NULL, robust=TRUE)$pi0
pi0est_chimps[1] 0.5071291# Pi_1 estimate for the chimps
pi1est_chimps <- 1 - pi0est_chimps
pi1est_chimps[1] 0.4928709# Pi_0 estimate for the chimps given significant in the humans
pi0est_chimps_given_humans <- qvalue(p=shared_p_values_gen, pi0.method="smoother", fdr.level=NULL, robust=TRUE)$pi0
pi0est_chimps_given_humans[1] 0.2368051# Pi_1 estimate for the humans
pi1est_chimps_given_humans <- 1 - pi0est_chimps_given_humans
pi1est_chimps_given_humans[1] 0.7631949# Let's overlap the two histograms
labels_c <- array("Chimpanzee", dim = c(10304,1))
labels_h <- array("Shared (Chimpanzee|Significant in Humans)", dim = c(as.data.frame(qqplot_inc_day13[[3]][2]),1))
chimps <- cbind(labels_c, chimp_p_values_gen)
colnames(chimps) <- c("Species", "pval")
humans <- cbind(labels_h, shared_p_values_gen)
colnames(humans) <- c("Species", "pval")
# Combine the two
all_pval <- rbind(chimps[,1:2], humans[,1:2])
pal <- c("#00A4F4", "#E77642", "white")
p4_inc_01 <- ggplot(all_pval, aes(pval, fill = Species)) + scale_fill_manual(values=pal[2:3]) +
geom_density(show.legend = F, alpha = 1) +
scale_x_continuous(limits = c(0,1), breaks = seq(0,1,0.25)) +
theme_bw() + labs(title = "Day 1 to 3") + theme(plot.title = element_text(face = "bold")) + labs(x = "Unadjusted p-values") + labs(y = "Density") + scale_y_continuous(labels=scaleFUN) +
geom_hline(yintercept = pi0est_chimps_given_humans, size = 2.5) +
geom_hline(yintercept = pi0est_chimps, size = 2.5, color = "#E77642") +
annotate("text", label= 'bold(bolditalic(hat(pi)[0][", chimps"])=="0.51")', parse=TRUE, x=0.2, y=(pi0est_chimps+0.08), colour = "#E77642", size = 6) + annotate("text", label = 'bold(bolditalic(hat(pi)[0][", shared"])=="0.24")', parse=TRUE, x=0.2, y=(pi0est_chimps_given_humans+0.08), size = 6)
p4_inc_01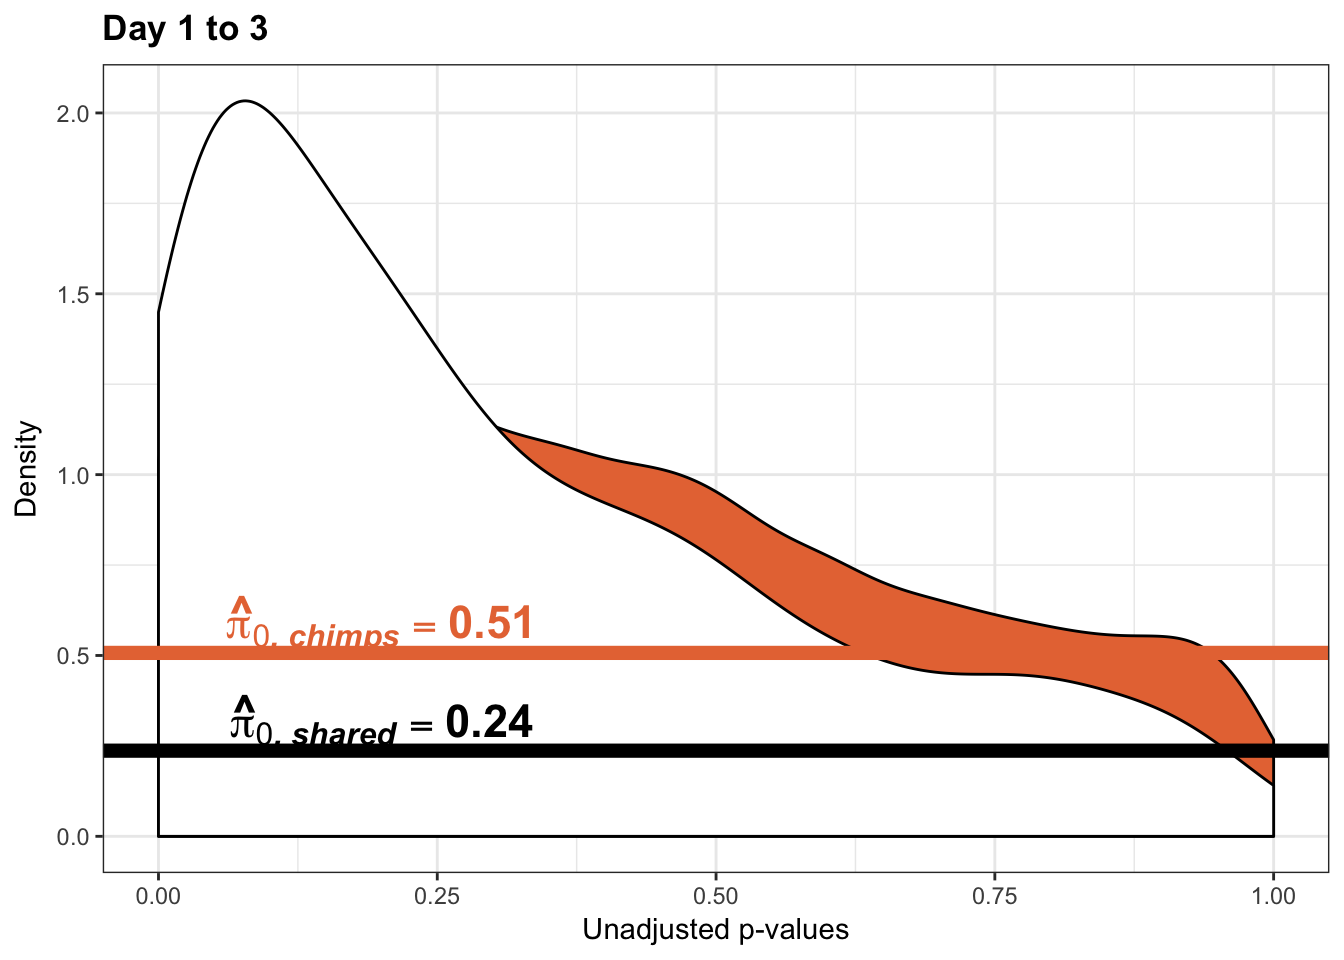
pval_c <- chimps[,1:2]
pval_h <- humans[,1:2]
pval_ch <- rbind(pval_c, pval_h)
resp <- rep(c("Days 1 to 3"), times = nrow(pval_c)+nrow(pval_h))
line1 <- as.data.frame(rep(c("0.51"), times = nrow(pval_c)))
colnames(line1) <- c("line")
line2 <- as.data.frame(rep(c("0.24"), times = nrow(pval_h)))
colnames(line2) <- c("line")
line <- rbind(line1, line2)
figS12A_fig <- cbind(pval_ch, resp, line)
figS12A <- rbind(figS12A, figS12A_fig)
#write.csv(figS12A, "/Users/laurenblake/Dropbox/Endoderm TC/Draft versions/Resubmit1_Genome Biology/Supplemental/Data_figS14I.csv", quote = FALSE, row.names = FALSE)Changes of variation in humans (p = 0.01)
# Reduction in variance from day 0 to day 1 humans
qqplot_red_day01 <- find_qqplot_red_humans(7,10,17,20,1,6,11,16, 0.01)
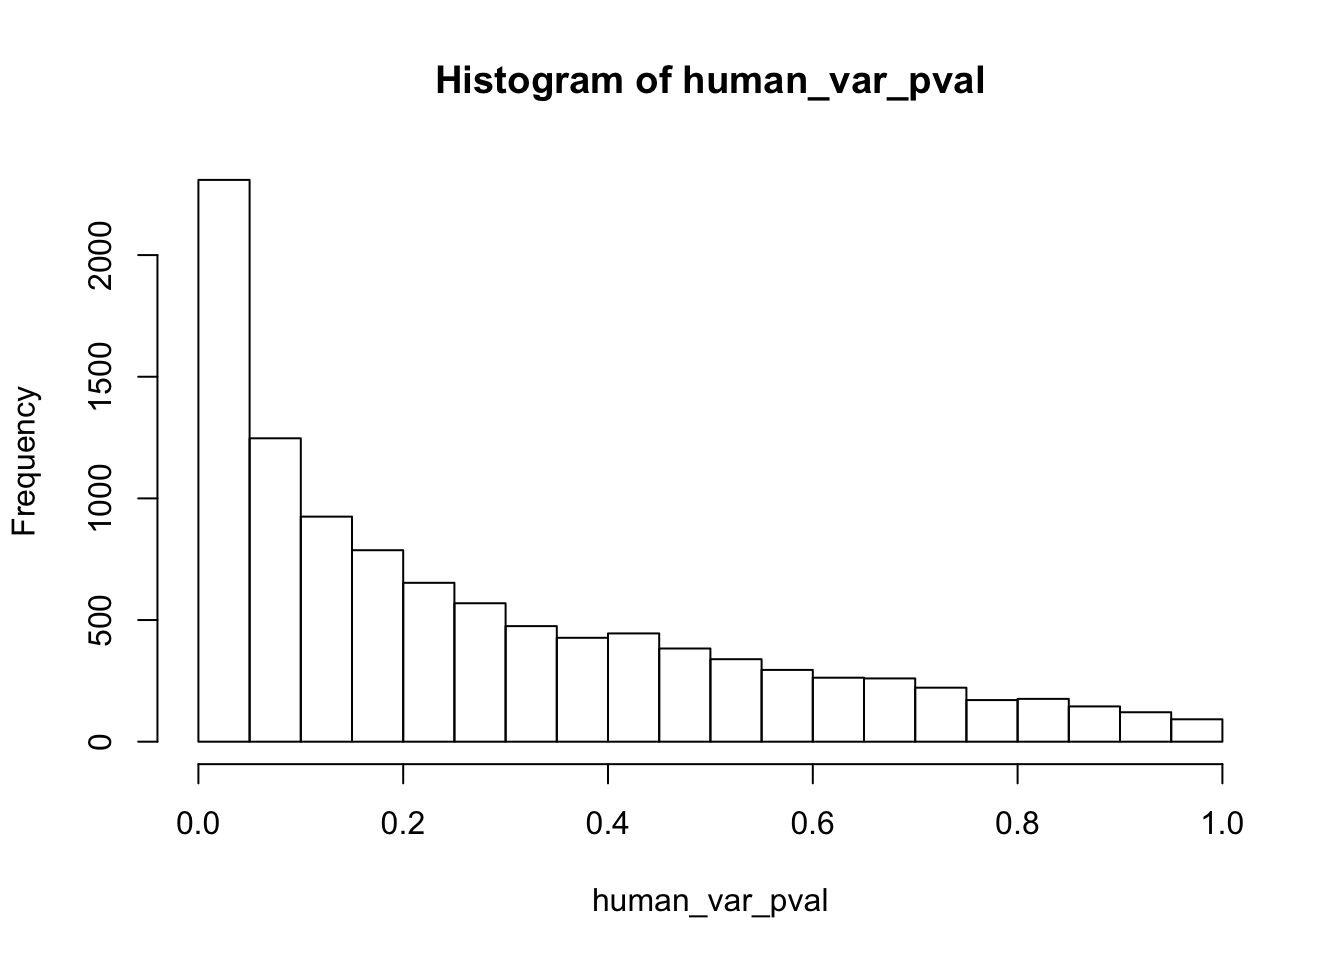
# Reduction in variance from day 1 to day 2 humans
qqplot_red_day12 <- find_qqplot_red_humans(17,20,27,30,11,16,21,26,0.01)

# Reduction in variance from day 2 to day 3 humans
qqplot_red_day23 <- find_qqplot_red_humans(27,30,37,40,21,26,31,36,0.01)

# Reduction in variance from day 1 to day 3 humans
qqplot_red_day13 <- find_qqplot_red_humans(17,20,37,40,11,16,31,36,0.01)

# Reduction in variance from day 0 to day 2 humans
qqplot_red_day02 <- find_qqplot_red_humans(7,10,27,30,1,6,21,26,0.01)

# Inc. in variance from day 0 to day 1 humans
qqplot_inc_day01 <- find_qqplot_inc_humans(7,10,17,20,1,6,11,16,0.01)

# Inc. in variance from day 1 to day 2 humans
qqplot_inc_day12 <- find_qqplot_inc_humans(17,20,27,30,11,16,21,26,0.01)

# Inc. in variance from day 2 to day 3 humans
qqplot_inc_day23 <- find_qqplot_inc_humans(27,30,37,40,21,26,31,36,0.01)

# Inc. in variance from day 0 to day 2
qqplot_inc_day02 <- find_qqplot_inc_humans(7,10,27,30,1,6,21,26,0.01)

# Inc. in variance from day ` to day 3 humans
qqplot_inc_day13 <- find_qqplot_inc_humans(17,20,37,40,11,16,31,36,0.01)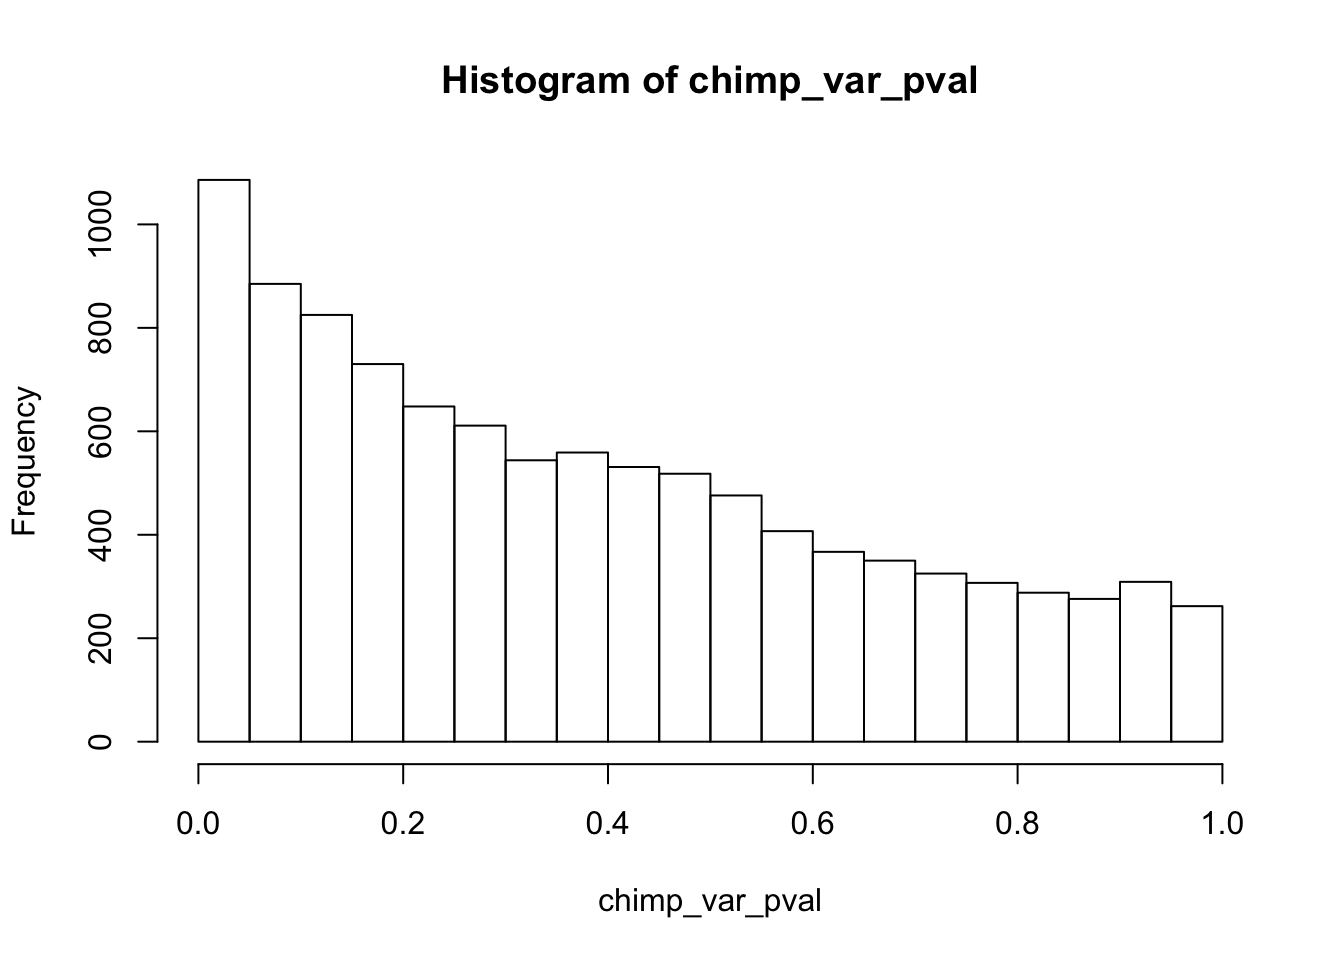

Estimates of pi0 and pi1 for reduction of variation in humans conditioned on significance in chimps (p = 0.01)
####################### REDUCTION OF VARIATION IN HUMANS (p = 0.01)
# Day 0 to 1
# Obtain pvalues
human_p_values_gen <- as.data.frame(qqplot_red_day01[1])
shared_p_values_gen <- as.data.frame(qqplot_red_day01[2])
# Pi_0 estimate for the humans
pi0est_humans <- qvalue(p= human_p_values_gen, pi0.method="smoother", fdr.level=NULL, robust=TRUE)$pi0
pi0est_humans[1] 0.174912# Pi_1 estimate for the humans
pi1est_humans <- 1 - pi0est_humans
pi1est_humans[1] 0.825088# Pi_0 estimate for the chimps given significant in the humans
pi0est_humans_given_chimps <- qvalue(p=shared_p_values_gen, pi0.method="smoother", fdr.level=NULL, robust=TRUE)$pi0
pi0est_humans_given_chimps[1] 0.1469146# Pi_1 estimate for the humans
pi1est_humans_given_chimps <- 1 - pi0est_humans_given_chimps
pi1est_humans_given_chimps[1] 0.8530854# Let's overlap the two histograms
labels_h <- array("Human", dim = c(10304,1))
labels_c <- array("Shared (Human|Significant in Chimps)", dim = c(as.data.frame(qqplot_red_day01[[3]][1]),1))
chimps <- cbind(labels_c, shared_p_values_gen)
colnames(chimps) <- c("Species", "pval")
humans <- cbind(labels_h, human_p_values_gen)
colnames(humans) <- c("Species", "pval")
# Combine the two
all_pval <- rbind(humans[,1:2], chimps[,1:2])
pal <- c("#00A4F4", "white")
p5_01 <- ggplot(all_pval, aes(pval, fill = Species)) + scale_fill_manual(values=pal[1:2]) +
geom_density(show.legend = F, alpha = 1) +
scale_x_continuous(limits = c(0,1), breaks = seq(0,1,0.25)) +
theme_bw() + labs(title = "Day 0 to 1") + theme(plot.title = element_text(face = "bold")) + labs(x = "Unadjusted p-values") + labs(y = "Density") + scale_y_continuous(labels=scaleFUN) +
geom_hline(yintercept = pi0est_humans_given_chimps, size = 2.5) +
geom_hline(yintercept = pi0est_humans, size = 2.5, color = "#00A4F4") +
annotate("text", label= 'bold(bolditalic(hat(pi)[0][", humans"])=="0.17")', parse=TRUE, x=0.2, y=(pi0est_humans+0.3), colour = "#00A4F4", size = 6) + annotate("text", label = 'bold(bolditalic(hat(pi)[0][", shared"])=="0.15")', parse=TRUE, x=0.2, y=(pi0est_humans_given_chimps+0.15), size = 6)
p5_01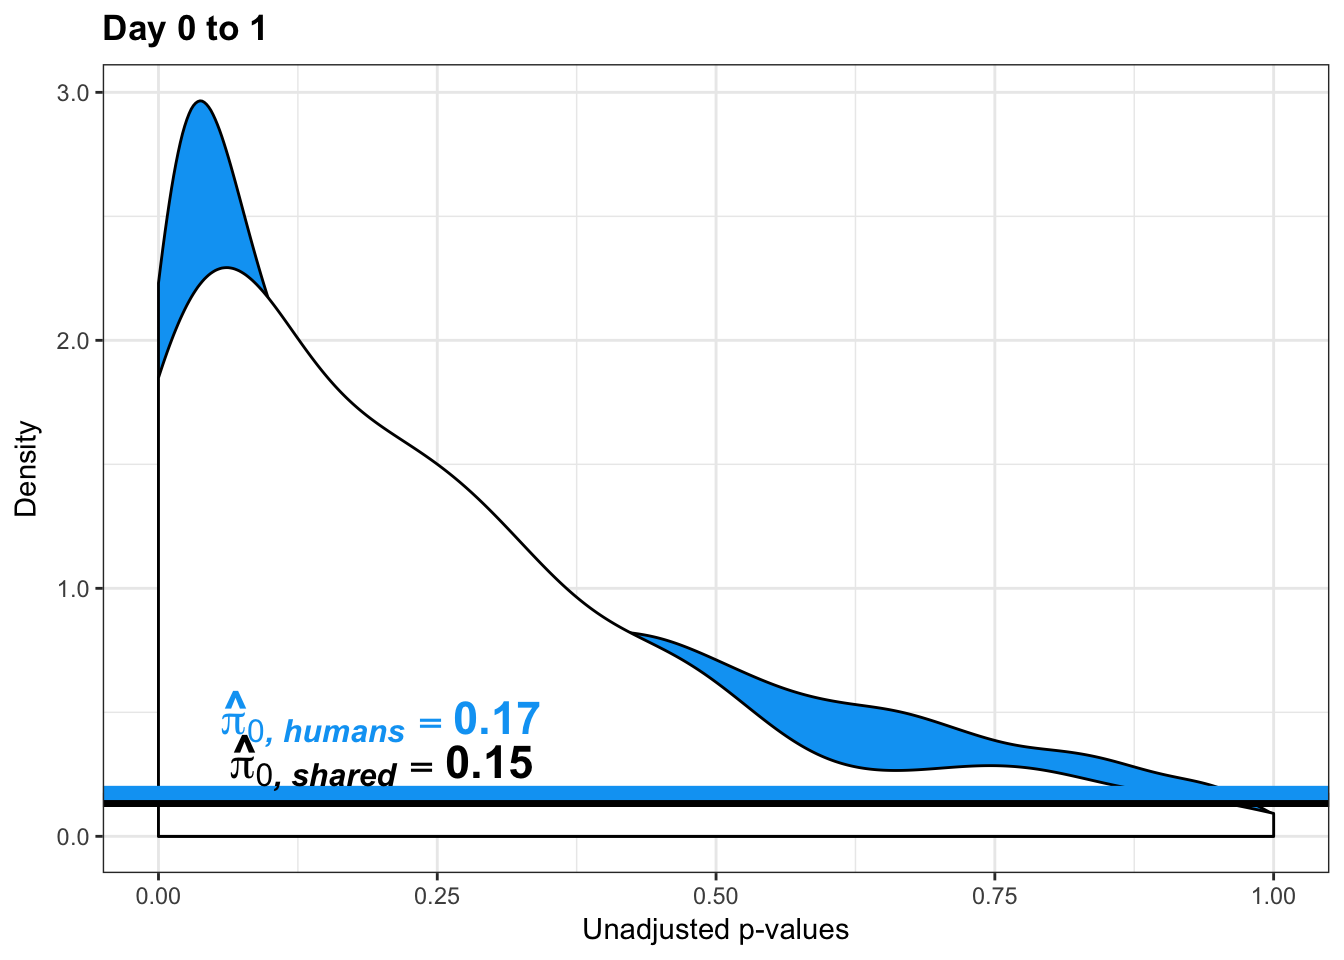
pval_c <- chimps[,1:2]
pval_h <- humans[,1:2]
pval_ch <- rbind(pval_h, pval_c)
resp <- rep(c("Days 0 to 1"), times = nrow(pval_c)+nrow(pval_h))
line1 <- as.data.frame(rep(c("0.17"), times = nrow(pval_h)))
colnames(line1) <- c("line")
line2 <- as.data.frame(rep(c("0.15"), times = nrow(pval_c)))
colnames(line2) <- c("line")
line <- rbind(line1, line2)
figS12A <- cbind(pval_ch, resp, line)# Day 1 to 2
# Obtain pvalues
human_p_values_gen <- as.data.frame(qqplot_red_day12[1])
shared_p_values_gen <- as.data.frame(qqplot_red_day12[2])
# Pi_0 estimate for the humans
#pi0est_humans <- qvalue(p= human_p_values_gen, pi0.method="smoother", fdr.level=NULL, robust=TRUE)$pi0
#pi0est_humans
# Pi_1 estimate for the humans
#pi1est_humans <- 1 - pi0est_humans
#pi1est_humans
# Pi_0 estimate for the chimps given significant in the humans
#pi0est_humans_given_chimps <- qvalue(p=shared_p_values_gen, pi0.method="smoother", #fdr.level=NULL, robust=TRUE)$pi0
#pi0est_humans_given_chimps
# Pi_1 estimate for the humans
#pi1est_humans_given_chimps <- 1 - pi0est_humans_given_chimps
#pi1est_humans_given_chimps
# Note: There's an issue with estimating pi_0 from only 15 points.
# Let's overlap the two histograms
labels_h <- array("Human", dim = c(10304,1))
labels_c <- array("Shared (Human|Significant in Chimps)", dim = c(as.data.frame(qqplot_red_day12[[3]][1]),1))
chimps <- cbind(labels_c, shared_p_values_gen)
colnames(chimps) <- c("Species", "pval")
humans <- cbind(labels_h, human_p_values_gen)
colnames(humans) <- c("Species", "pval")
# Combine the two
all_pval <- rbind(humans[,1:2], chimps[,1:2])
pal <- c("#00A4F4", "white")
p6_01 <- ggplot(all_pval, aes(pval, fill = Species)) + scale_fill_manual(values=pal[1:2]) +
geom_density(show.legend = F, alpha = 1) +
scale_x_continuous(limits = c(0,1), breaks = seq(0,1,0.25)) +
theme_bw() + labs(title = "Day 1 to 2") + theme(plot.title = element_text(face = "bold")) + labs(x = "Unadjusted p-values") + labs(y = "Density") + scale_y_continuous(labels=scaleFUN) +
geom_hline(yintercept = pi0est_humans_given_chimps, size = 2.5) +
geom_hline(yintercept = pi0est_humans, size = 2.5, color = "#00A4F4") +
annotate("text", label= 'bold(bolditalic(hat(pi)[0][", humans"])=="1")', parse=TRUE, x=0.2, y=(pi0est_humans+0.3), colour = "#00A4F4", size = 6) + annotate("text", label = 'bold(bolditalic(hat(pi)[0][", shared"])=="1")', parse=TRUE, x=0.2, y=(pi0est_humans_given_chimps+0.15), size = 6)
p6_01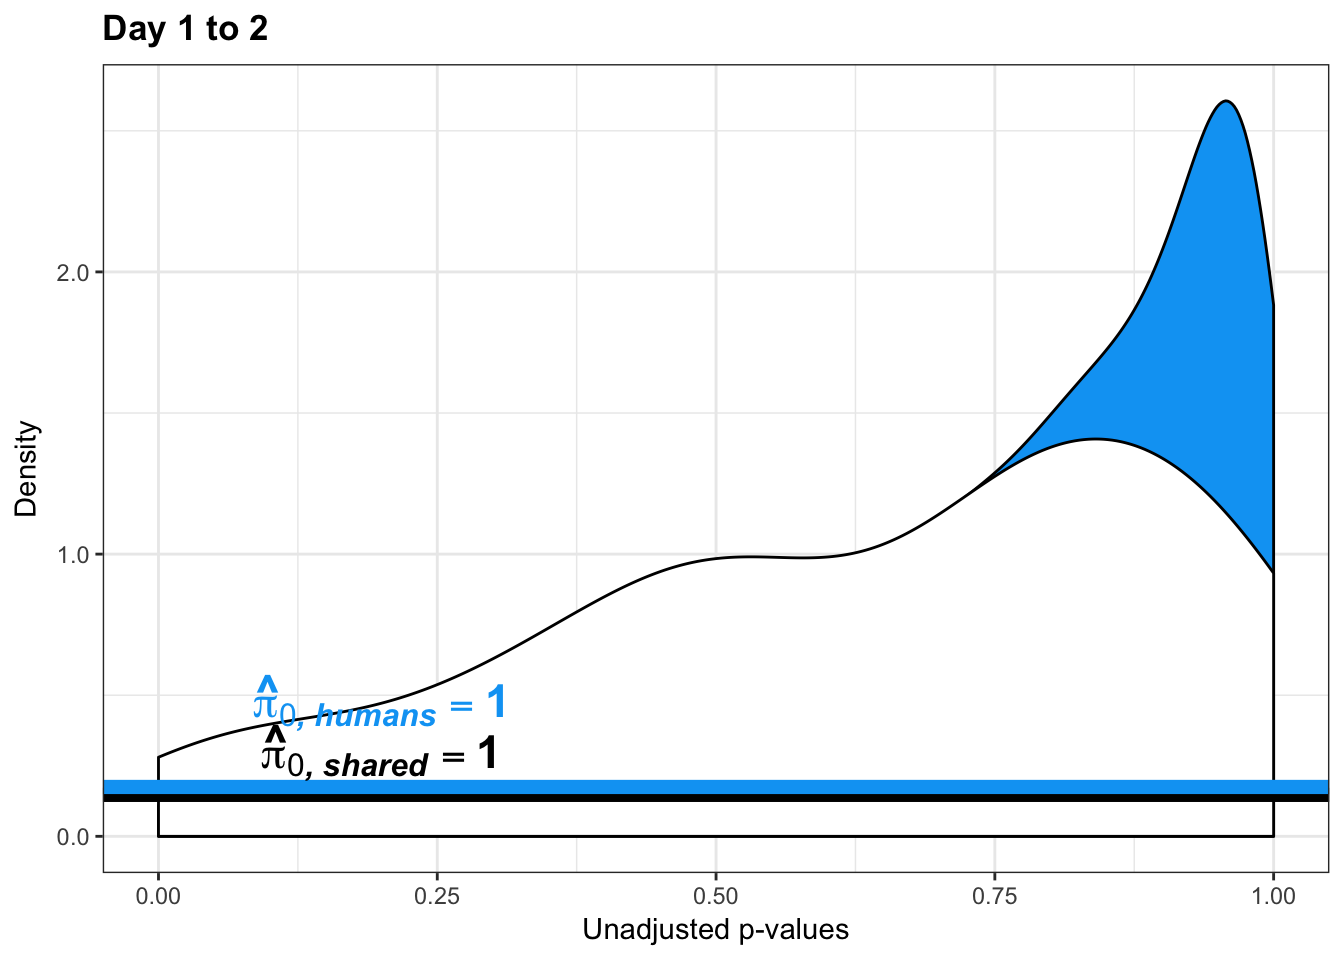
pval_c <- chimps[,1:2]
pval_h <- humans[,1:2]
pval_ch <- rbind(pval_h, pval_c)
resp <- rep(c("Days 1 to 2"), times = nrow(pval_c)+nrow(pval_h))
line1 <- as.data.frame(rep(c("NA"), times = nrow(pval_h)))
colnames(line1) <- c("line")
line2 <- as.data.frame(rep(c("NA"), times = nrow(pval_c)))
colnames(line2) <- c("line")
line <- rbind(line1, line2)
figS12A_fig <- cbind(pval_ch, resp, line)
figS12A <- rbind(figS12A, figS12A_fig)# Day 2 to 3
# Obtain pvalues
human_p_values_gen <- as.data.frame(qqplot_red_day23[1])
shared_p_values_gen <- as.data.frame(qqplot_red_day23[2])
# Pi_0 estimate for the humans
#pi0est_humans <- qvalue(p= human_p_values_gen, pi0.method="smoother", fdr.level=NULL, robust=TRUE)$pi0
#pi0est_humans
# Pi_1 estimate for the humans
#pi1est_humans <- 1 - pi0est_humans
#pi1est_humans
# Pi_0 estimate for the chimps given significant in the humans
#pi0est_humans_given_chimps <- qvalue(p=shared_p_values_gen, pi0.method="smoother", fdr.level=NULL, robust=TRUE)$pi0
#pi0est_humans_given_chimps
# Pi_1 estimate for the humans
#pi1est_humans_given_chimps <- 1 - pi0est_humans_given_chimps
#pi1est_humans_given_chimps
# Let's overlap the two histograms
labels_h <- array("Human", dim = c(10304,1))
labels_c <- array("Shared (Human|Significant in Chimps)", dim = c(as.data.frame(qqplot_red_day23[[3]][1]),1))
chimps <- cbind(labels_c, shared_p_values_gen)
colnames(chimps) <- c("Species", "pval")
humans <- cbind(labels_h, human_p_values_gen)
colnames(humans) <- c("Species", "pval")
# Combine the two
all_pval <- rbind(humans[,1:2], chimps[,1:2])
pal <- c("#00A4F4", "white")
p7_01 <- ggplot(all_pval, aes(pval, fill = Species)) + scale_fill_manual(values=pal[1:2]) +
geom_density(show.legend = F, alpha = 1) +
scale_x_continuous(limits = c(0,1), breaks = seq(0,1,0.25)) +
theme_bw() + labs(title = "Day 2 to 3") + theme(plot.title = element_text(face = "bold")) + labs(x = "Unadjusted p-values") + labs(y = "Density") + scale_y_continuous(labels=scaleFUN) +
geom_hline(yintercept = pi0est_humans_given_chimps, size = 2.5) +
geom_hline(yintercept = pi0est_humans, size = 2.5, color = "#00A4F4") +
annotate("text", label= 'bold(bolditalic(hat(pi)[0][", humans"])=="0.87")', parse=TRUE, x=0.6, y=(pi0est_humans+0.07), colour = "#00A4F4", size = 6) + annotate("text", label = 'bold(bolditalic(hat(pi)[0][", shared"])=="0.36")', parse=TRUE, x=0.6, y=(pi0est_humans_given_chimps+0.07), size = 6)
p7_01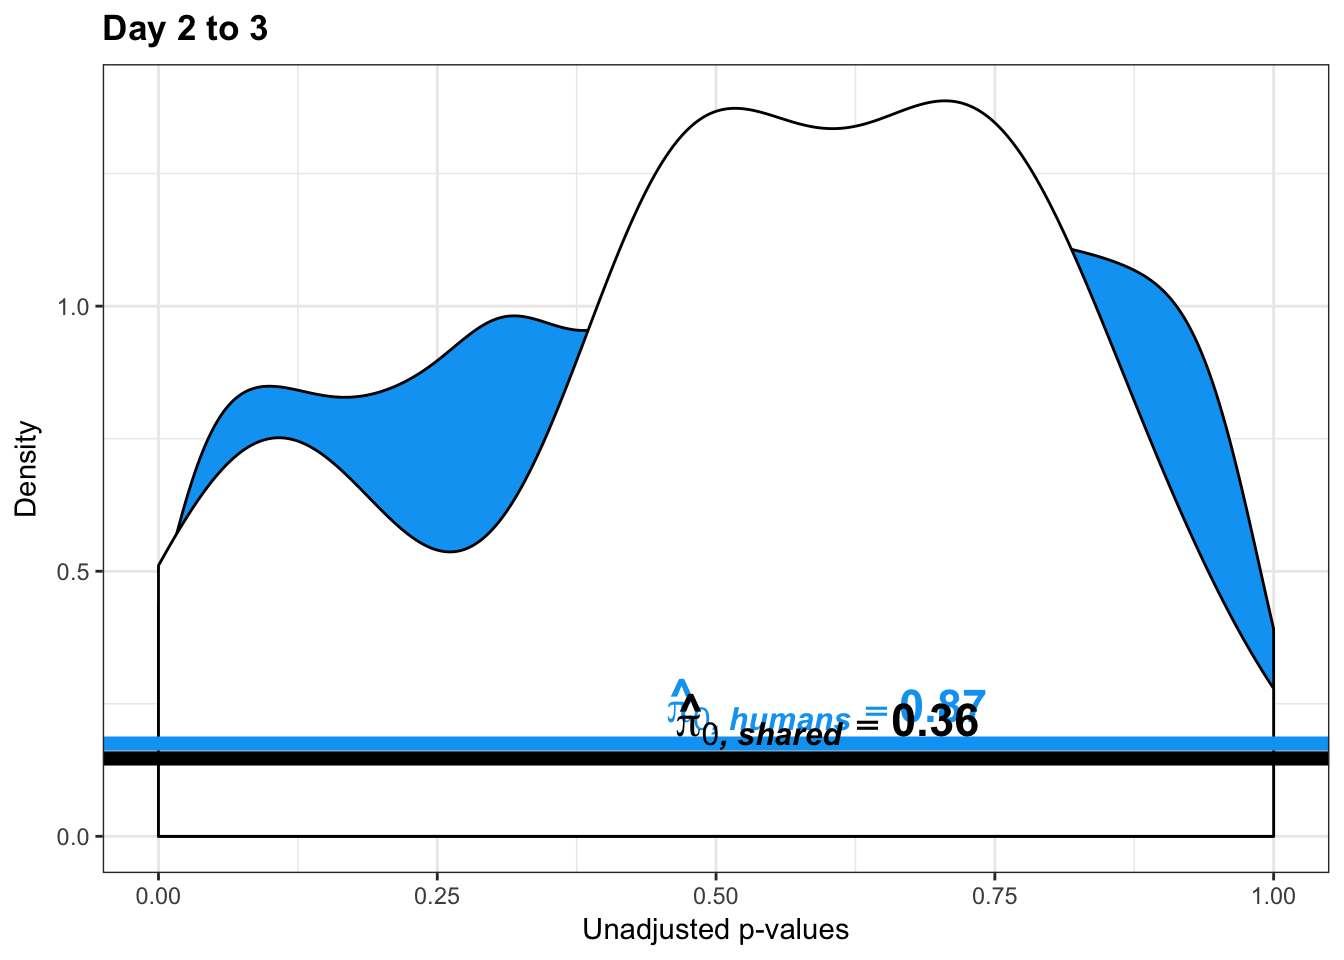
pval_c <- chimps[,1:2]
pval_h <- humans[,1:2]
pval_ch <- rbind(pval_h, pval_c)
resp <- rep(c("Days 2 to 3"), times = nrow(pval_c)+nrow(pval_h))
line1 <- as.data.frame(rep(c("NA"), times = nrow(pval_h)))
colnames(line1) <- c("line")
line2 <- as.data.frame(rep(c("NA"), times = nrow(pval_c)))
colnames(line2) <- c("line")
line <- rbind(line1, line2)
figS12A_fig <- cbind(pval_ch, resp, line)
figS12A <- rbind(figS12A, figS12A_fig)# Day 1 to 3
# Obtain pvalues
human_p_values_gen <- as.data.frame(qqplot_red_day13[1])
shared_p_values_gen <- as.data.frame(qqplot_red_day13[2])
# Pi_0 estimate for the humans
#pi0est_humans <- qvalue(p= human_p_values_gen, pi0.method="smoother", fdr.level=NULL, robust=TRUE)$pi0
#pi0est_humans
# Pi_1 estimate for the humans
#pi1est_humans <- 1 - pi0est_humans
#pi1est_humans
# Pi_0 estimate for the chimps given significant in the humans
#pi0est_humans_given_chimps <- qvalue(p=shared_p_values_gen, pi0.method="smoother", fdr.level=NULL, robust=TRUE)$pi0
#pi0est_humans_given_chimps
# Pi_1 estimate for the humans
#pi1est_humans_given_chimps <- 1 - pi0est_humans_given_chimps
#pi1est_humans_given_chimps
# Let's overlap the two histograms
labels_h <- array("Human", dim = c(10304,1))
labels_c <- array("Shared (Human|Significant in Chimps)", dim = c(as.data.frame(qqplot_red_day13[[3]][1]),1))
chimps <- cbind(labels_c, shared_p_values_gen)
colnames(chimps) <- c("Species", "pval")
humans <- cbind(labels_h, human_p_values_gen)
colnames(humans) <- c("Species", "pval")
# Combine the two
all_pval <- rbind(humans[,1:2], chimps[,1:2])
pal <- c("#00A4F4", "white")
p8_01 <- ggplot(all_pval, aes(pval, fill = Species)) + scale_fill_manual(values=pal[1:2]) +
geom_density(show.legend = F, alpha = 1) +
scale_x_continuous(limits = c(0,1), breaks = seq(0,1,0.25)) +
theme_bw() + labs(title = "Day 1 to 3") + theme(plot.title = element_text(face = "bold")) + labs(x = "Unadjusted p-values") + labs(y = "Density") + scale_y_continuous(labels=scaleFUN) +
geom_hline(yintercept = pi0est_humans_given_chimps, size = 2.5) +
geom_hline(yintercept = pi0est_humans, size = 2.5, color = "#00A4F4") +
annotate("text", label= 'bold(bolditalic(hat(pi)[0][", humans"])=="1")', parse=TRUE, x=0.2, y=(pi0est_humans+0.3), colour = "#00A4F4", size = 6) + annotate("text", label = 'bold(bolditalic(hat(pi)[0][", shared"])=="1")', parse=TRUE, x=0.2, y=(pi0est_humans_given_chimps+0.15), size = 6)
p8_01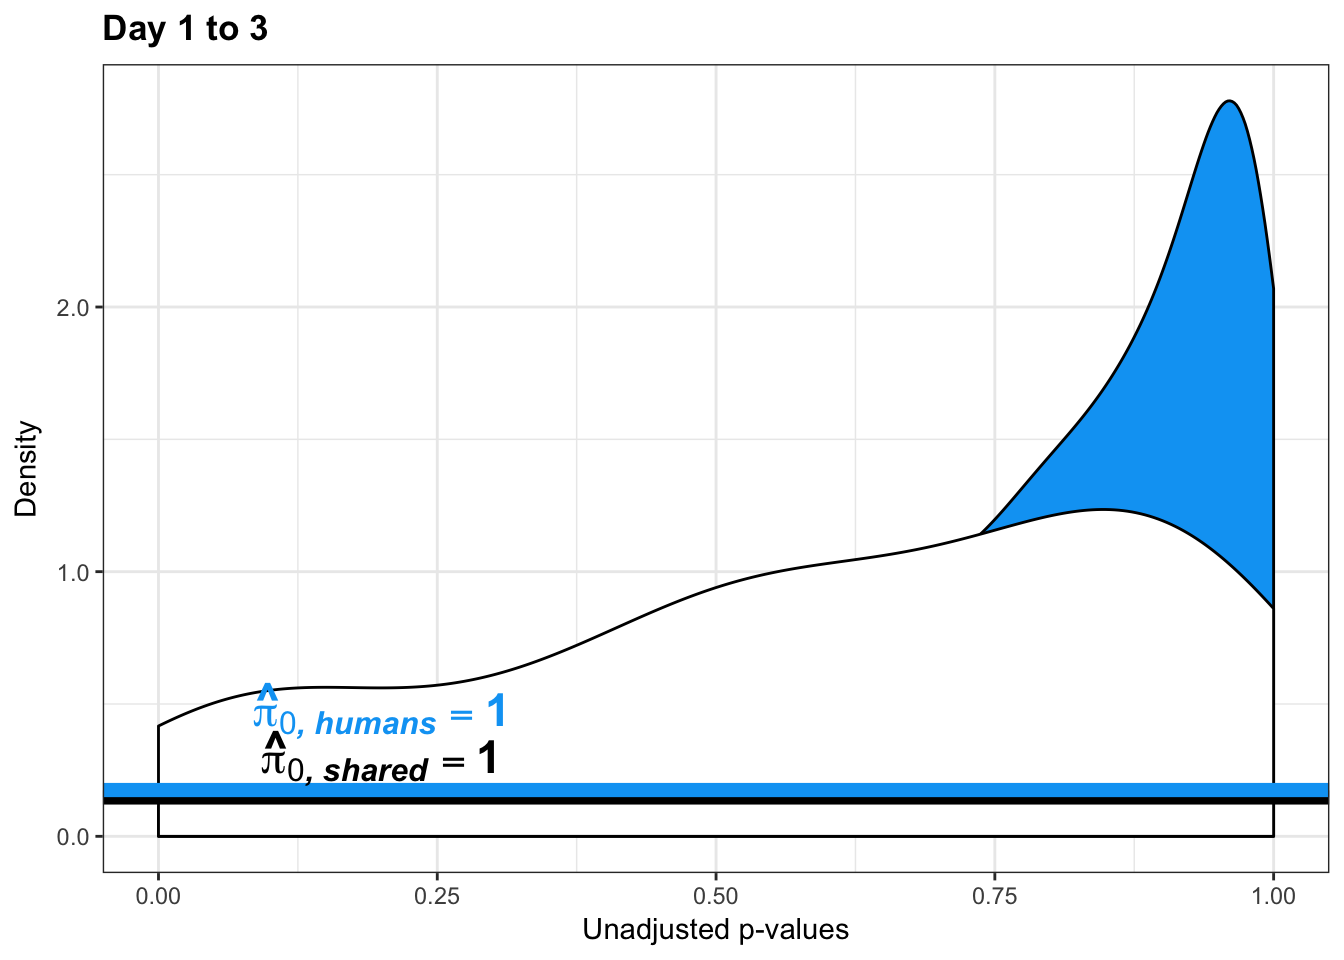
pval_c <- chimps[,1:2]
pval_h <- humans[,1:2]
pval_ch <- rbind(pval_h, pval_c)
resp <- rep(c("Days 1 to 3"), times = nrow(pval_c)+nrow(pval_h))
line1 <- as.data.frame(rep(c("NA"), times = nrow(pval_h)))
colnames(line1) <- c("line")
line2 <- as.data.frame(rep(c("NA"), times = nrow(pval_c)))
colnames(line2) <- c("line")
line <- rbind(line1, line2)
figS12A_fig <- cbind(pval_ch, resp, line)
figS12A <- rbind(figS12A, figS12A_fig)
#write.csv(figS12A, "/Users/laurenblake/Dropbox/Endoderm TC/Draft versions/Resubmit1_Genome Biology/Supplemental/Data_figS14G.csv", quote = FALSE, row.names = FALSE)
multiplot(p1_01,p5_01,p3_01,p6_01, p4_01,p7_01,p8_01,cols=4)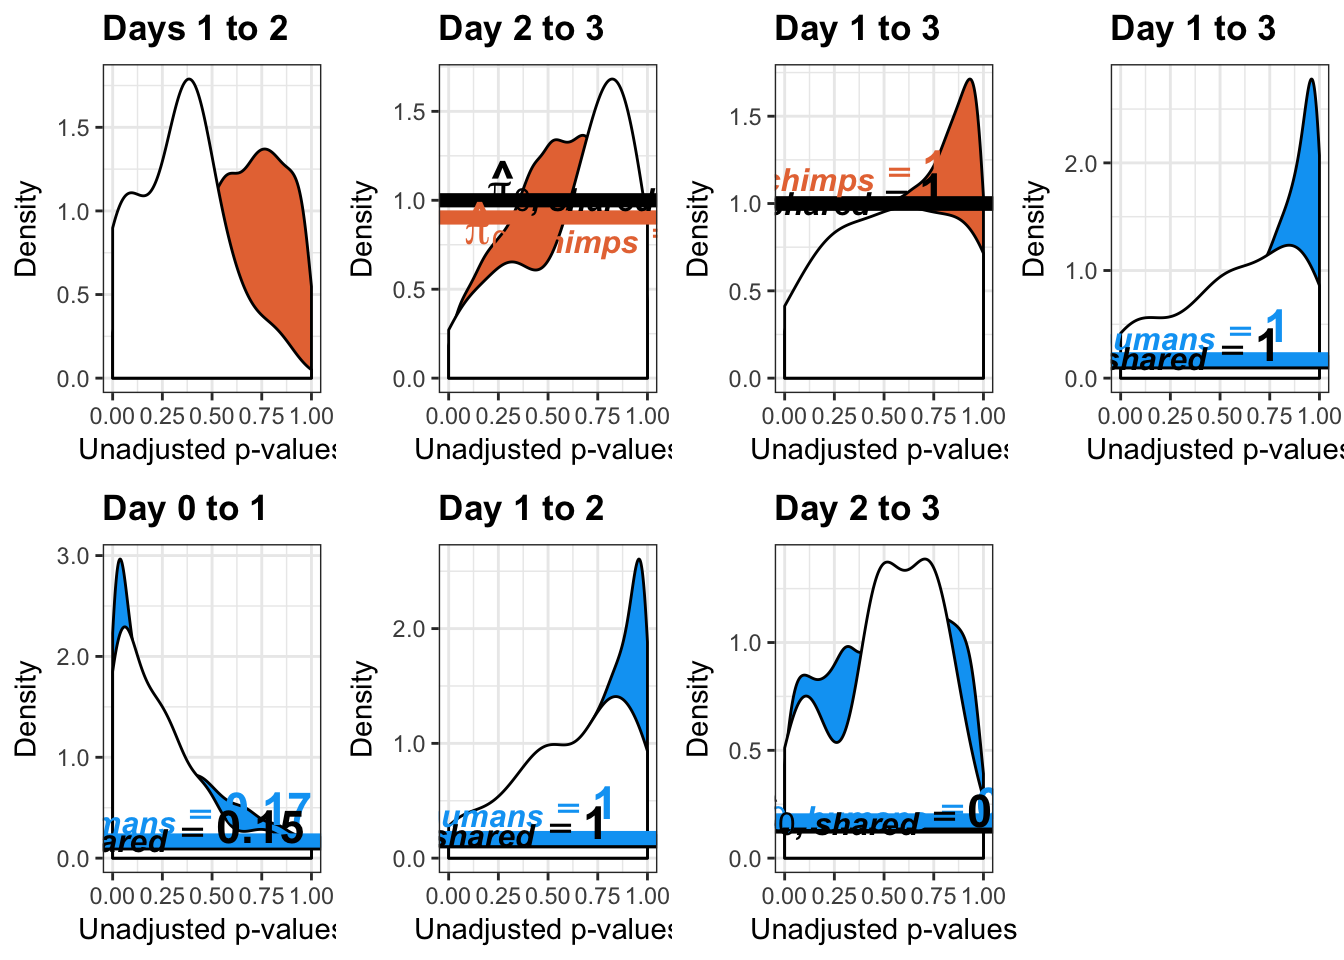
#multiplot(p1_01,p3_01,p4_01,p5_01,p6_01,p7_01,p8_01,cols=2)Estimates of pi0 and pi1 for increase of variation in humans conditioned on significance in chimps (p = 0.01)
####################### INCREASE IN VARIATION IN HUMANS (p = 0.01)
# Day 0 to 1
# Obtain pvalues
human_p_values_gen <- as.data.frame(qqplot_inc_day01[1])
shared_p_values_gen <- as.data.frame(qqplot_inc_day01[2])
# Pi_0 estimate for the humans
#pi0est_humans <- qvalue(p= human_p_values_gen, pi0.method="smoother", fdr.level=NULL, robust=TRUE)$pi0
#pi0est_humans
# Pi_1 estimate for the humans
#pi1est_humans <- 1 - pi0est_humans
#pi1est_humans
# Pi_0 estimate for the chimps given significant in the humans
#pi0est_humans_given_chimps <- qvalue(p=shared_p_values_gen, pi0.method="smoother", fdr.level=NULL, robust=TRUE)$pi0
#pi0est_humans_given_chimps
# Pi_1 estimate for the humans
#pi1est_humans_given_chimps <- 1 - pi0est_humans_given_chimps
#pi1est_humans_given_chimps
# Let's overlap the two histograms
labels_h <- array("Human", dim = c(10304,1))
labels_c <- array("Shared (Human|Significant in Chimps)", dim = c(as.data.frame(qqplot_inc_day01[[3]][1]),1))
chimps <- cbind(labels_c, shared_p_values_gen)
colnames(chimps) <- c("Species", "pval")
humans <- cbind(labels_h, human_p_values_gen)
colnames(humans) <- c("Species", "pval")
# Combine the two
all_pval <- rbind(humans[,1:2], chimps[,1:2])
pal <- c("#00A4F4", "white")
p5_inc_01 <- ggplot(all_pval, aes(pval, fill = Species)) + scale_fill_manual(values=pal[1:2]) +
geom_density(show.legend = F, alpha = 1) +
scale_x_continuous(limits = c(0,1), breaks = seq(0,1,0.25)) + scale_y_continuous(labels=scaleFUN) +
theme_bw() + labs(title = "Day 0 to 1") + theme(plot.title = element_text(face = "bold")) + labs(x = "Unadjusted p-values") + labs(y = "Density") +
geom_hline(yintercept = pi0est_humans_given_chimps, size = 2.5) +
geom_hline(yintercept = pi0est_humans, size = 2.5, color = "#00A4F4") +
annotate("text", label= 'bold(bolditalic(hat(pi)[0][", humans"])=="1")', parse=TRUE, x=0.2, y=(pi0est_humans+0.3), colour = "#00A4F4", size = 6) + annotate("text", label = 'bold(bolditalic(hat(pi)[0][", shared"])=="1")', parse=TRUE, x=0.2, y=(pi0est_humans_given_chimps+0.15), size = 6)
p5_inc_01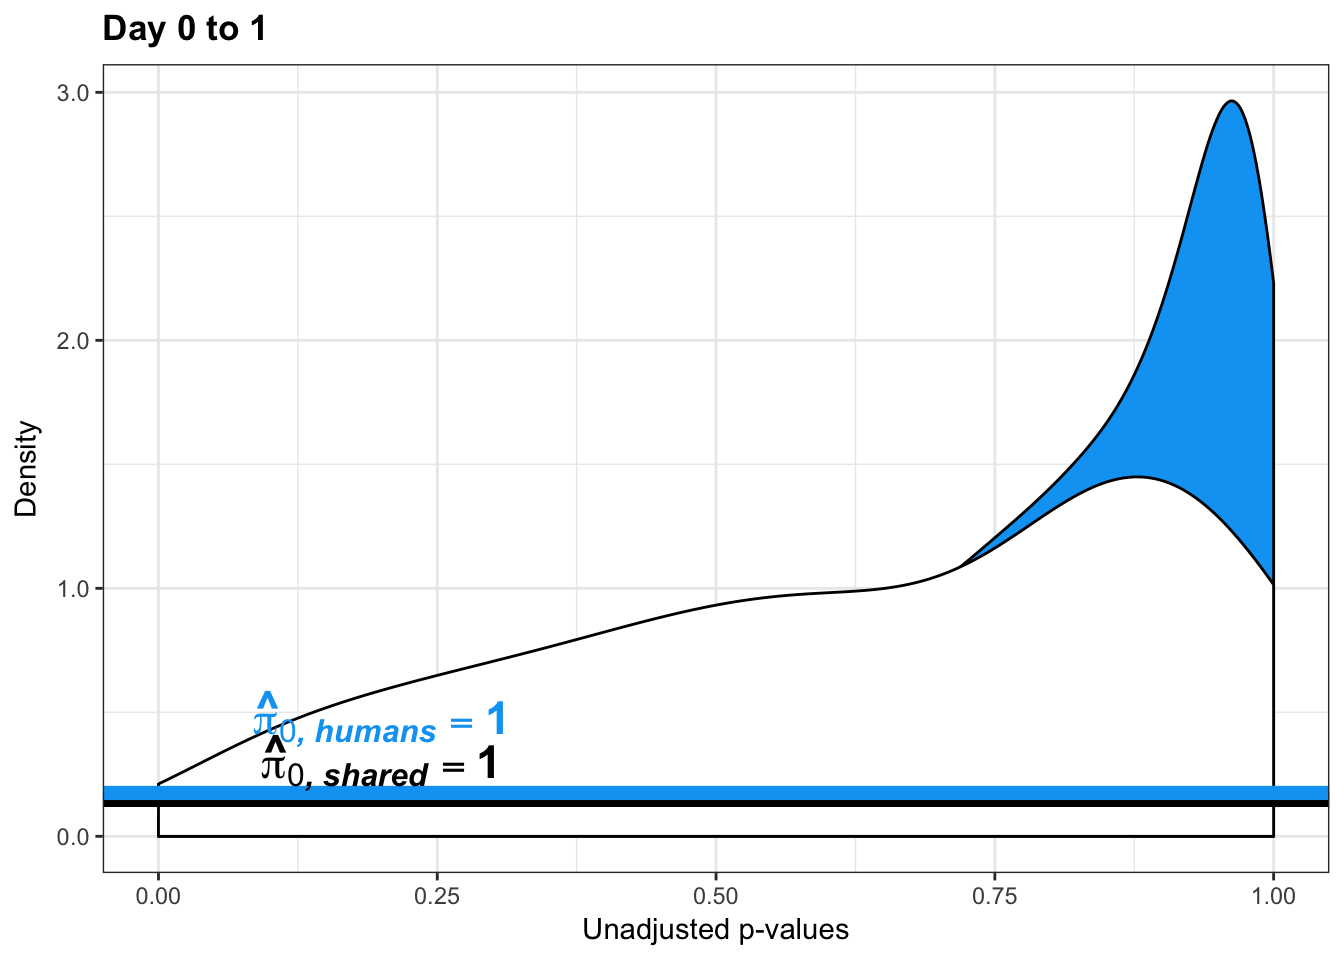
pval_c <- chimps[,1:2]
pval_h <- humans[,1:2]
pval_ch <- rbind(pval_h, pval_c)
resp <- rep(c("Days 0 to 1"), times = nrow(pval_c)+nrow(pval_h))
line1 <- as.data.frame(rep(c("NA"), times = nrow(pval_h)))
colnames(line1) <- c("line")
line2 <- as.data.frame(rep(c("NA"), times = nrow(pval_c)))
colnames(line2) <- c("line")
line <- rbind(line1, line2)
figS12A <- cbind(pval_ch, resp, line)# Day 1 to 2
# Obtain pvalues
human_p_values_gen <- as.data.frame(qqplot_inc_day12[1])
shared_p_values_gen <- as.data.frame(qqplot_inc_day12[2])
# Pi_0 estimate for the humans
#pi0est_humans <- qvalue(p= human_p_values_gen, pi0.method="smoother", fdr.level=NULL, robust=TRUE)$pi0
#pi0est_humans
# Pi_1 estimate for the humans
#pi1est_humans <- 1 - pi0est_humans
#pi1est_humans
# Pi_0 estimate for the chimps given significant in the humans
#pi0est_humans_given_chimps <- qvalue(p=shared_p_values_gen, pi0.method="smoother", fdr.level=NULL, robust=TRUE)$pi0
#pi0est_humans_given_chimps
# Pi_1 estimate for the humans
#pi1est_humans_given_chimps <- 1 - pi0est_humans_given_chimps
#pi1est_humans_given_chimps
# Let's overlap the two histograms
labels_h <- array("Human", dim = c(10304,1))
labels_c <- array("Shared (Human|Significant in Chimps)", dim = c(as.data.frame(qqplot_inc_day12[[3]][1]),1))
chimps <- cbind(labels_c, shared_p_values_gen)
colnames(chimps) <- c("Species", "pval")
humans <- cbind(labels_h, human_p_values_gen)
colnames(humans) <- c("Species", "pval")
# Combine the two
all_pval <- rbind(humans[,1:2], chimps[,1:2])
pal <- c("#00A4F4", "white")
p6_inc_01 <- ggplot(all_pval, aes(pval, fill = Species)) + scale_fill_manual(values=pal[1:2]) +
geom_density(show.legend = F, alpha = 1) +
scale_x_continuous(limits = c(0,1), breaks = seq(0,1,0.25)) + scale_y_continuous(labels=scaleFUN) +
theme_bw() + labs(title = "Day 1 to 2") + theme(plot.title = element_text(face = "bold")) + labs(x = "Unadjusted p-values") + labs(y = "Density") +
geom_hline(yintercept = pi0est_humans_given_chimps, size = 2.5) +
geom_hline(yintercept = pi0est_humans, size = 2.5, color = "#00A4F4") +
annotate("text", label= 'bold(bolditalic(hat(pi)[0][", humans"])=="0.21")', parse=TRUE, x=0.2, y=(pi0est_humans+0.32), colour = "#00A4F4", size = 6) + annotate("text", label = 'bold(bolditalic(hat(pi)[0][", shared"])=="0.07")', parse=TRUE, x=0.2, y=(pi0est_humans_given_chimps+0.27), size = 6)
p6_inc_01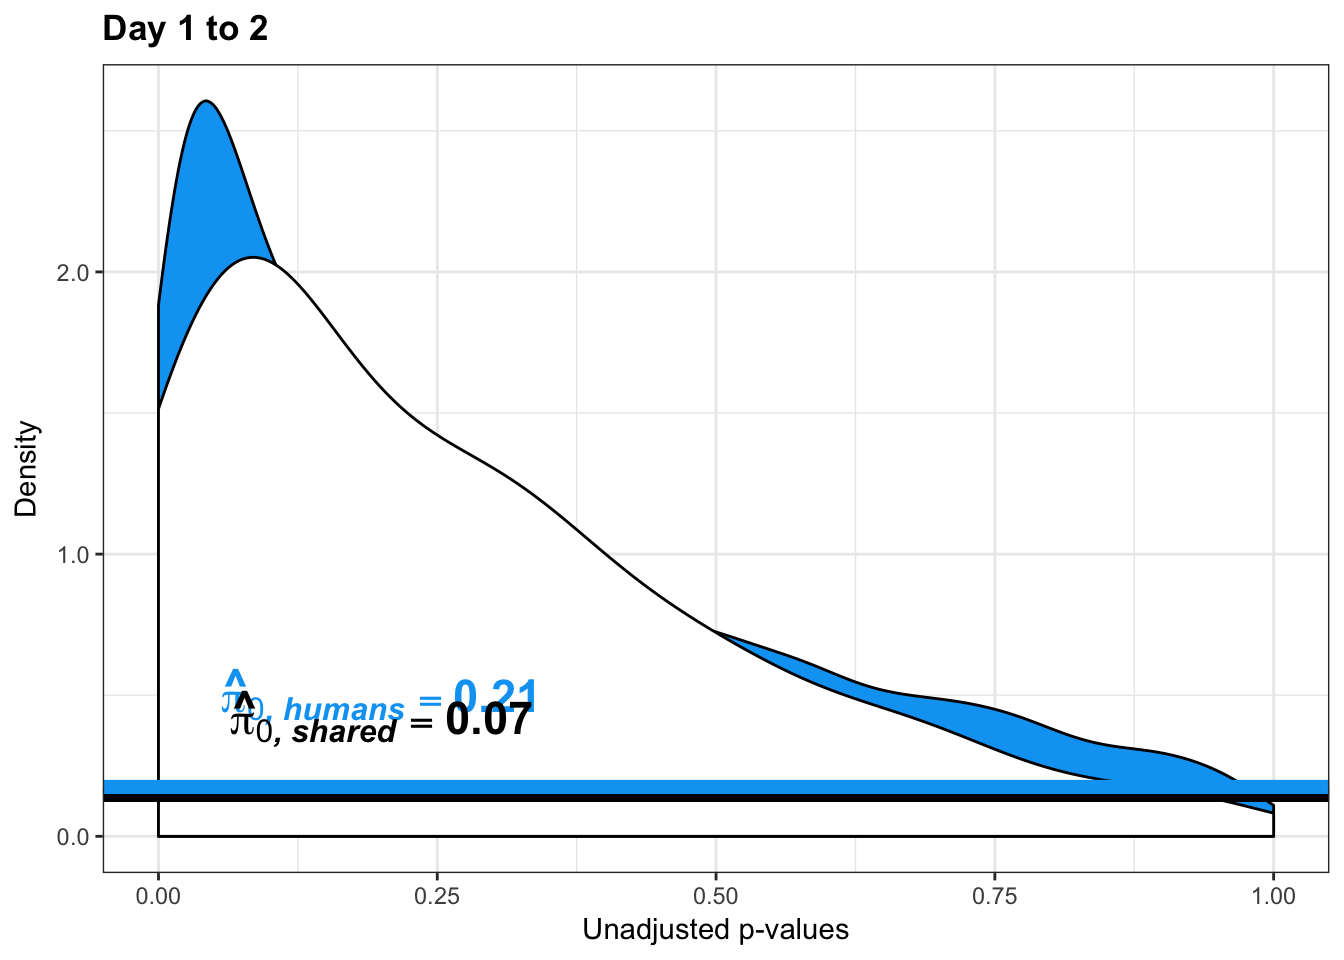
pval_c <- chimps[,1:2]
pval_h <- humans[,1:2]
pval_ch <- rbind(pval_h, pval_c)
resp <- rep(c("Days 1 to 2"), times = nrow(pval_c)+nrow(pval_h))
line1 <- as.data.frame(rep(c("0.21"), times = nrow(pval_h)))
colnames(line1) <- c("line")
line2 <- as.data.frame(rep(c("0.07"), times = nrow(pval_c)))
colnames(line2) <- c("line")
line <- rbind(line1, line2)
figS12A_fig <- cbind(pval_ch, resp, line)
figS12A <- rbind(figS12A, figS12A_fig)# Day 2 to 3
# Obtain pvalues
human_p_values_gen <- as.data.frame(qqplot_inc_day23[1])
shared_p_values_gen <- as.data.frame(qqplot_inc_day23[2])
# Pi_0 estimate for the humans
#pi0est_humans <- qvalue(p= human_p_values_gen, pi0.method="smoother", fdr.level=NULL, robust=TRUE)$pi0
#pi0est_humans
# Pi_1 estimate for the humans
#pi1est_humans <- 1 - pi0est_humans
#pi1est_humans
# Pi_0 estimate for the chimps given significant in the humans
#pi0est_humans_given_chimps <- qvalue(p=shared_p_values_gen, pi0.method="smoother", fdr.level=NULL, robust=TRUE)$pi0
#pi0est_humans_given_chimps
# Pi_1 estimate for the humans
#pi1est_humans_given_chimps <- 1 - pi0est_humans_given_chimps
#pi1est_humans_given_chimps
# Let's overlap the two histograms
labels_h <- array("Human", dim = c(10304,1))
labels_c <- array("Shared (Human|Significant in Chimps)", dim = c(as.data.frame(qqplot_inc_day23[[3]][1]),1))
chimps <- cbind(labels_c, shared_p_values_gen)
colnames(chimps) <- c("Species", "pval")
humans <- cbind(labels_h, human_p_values_gen)
colnames(humans) <- c("Species", "pval")
# Combine the two
all_pval <- rbind(humans[,1:2], chimps[,1:2])
pal <- c("#00A4F4", "white")
p7_inc_01 <- ggplot(all_pval, aes(pval, fill = Species)) + scale_fill_manual(values=pal[1:2]) +
geom_density(show.legend = F, alpha = 1) + scale_y_continuous(labels=scaleFUN) +
scale_x_continuous(limits = c(0,1), breaks = seq(0,1,0.25)) +
theme_bw() + labs(title = "Day 2 to 3") + theme(plot.title = element_text(face = "bold")) +
geom_hline(yintercept = pi0est_humans_given_chimps, size = 2.5) + labs(x = "Unadjusted p-values") + labs(y = "Density") +
geom_hline(yintercept = pi0est_humans, size = 2.5, color = "#00A4F4") +
annotate("text", label= 'bold(bolditalic(hat(pi)[0][", humans"])=="0.85")', parse=TRUE, x=0.2, y=(pi0est_humans+0.05), colour = "#00A4F4", size = 6) + annotate("text", label = 'bold(bolditalic(hat(pi)[0][", shared"])=="1")', parse=TRUE, x=0.2, y=(pi0est_humans_given_chimps+0.07), size = 6)
p7_inc_01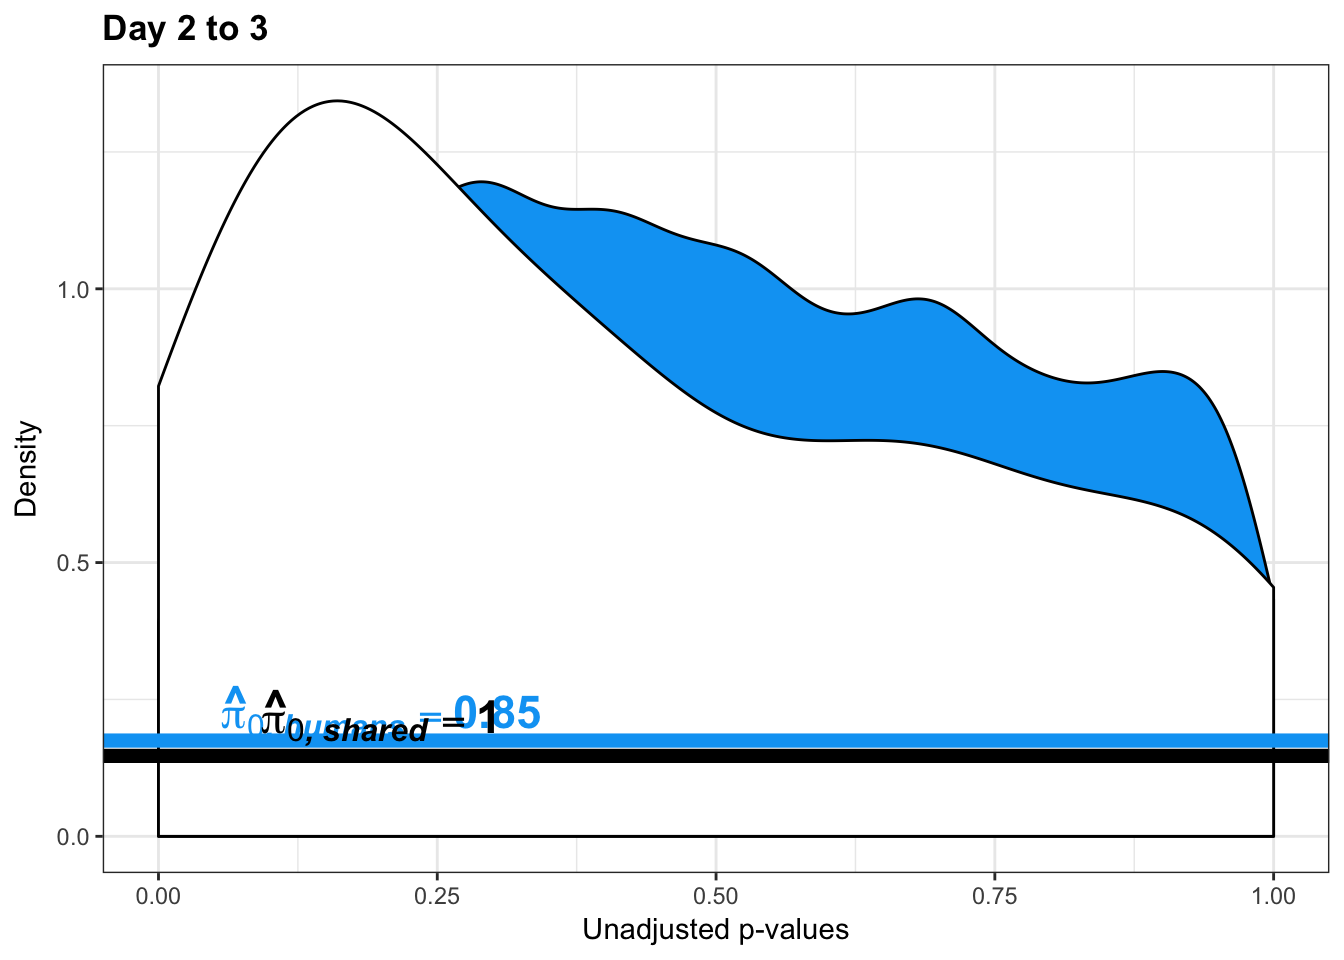
pval_c <- chimps[,1:2]
pval_h <- humans[,1:2]
pval_ch <- rbind(pval_h, pval_c)
resp <- rep(c("Days 2 to 3"), times = nrow(pval_c)+nrow(pval_h))
line1 <- as.data.frame(rep(c("1"), times = nrow(pval_h)))
colnames(line1) <- c("line")
line2 <- as.data.frame(rep(c("0.85"), times = nrow(pval_c)))
colnames(line2) <- c("line")
line <- rbind(line1, line2)
figS12A_fig <- cbind(pval_ch, resp, line)
figS12A <- rbind(figS12A, figS12A_fig)# Day 1 to 3
# Obtain pvalues
human_p_values_gen <- as.data.frame(qqplot_inc_day13[1])
shared_p_values_gen <- as.data.frame(qqplot_inc_day13[2])
# Pi_0 estimate for the humans
pi0est_humans <- qvalue(p= human_p_values_gen, pi0.method="smoother", fdr.level=NULL, robust=TRUE)$pi0
pi0est_humans[1] 0.203399# Pi_1 estimate for the humans
pi1est_humans <- 1 - pi0est_humans
pi1est_humans[1] 0.796601# Pi_0 estimate for the chimps given significant in the humans
pi0est_humans_given_chimps <- qvalue(p=shared_p_values_gen, pi0.method="smoother", fdr.level=NULL, robust=TRUE)$pi0
pi0est_humans_given_chimps[1] 0.1274361# Pi_1 estimate for the humans
pi1est_humans_given_chimps <- 1 - pi0est_humans_given_chimps
pi1est_humans_given_chimps[1] 0.8725639# Let's overlap the two histograms
labels_h <- array("Human", dim = c(10304,1))
labels_c <- array("Shared (Human|Significant in Chimps)", dim = c(as.data.frame(qqplot_inc_day13[[3]][1]),1))
chimps <- cbind(labels_c, shared_p_values_gen)
colnames(chimps) <- c("Species", "pval")
humans <- cbind(labels_h, human_p_values_gen)
colnames(humans) <- c("Species", "pval")
# Combine the two
all_pval <- rbind(humans[,1:2], chimps[,1:2])
pal <- c("#00A4F4", "white")
p8_inc_01 <- ggplot(all_pval, aes(pval, fill = Species)) + scale_fill_manual(values=pal[1:2]) +
geom_density(show.legend = F, alpha = 1) +
scale_x_continuous(limits = c(0,1), breaks = seq(0,1,0.25)) + scale_y_continuous(labels=scaleFUN) +
theme_bw() + labs(title = "Day 1 to 3") + theme(plot.title = element_text(face = "bold")) +
geom_hline(yintercept = pi0est_humans_given_chimps, size = 2.5) + labs(x = "Unadjusted p-values") + labs(y = "Density") + geom_hline(yintercept = pi0est_humans, size = 2.5, color = "#00A4F4") +
annotate("text", label= 'bold(bolditalic(hat(pi)[0][", humans"])=="0.20")', parse=TRUE, x=0.2, y=(pi0est_humans_given_chimps+0.35), colour = "#00A4F4", size = 6) + annotate("text", label = 'bold(bolditalic(hat(pi)[0][", shared"])=="0.13")', parse=TRUE, x=0.2, y=(pi0est_humans_given_chimps+0.2), size = 6)
p8_inc_01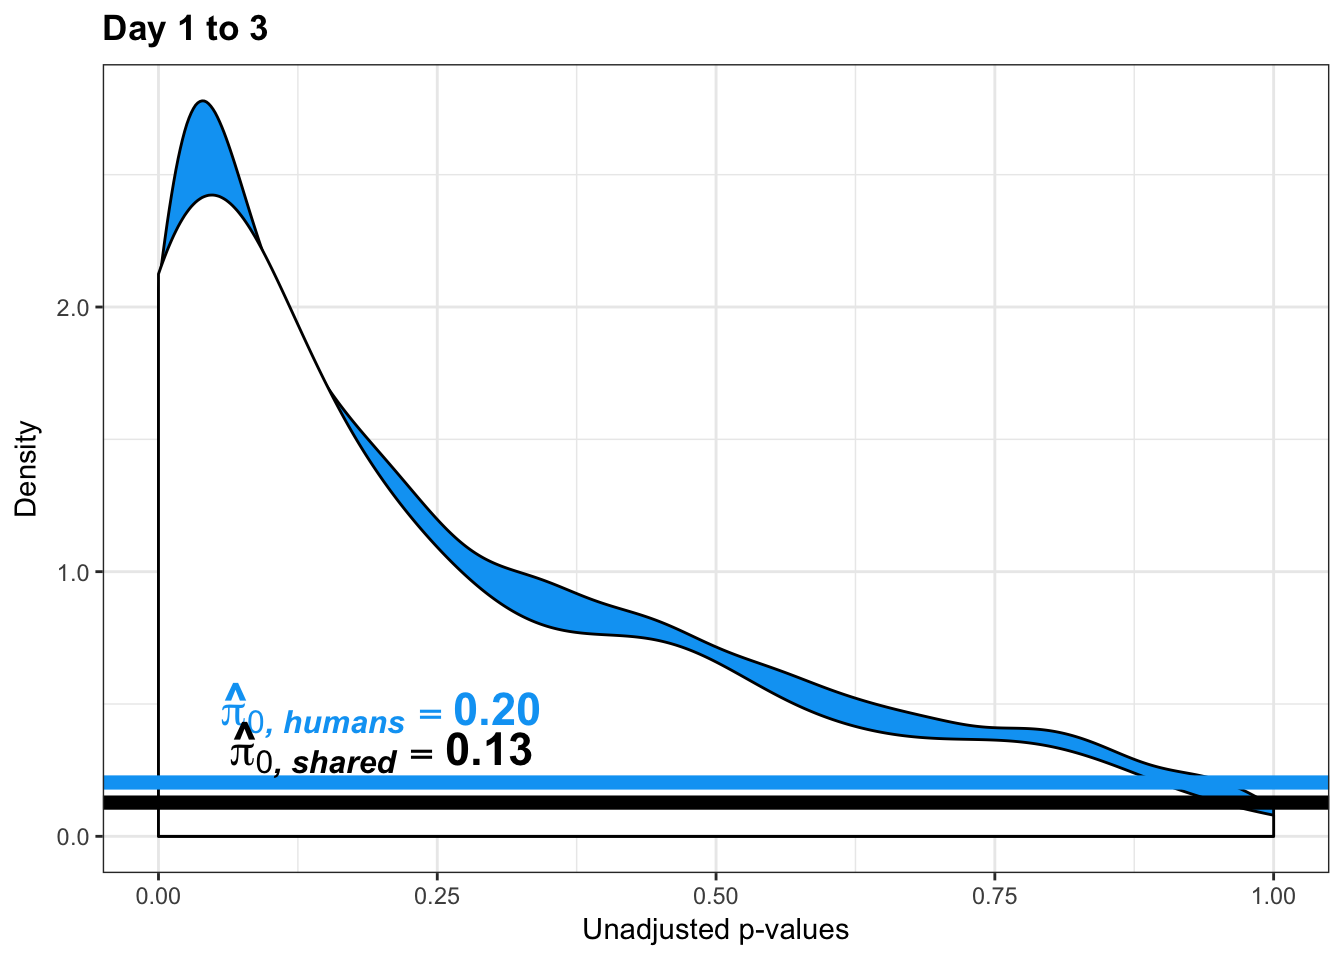
pval_c <- chimps[,1:2]
pval_h <- humans[,1:2]
pval_ch <- rbind(pval_h, pval_c)
resp <- rep(c("Days 1 to 3"), times = nrow(pval_c)+nrow(pval_h))
line1 <- as.data.frame(rep(c("0.20"), times = nrow(pval_h)))
colnames(line1) <- c("line")
line2 <- as.data.frame(rep(c("0.13"), times = nrow(pval_c)))
colnames(line2) <- c("line")
line <- rbind(line1, line2)
figS12A_fig <- cbind(pval_ch, resp, line)
figS12A <- rbind(figS12A, figS12A_fig)
#write.csv(figS12A, "/Users/laurenblake/Dropbox/Endoderm TC/Draft versions/Resubmit1_Genome Biology/Supplemental/Data_figS14K.csv", quote = FALSE, row.names = FALSE)
multiplot(p1_inc_01,p5_inc_01,p2_inc_01,p6_inc_01,p3_inc_01,p7_inc_01,p4_inc_01,p8_inc_01,cols=4)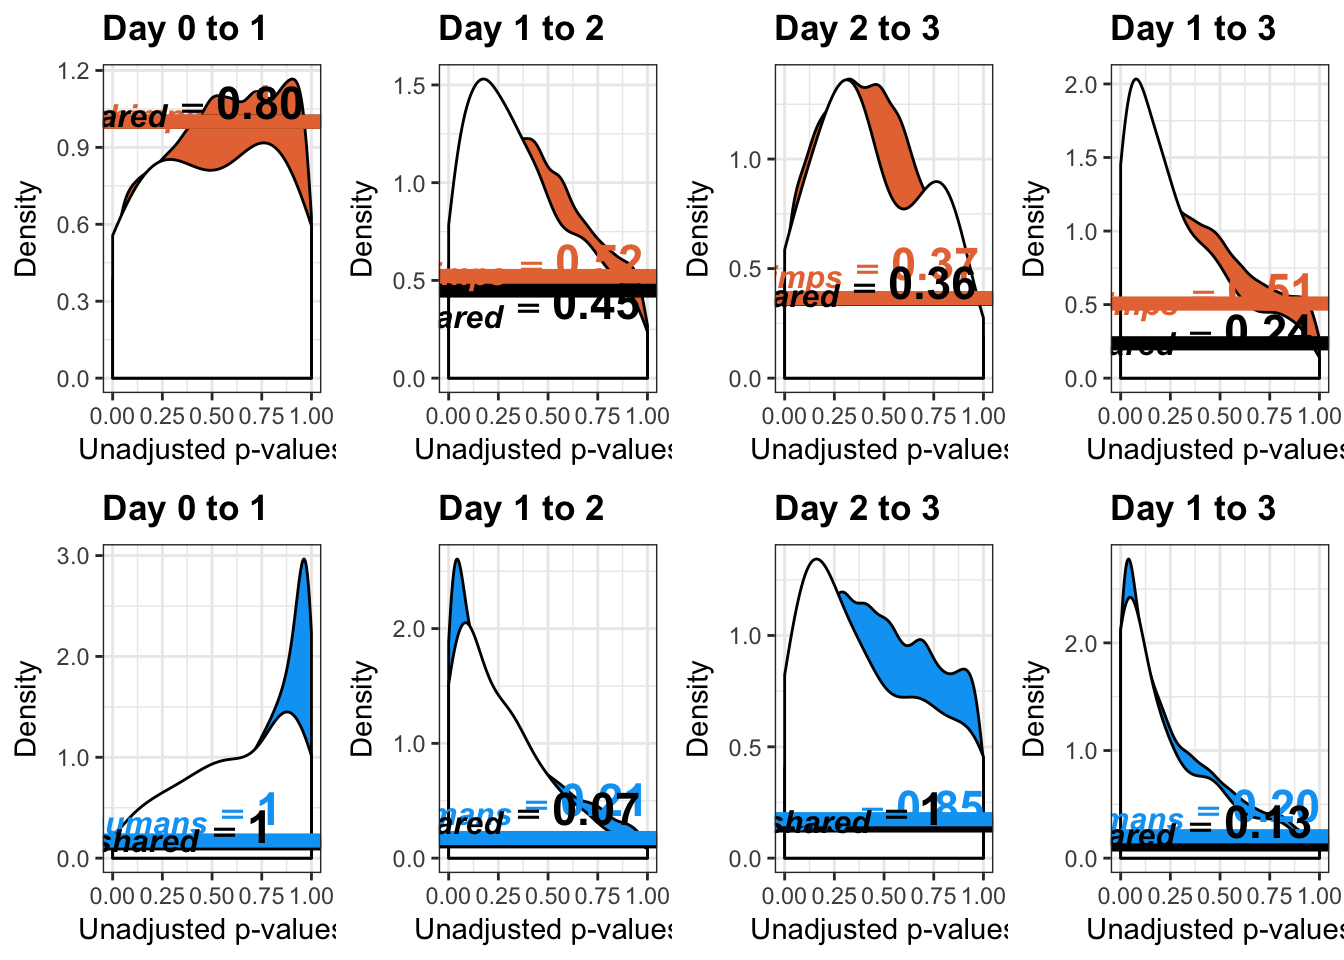
Estimates of pi0 and pi1 for reduction of variation in chimps conditioned on significance in humans (p = 0.1)
Changes in variance in chimp samples (p-value cutoff 0.1)
# Reduction in variance from day 0 to day 1 chimps
qqplot_red_day01 <- find_qqplot_red_chimps(7,10,17,20,1,6,11,16, 0.1)

# Reduction in variance from day 1 to day 2 chimps
qqplot_red_day12 <- find_qqplot_red_chimps(17,20,27,30,11,16,21,26, 0.1)

# Reduction in variance from day 2 to day 3 chimps
qqplot_red_day23 <- find_qqplot_red_chimps(27,30,37,40,21,26,31,36, 0.1)

# Reduction in variance from day 0 to day 2 chimps
qqplot_red_day02 <- find_qqplot_red_chimps(7,10,27,30,1,6,21,26, 0.1)

# Reduction in variance from day 1 to day 3 chimps
qqplot_red_day13 <- find_qqplot_red_chimps(17,20,37,40,11,16,31,36, 0.1)

# Inc. in variance from day 0 to day 1
qqplot_inc_day01 <- find_qqplot_inc_chimps(7,10,17,20,1,6,11,16, 0.1)

# Inc. in variance from day 1 to day 2
qqplot_inc_day12 <- find_qqplot_inc_chimps(17,20,27,30,11,16,21,26, 0.1)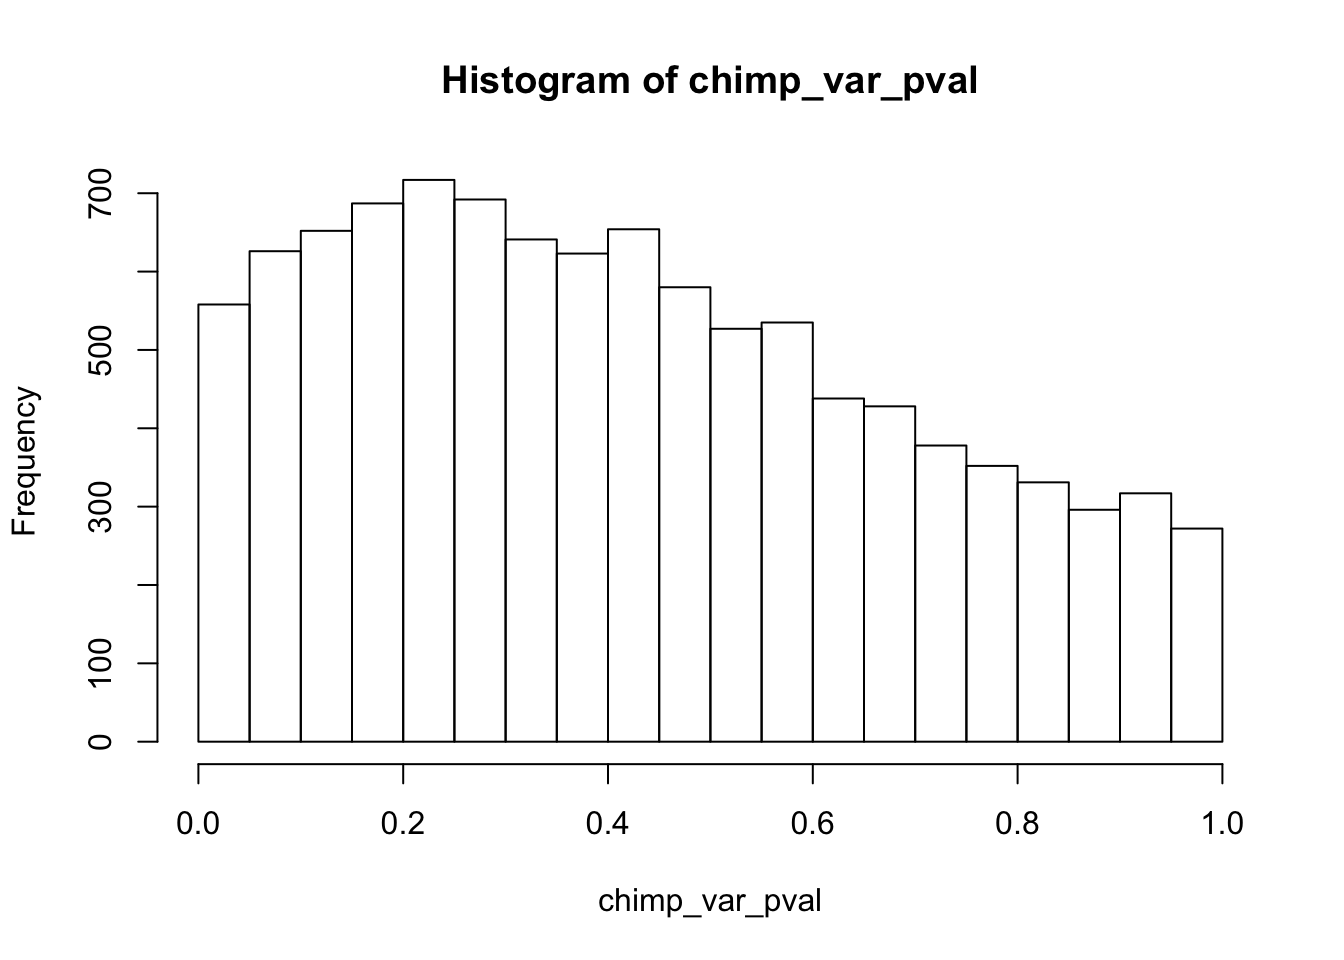

# Inc. in variance from day 2 to day 3
qqplot_inc_day23 <- find_qqplot_inc_chimps(27,30,37,40,21,26,31,36, 0.1)
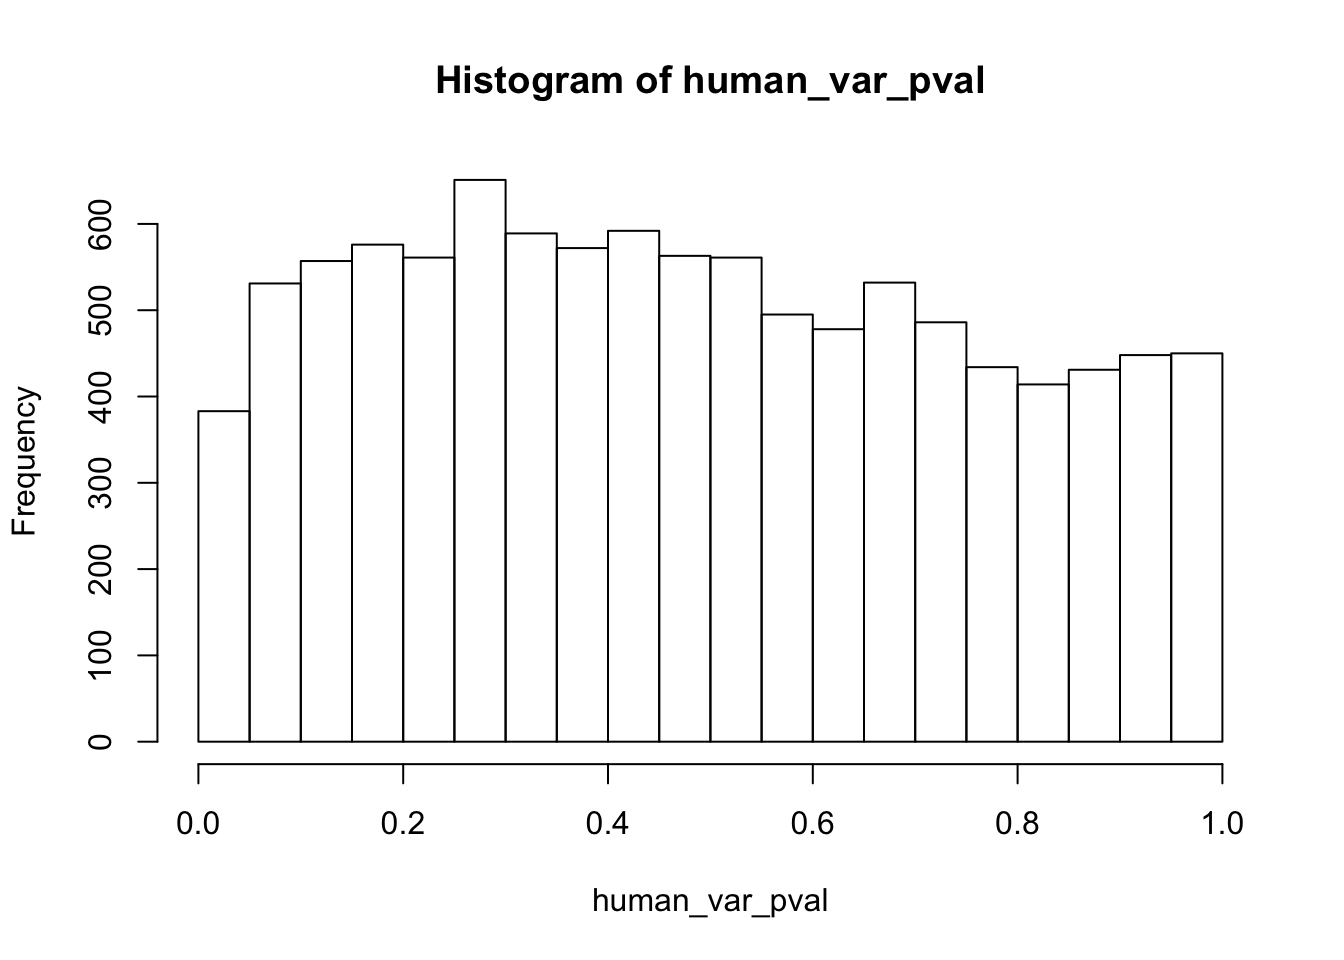
# Inc. in variance from day 0 to day 2
qqplot_inc_day02 <- find_qqplot_inc_chimps(7,10,27,30,1,6,21,26, 0.1)

# Inc. in variance from day 1 to day 3
qqplot_inc_day13 <- find_qqplot_inc_chimps(17,20,37,40,11,16,31,36, 0.1)

Estimates of pi0 and pi1 for reduction of variation in chimps conditioned on significance in humans (p = 0.1)
library("qvalue")
################ REDUCTION IN VARIATION FOR CHIMPS (p = 0.1) ################
# Day 0 to 1
# Obtain pvalues
chimp_p_values_gen <- as.data.frame(qqplot_red_day01[1])
shared_p_values_gen <- as.data.frame(qqplot_red_day01[2])
# Pi_0 estimate for the chimps
pi0est_chimps <- qvalue(p=chimp_p_values_gen, pi0.method="smoother", fdr.level=NULL, robust=TRUE)$pi0
pi0est_chimps[1] 0.7259161# Pi_1 estimate for the chimps
pi1est_chimps <- 1 - pi0est_chimps
pi1est_chimps[1] 0.2740839# Pi_0 estimate for the chimps given significant in the humans
pi0est_chimps_given_humans <- qvalue(p=shared_p_values_gen, pi0.method="smoother", fdr.level=NULL, robust=TRUE)$pi0
pi0est_chimps_given_humans[1] 0.5197874# Pi_1 estimate for the humans
pi1est_chimps_given_humans <- 1 - pi0est_chimps_given_humans
pi1est_chimps_given_humans[1] 0.4802126# Let's overlap the two histograms
labels_c <- array("Chimpanzee", dim = c(10304,1))
labels_h <- array("Shared (Chimpanzee|Significant in Humans)", dim = c(as.data.frame(qqplot_red_day01[[3]][2]),1))
chimps <- cbind(labels_c, chimp_p_values_gen)
colnames(chimps) <- c("Species", "pval")
humans <- cbind(labels_h, shared_p_values_gen)
colnames(humans) <- c("Species", "pval")
# Combine the two
all_pval <- rbind(chimps[,1:2], humans[,1:2])
pal <- c("#00A4F4", "#E77642", "white")
p1_10 <- ggplot(all_pval, aes(pval, fill = Species)) + scale_fill_manual(values=pal[2:3]) +
geom_density(show.legend = F, alpha = 1) +
scale_x_continuous(limits = c(0,1), breaks = seq(0,1,0.25)) +
theme_bw() + labs(title = "Day 0 to 1") + theme(plot.title = element_text(face = "bold")) + labs(x = "Unadjusted p-values") + labs(y = "Density") + scale_y_continuous(labels=scaleFUN) +
geom_hline(yintercept = pi0est_chimps_given_humans, size = 2.5) +
geom_hline(yintercept = pi0est_chimps, size = 2.5, color = "#E77642") +
annotate("text", label= 'bold(bolditalic(hat(pi)[0][", chimps"])=="0.73")', parse=TRUE, x=0.2, y=(pi0est_chimps+0.07), colour = "#E77642", size = 6) + annotate("text", label = 'bold(bolditalic(hat(pi)[0][", shared"])=="0.52")', parse=TRUE, x=0.2, y=(pi0est_chimps_given_humans+0.07), size = 6)
p1_10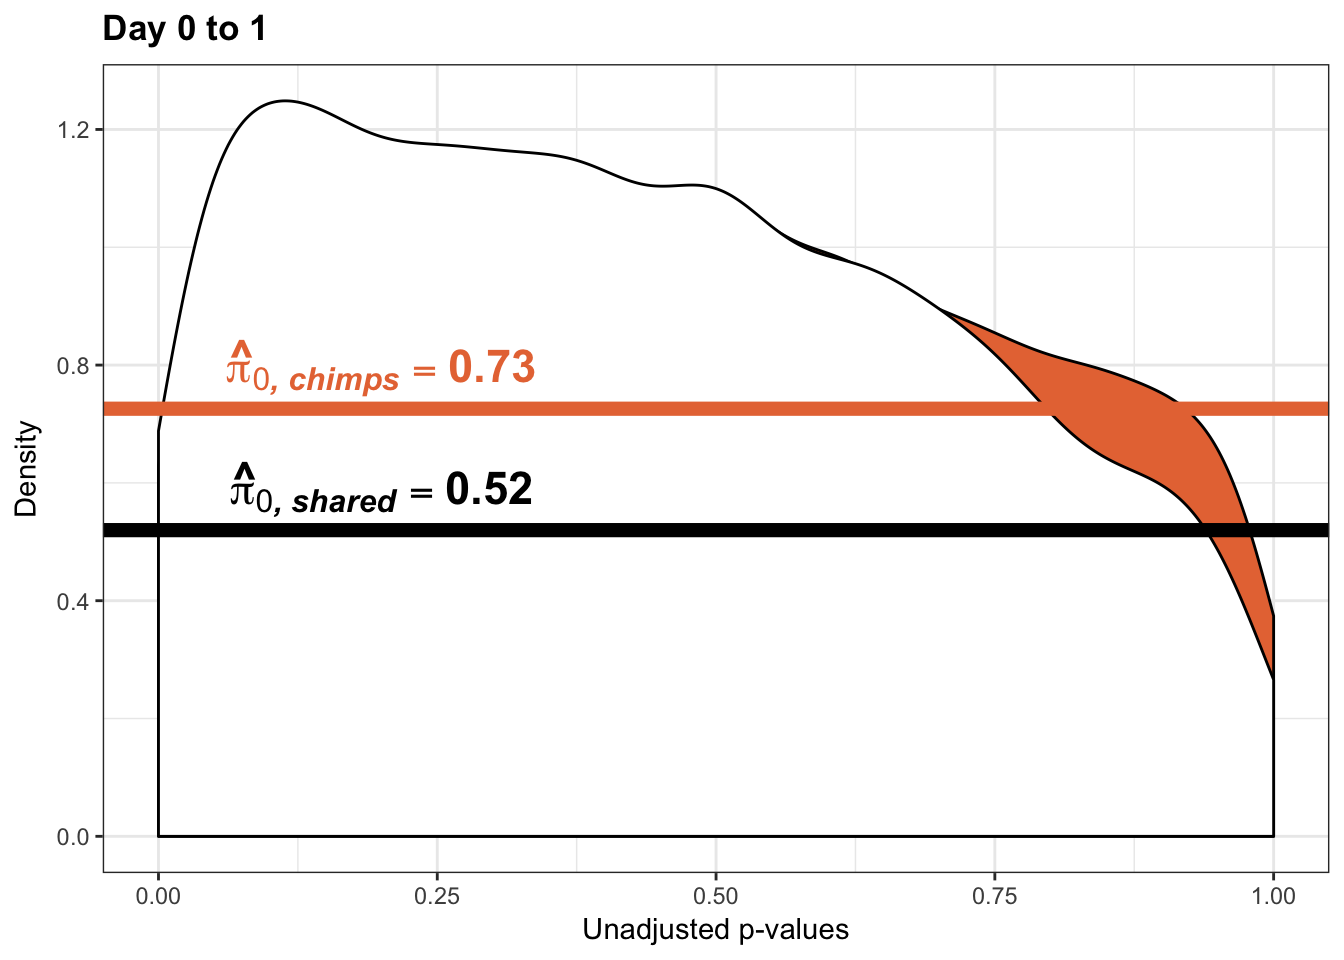
pval_c <- chimps[,1:2]
pval_h <- humans[,1:2]
pval_ch <- rbind(pval_c, pval_h)
resp <- rep(c("Days 0 to 1"), times = nrow(pval_c)+nrow(pval_h))
line1 <- as.data.frame(rep(c("0.73"), times = nrow(pval_c)))
colnames(line1) <- c("line")
line2 <- as.data.frame(rep(c("0.52"), times = nrow(pval_h)))
colnames(line2) <- c("line")
line <- rbind(line1, line2)
figS12A <- cbind(pval_ch, resp, line)
# Day 1 to 2
# Obtain pvalues
chimp_p_values_gen <- as.data.frame(qqplot_red_day12[1])
shared_p_values_gen <- as.data.frame(qqplot_red_day12[2])
# Pi_0 estimate for the chimps
pi0est_chimps <- qvalue(p=chimp_p_values_gen, pi0.method="smoother", fdr.level=NULL, robust=TRUE)$pi0
pi0est_chimps[1] 1# Pi_1 estimate for the chimps
pi1est_chimps <- 1 - pi0est_chimps
pi1est_chimps[1] 0# Pi_0 estimate for the chimps given significant in the humans
pi0est_chimps_given_humans <- qvalue(p=shared_p_values_gen, pi0.method="smoother", fdr.level=NULL, robust=TRUE)$pi0
pi0est_chimps_given_humans[1] 0.7243204# Pi_1 estimate for the humans
pi1est_chimps_given_humans <- 1 - pi0est_chimps_given_humans
pi1est_chimps_given_humans[1] 0.2756796# Let's overlap the two histograms
labels_c <- array("Chimpanzee", dim = c(10304,1))
labels_h <- array("Shared (Chimpanzee|Significant in Humans)", dim = c(as.data.frame(qqplot_red_day12[[3]][2]),1))
chimps <- cbind(labels_c, chimp_p_values_gen)
colnames(chimps) <- c("Species", "pval")
humans <- cbind(labels_h, shared_p_values_gen)
colnames(humans) <- c("Species", "pval")
# Combine the two
all_pval <- rbind(chimps[,1:2], humans[,1:2])
pal <- c("#00A4F4", "#E77642", "white")
p2_10 <- ggplot(all_pval, aes(pval, fill = Species)) + scale_fill_manual(values=pal[2:3]) +
geom_density(show.legend = F, alpha = 1) + scale_y_continuous(labels=scaleFUN) +
scale_x_continuous(limits = c(0,1), breaks = seq(0,1,0.25)) +
theme_bw() + labs(title = "Day 1 to 2") + theme(plot.title = element_text(face = "bold")) + labs(x = "Unadjusted p-values") + labs(y = "Density") +
geom_hline(yintercept = pi0est_chimps_given_humans, size = 2.5) +
geom_hline(yintercept = pi0est_chimps, size = 2.5, color = "#E77642") +
annotate("text", label= 'bold(bolditalic(hat(pi)[0][", chimps"])=="1")', parse=TRUE, x=0.5, y=(pi0est_chimps+0.07), colour = "#E77642", size = 6) + annotate("text", label = 'bold(bolditalic(hat(pi)[0][", shared"])=="0.72")', parse=TRUE, x=0.5, y=(pi0est_chimps_given_humans+0.07), size = 6)
p2_10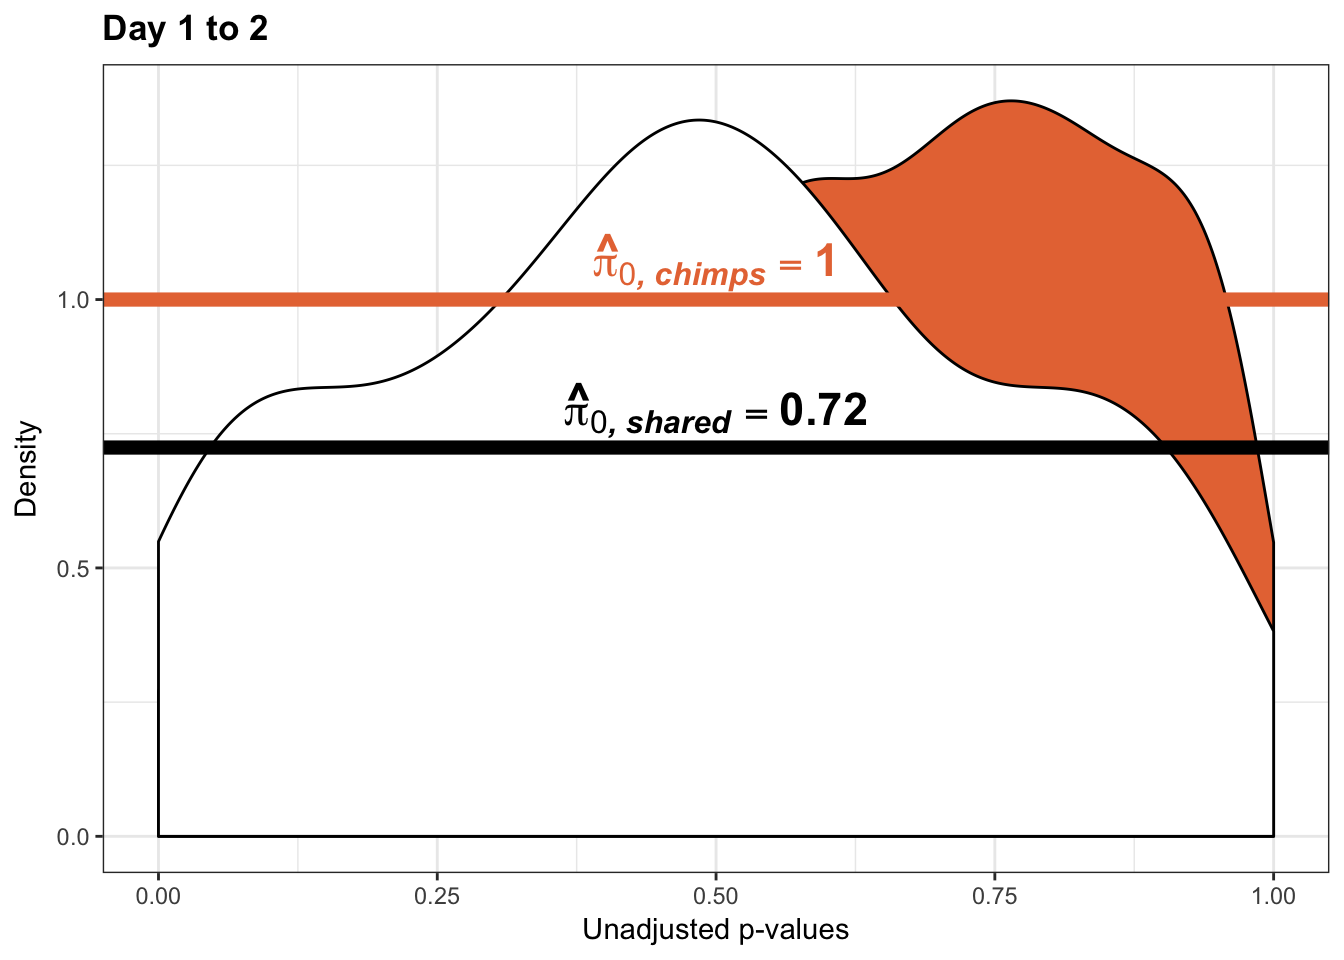
pval_c <- chimps[,1:2]
pval_h <- humans[,1:2]
pval_ch <- rbind(pval_c, pval_h)
resp <- rep(c("Days 1 to 2"), times = nrow(pval_c)+nrow(pval_h))
line1 <- as.data.frame(rep(c("NA"), times = nrow(pval_c)))
colnames(line1) <- c("line")
line2 <- as.data.frame(rep(c("NA"), times = nrow(pval_h)))
colnames(line2) <- c("line")
line <- rbind(line1, line2)
figS12A_fig <- cbind(pval_ch, resp, line)
figS12A <- rbind(figS12A, figS12A_fig)
# Day 2 to 3
# Obtain pvalues
chimp_p_values_gen <- as.data.frame(qqplot_red_day23[1])
shared_p_values_gen <- as.data.frame(qqplot_red_day23[2])
# Pi_0 estimate for the chimps
pi0est_chimps <- qvalue(p=chimp_p_values_gen, pi0.method="smoother", fdr.level=NULL, robust=TRUE)$pi0
pi0est_chimps[1] 0.903342# Pi_1 estimate for the chimps
pi1est_chimps <- 1 - pi0est_chimps
pi1est_chimps[1] 0.09665802# Pi_0 estimate for the chimps given significant in the humans
pi0est_chimps_given_humans <- qvalue(p=shared_p_values_gen, pi0.method="smoother", fdr.level=NULL, robust=TRUE)$pi0
pi0est_chimps_given_humans[1] 1# Pi_1 estimate for the humans
pi1est_chimps_given_humans <- 1 - pi0est_chimps_given_humans
pi1est_chimps_given_humans[1] 0# Let's overlap the two histograms
labels_c <- array("Chimpanzee", dim = c(10304,1))
labels_h <- array("Shared (Chimpanzee|Significant in Humans)", dim = c(as.data.frame(qqplot_red_day23[[3]][2]),1))
chimps <- cbind(labels_c, chimp_p_values_gen)
colnames(chimps) <- c("Species", "pval")
humans <- cbind(labels_h, shared_p_values_gen)
colnames(humans) <- c("Species", "pval")
# Combine the two
all_pval <- rbind(chimps[,1:2], humans[,1:2])
pal <- c("#00A4F4", "#E77642", "white")
p3_10 <- ggplot(all_pval, aes(pval, fill = Species)) + scale_fill_manual(values=pal[2:3]) +
geom_density(show.legend = F, alpha = 1) +
scale_x_continuous(limits = c(0,1), breaks = seq(0,1,0.25)) +
theme_bw() + labs(title = "Day 2 to 3") + theme(plot.title = element_text(face = "bold")) + labs(x = "Unadjusted p-values") + labs(y = "Density") +
geom_hline(yintercept = pi0est_chimps_given_humans, size = 2.5) +
geom_hline(yintercept = pi0est_chimps, size = 2.5, color = "#E77642") +
annotate("text", label= 'bold(bolditalic(hat(pi)[0][", chimps"])=="0.9")', parse=TRUE, x=0.8, y=(pi0est_chimps-0.07), colour = "#E77642", size = 6) + annotate("text", label = 'bold(bolditalic(hat(pi)[0][", shared"])=="1")', parse=TRUE, x=0.8, y=(pi0est_chimps_given_humans+0.07), size = 6)
p3_10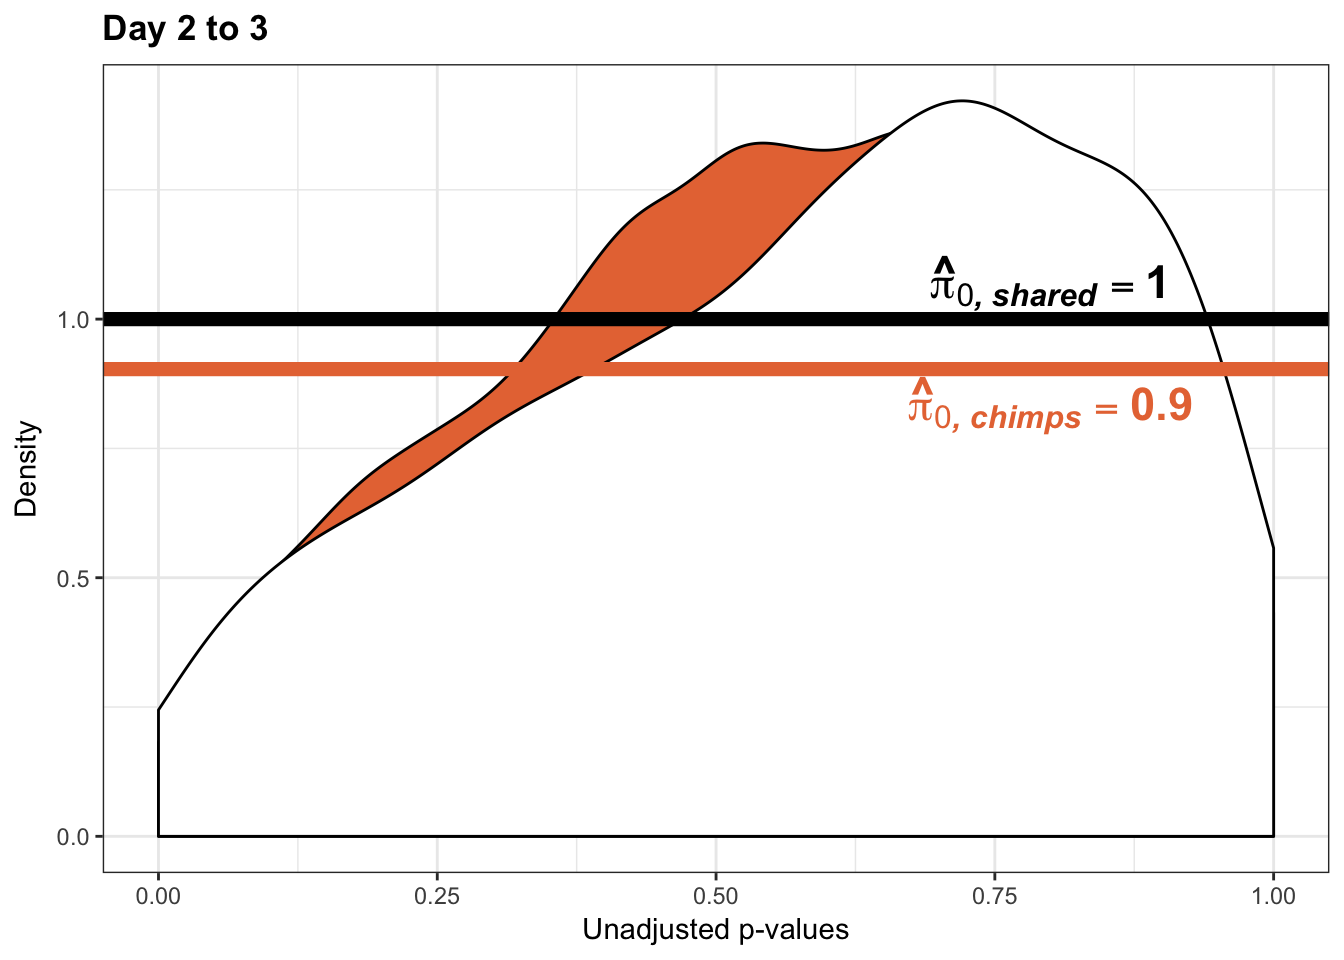
pval_c <- chimps[,1:2]
pval_h <- humans[,1:2]
pval_ch <- rbind(pval_c, pval_h)
resp <- rep(c("Days 2 to 3"), times = nrow(pval_c)+nrow(pval_h))
line1 <- as.data.frame(rep(c("NA"), times = nrow(pval_c)))
colnames(line1) <- c("line")
line2 <- as.data.frame(rep(c("NA"), times = nrow(pval_h)))
colnames(line2) <- c("line")
line <- rbind(line1, line2)
figS12A_fig <- cbind(pval_ch, resp, line)
figS12A <- rbind(figS12A, figS12A_fig)
# Day 1 to 3
# Obtain pvalues
chimp_p_values_gen <- as.data.frame(qqplot_red_day13[1])
shared_p_values_gen <- as.data.frame(qqplot_red_day13[2])
# Pi_0 estimate for the chimps
pi0est_chimps <- qvalue(p=chimp_p_values_gen, pi0.method="smoother", fdr.level=NULL, robust=TRUE)$pi0
pi0est_chimps[1] 1# Pi_1 estimate for the chimps
pi1est_chimps <- 1 - pi0est_chimps
pi1est_chimps[1] 0# Pi_0 estimate for the chimps given significant in the humans
pi0est_chimps_given_humans <- qvalue(p=shared_p_values_gen, pi0.method="smoother", fdr.level=NULL, robust=TRUE)$pi0
pi0est_chimps_given_humans[1] 1# Pi_1 estimate for the humans
pi1est_chimps_given_humans <- 1 - pi0est_chimps_given_humans
pi1est_chimps_given_humans[1] 0# Let's overlap the two histograms
labels_c <- array("Chimpanzee", dim = c(10304,1))
labels_h <- array("Shared (Chimpanzee|Significant in Humans)", dim = c(as.data.frame(qqplot_red_day13[[3]][2]),1))
chimps <- cbind(labels_c, chimp_p_values_gen)
colnames(chimps) <- c("Species", "pval")
humans <- cbind(labels_h, shared_p_values_gen)
colnames(humans) <- c("Species", "pval")
# Combine the two
all_pval <- rbind(chimps[,1:2], humans[,1:2])
pal <- c("#00A4F4", "#E77642", "white")
p4_10 <- ggplot(all_pval, aes(pval, fill = Species)) + scale_fill_manual(values=pal[2:3]) +
geom_density(show.legend = F, alpha = 1) +
scale_x_continuous(limits = c(0,1), breaks = seq(0,1,0.25)) +
theme_bw() + labs(title = "Day 1 to 3") + theme(plot.title = element_text(face = "bold")) + labs(x = "Unadjusted p-values") + labs(y = "Density") + scale_y_continuous(labels=scaleFUN) +
geom_hline(yintercept = pi0est_chimps_given_humans, size = 2.5) +
geom_hline(yintercept = pi0est_chimps, size = 2.5, color = "black") +
annotate("text", label= 'bold(bolditalic(hat(pi)[0][", chimps"])=="1")', parse=TRUE, x=0.2, y=(pi0est_chimps+0.17), colour = "#E77642", size = 6) + annotate("text", label = 'bold(bolditalic(hat(pi)[0][", shared"])=="1")', parse=TRUE, x=0.2, y=(pi0est_chimps_given_humans+0.07), size = 6)
p4_10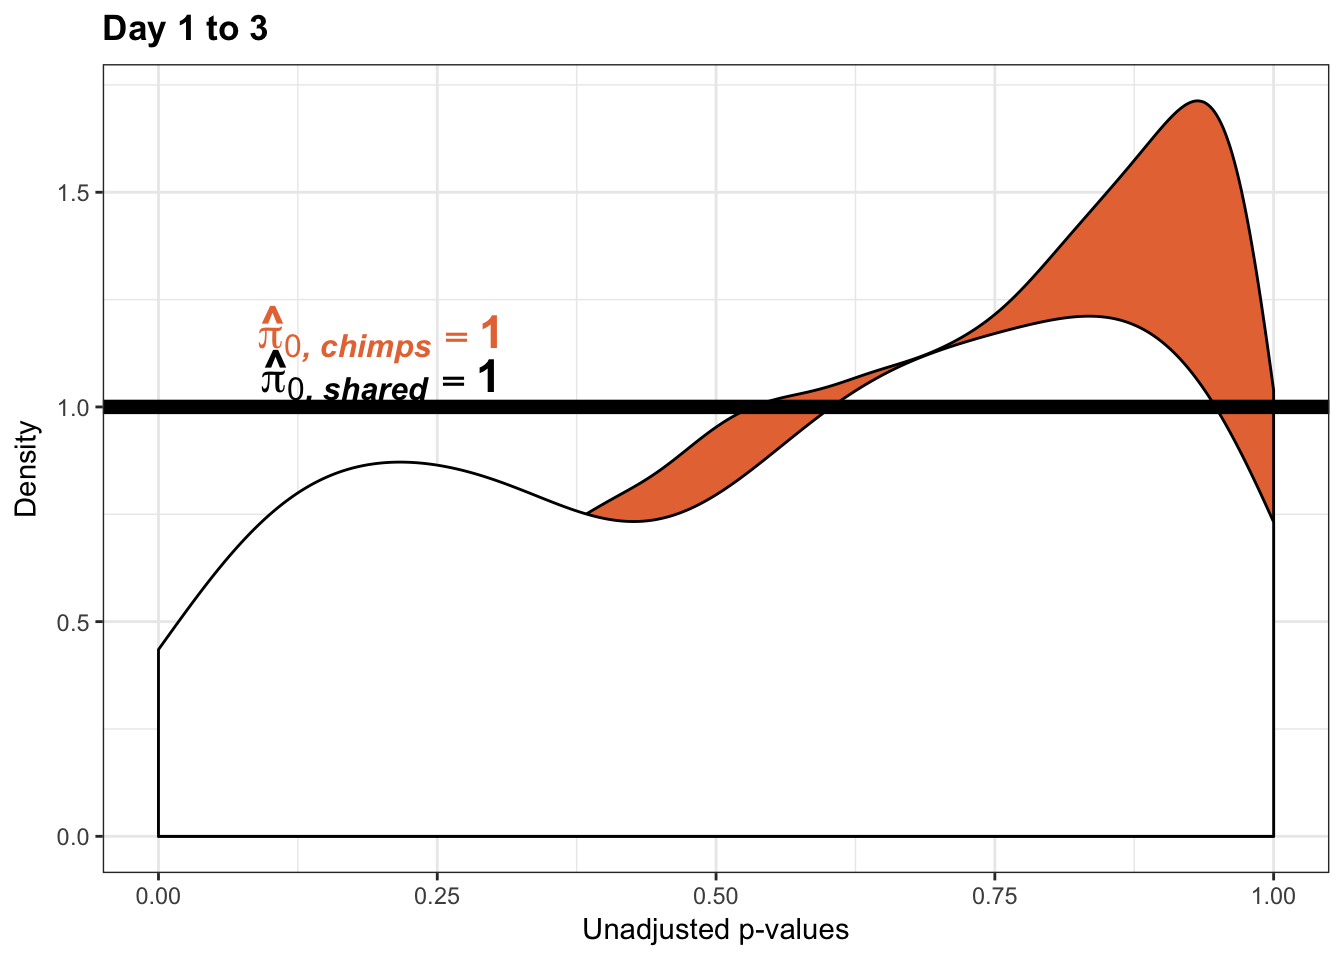
pval_c <- chimps[,1:2]
pval_h <- humans[,1:2]
pval_ch <- rbind(pval_c, pval_h)
resp <- rep(c("Days 1 to 3"), times = nrow(pval_c)+nrow(pval_h))
line1 <- as.data.frame(rep(c("NA"), times = nrow(pval_c)))
colnames(line1) <- c("line")
line2 <- as.data.frame(rep(c("NA"), times = nrow(pval_h)))
colnames(line2) <- c("line")
line <- rbind(line1, line2)
figS12A_fig <- cbind(pval_ch, resp, line)
figS12A <- rbind(figS12A, figS12A_fig)
#write.csv(figS12A, "/Users/laurenblake/Dropbox/Endoderm TC/Draft versions/Resubmit1_Genome Biology/Supplemental/Data_figS14F.csv", quote = FALSE, row.names = FALSE)Estimates of pi0 and pi1 for increase of variation in chimps conditioned on significance in humans (p = 0.10)
############### Increase in Variation ############
# Day 0 to 1
# Obtain pvalues
chimp_p_values_gen <- as.data.frame(qqplot_inc_day01[1])
shared_p_values_gen <- as.data.frame(qqplot_inc_day01[2])
# Pi_0 estimate for the chimps
pi0est_chimps <- qvalue(p=chimp_p_values_gen, pi0.method="smoother", fdr.level=NULL, robust=TRUE)$pi0
pi0est_chimps[1] 1# Pi_1 estimate for the chimps
pi1est_chimps <- 1 - pi0est_chimps
pi1est_chimps[1] 0# Pi_0 estimate for the chimps given significant in the humans
pi0est_chimps_given_humans <- qvalue(p=shared_p_values_gen, pi0.method="smoother", fdr.level=NULL, robust=TRUE)$pi0
pi0est_chimps_given_humans[1] 0.9219031# Pi_1 estimate for the humans
pi1est_chimps_given_humans <- 1 - pi0est_chimps_given_humans
pi1est_chimps_given_humans[1] 0.07809693# Let's overlap the two histograms
labels_c <- array("Chimpanzee", dim = c(10304,1))
labels_h <- array("Shared (Chimpanzee|Significant in Humans)", dim = c(nrow(shared_p_values_gen[1]),1))
chimps <- cbind(labels_c, chimp_p_values_gen)
colnames(chimps) <- c("Species", "pval")
humans <- cbind(labels_h, shared_p_values_gen)
colnames(humans) <- c("Species", "pval")
# Combine the two
all_pval <- rbind(chimps[,1:2], humans[,1:2])
pal <- c("#00A4F4", "#E77642", "white")
p1_inc_10 <- ggplot(all_pval, aes(pval, fill = Species)) + scale_fill_manual(values=pal[2:3]) +
geom_density(show.legend = F, alpha = 1) +
scale_x_continuous(limits = c(0,1), breaks = seq(0,1,0.25)) +
theme_bw() + labs(title = "Day 0 to 1") + theme(plot.title = element_text(face = "bold")) + labs(x = "Unadjusted p-values") + labs(y = "Density") + scale_y_continuous(labels=scaleFUN) +
geom_hline(yintercept = pi0est_chimps_given_humans, size = 2.5) +
geom_hline(yintercept = pi0est_chimps, size = 2.5, color = "#E77642") +
annotate("text", label= 'bold(bolditalic(hat(pi)[0][", chimps"])=="1")', parse=TRUE, x=0.2, y=(pi0est_chimps+0.07), colour = "#E77642", size = 6) + annotate("text", label = 'bold(bolditalic(hat(pi)[0][", shared"])=="0.92")', parse=TRUE, x=0.2, y=(pi0est_chimps_given_humans-0.07), size = 6)
p1_inc_10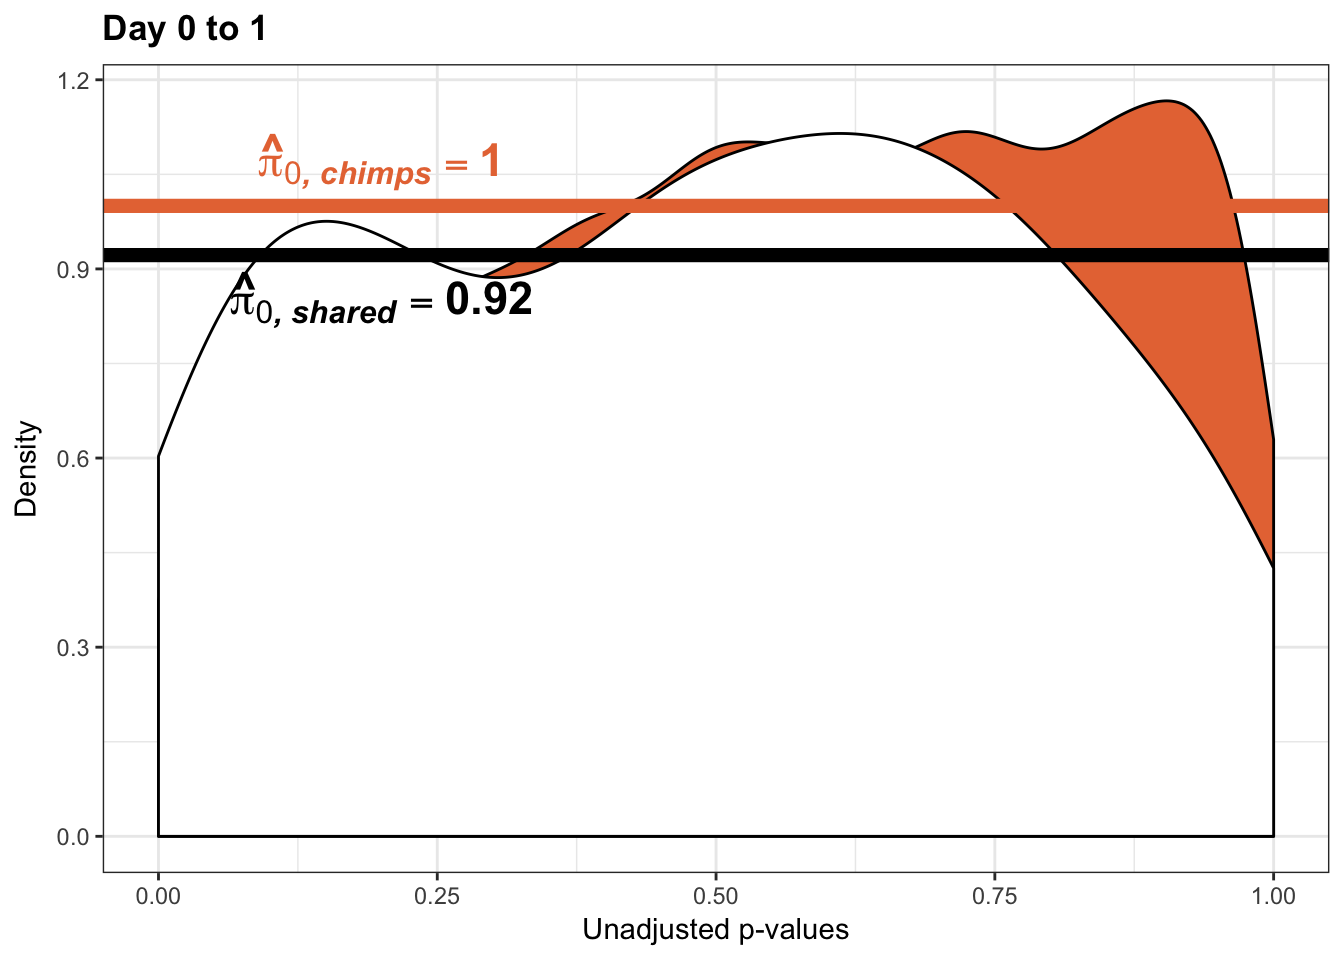
pval_c <- chimps[,1:2]
pval_h <- humans[,1:2]
pval_ch <- rbind(pval_c, pval_h)
resp <- rep(c("Days 0 to 1"), times = nrow(pval_c)+nrow(pval_h))
line1 <- as.data.frame(rep(c("NA"), times = nrow(pval_c)))
colnames(line1) <- c("line")
line2 <- as.data.frame(rep(c("NA"), times = nrow(pval_h)))
colnames(line2) <- c("line")
line <- rbind(line1, line2)
figS12A <- cbind(pval_ch, resp, line)
# Day 1 to 2
# Obtain pvalues
chimp_p_values_gen <- as.data.frame(qqplot_inc_day12[1])
shared_p_values_gen <- as.data.frame(qqplot_inc_day12[2])
# Pi_0 estimate for the chimps
pi0est_chimps <- qvalue(p=chimp_p_values_gen, pi0.method="smoother", fdr.level=NULL, robust=TRUE)$pi0
pi0est_chimps[1] 0.5221613# Pi_1 estimate for the chimps
pi1est_chimps <- 1 - pi0est_chimps
pi1est_chimps[1] 0.4778387# Pi_0 estimate for the chimps given significant in the humans
pi0est_chimps_given_humans <- qvalue(p=shared_p_values_gen, pi0.method="smoother", fdr.level=NULL, robust=TRUE)$pi0
pi0est_chimps_given_humans[1] 0.3286427# Pi_1 estimate for the humans
pi1est_chimps_given_humans <- 1 - pi0est_chimps_given_humans
pi1est_chimps_given_humans[1] 0.6713573# Let's overlap the two histograms
labels_c <- array("Chimpanzee", dim = c(10304,1))
labels_h <- array("Shared (Chimpanzee|Significant in Humans)", dim = c(as.data.frame(qqplot_inc_day12[[3]][2]),1))
chimps <- cbind(labels_c, chimp_p_values_gen)
colnames(chimps) <- c("Species", "pval")
humans <- cbind(labels_h, shared_p_values_gen)
colnames(humans) <- c("Species", "pval")
# Combine the two
all_pval <- rbind(chimps[,1:2], humans[,1:2])
pal <- c("#00A4F4", "#E77642", "white")
p2_inc_10 <- ggplot(all_pval, aes(pval, fill = Species)) + scale_fill_manual(values=pal[2:3]) +
geom_density(show.legend = F, alpha = 1) +
scale_x_continuous(limits = c(0,1), breaks = seq(0,1,0.25)) +
theme_bw() + labs(title = "Day 1 to 2") + theme(plot.title = element_text(face = "bold")) + labs(x = "Unadjusted p-values") + labs(y = "Density") +
geom_hline(yintercept = pi0est_chimps_given_humans, size = 2.5) + scale_y_continuous(labels=scaleFUN) +
geom_hline(yintercept = pi0est_chimps, size = 2.5, color = "#E77642") +
annotate("text", label= 'bold(bolditalic(hat(pi)[0][", chimps"])=="0.52")', parse=TRUE, x=0.2, y=(pi0est_chimps+0.07), colour = "#E77642", size = 6) + annotate("text", label = 'bold(bolditalic(hat(pi)[0][", shared"])=="0.33")', parse=TRUE, x=0.2, y=(pi0est_chimps_given_humans+0.07), size = 6)
p2_inc_10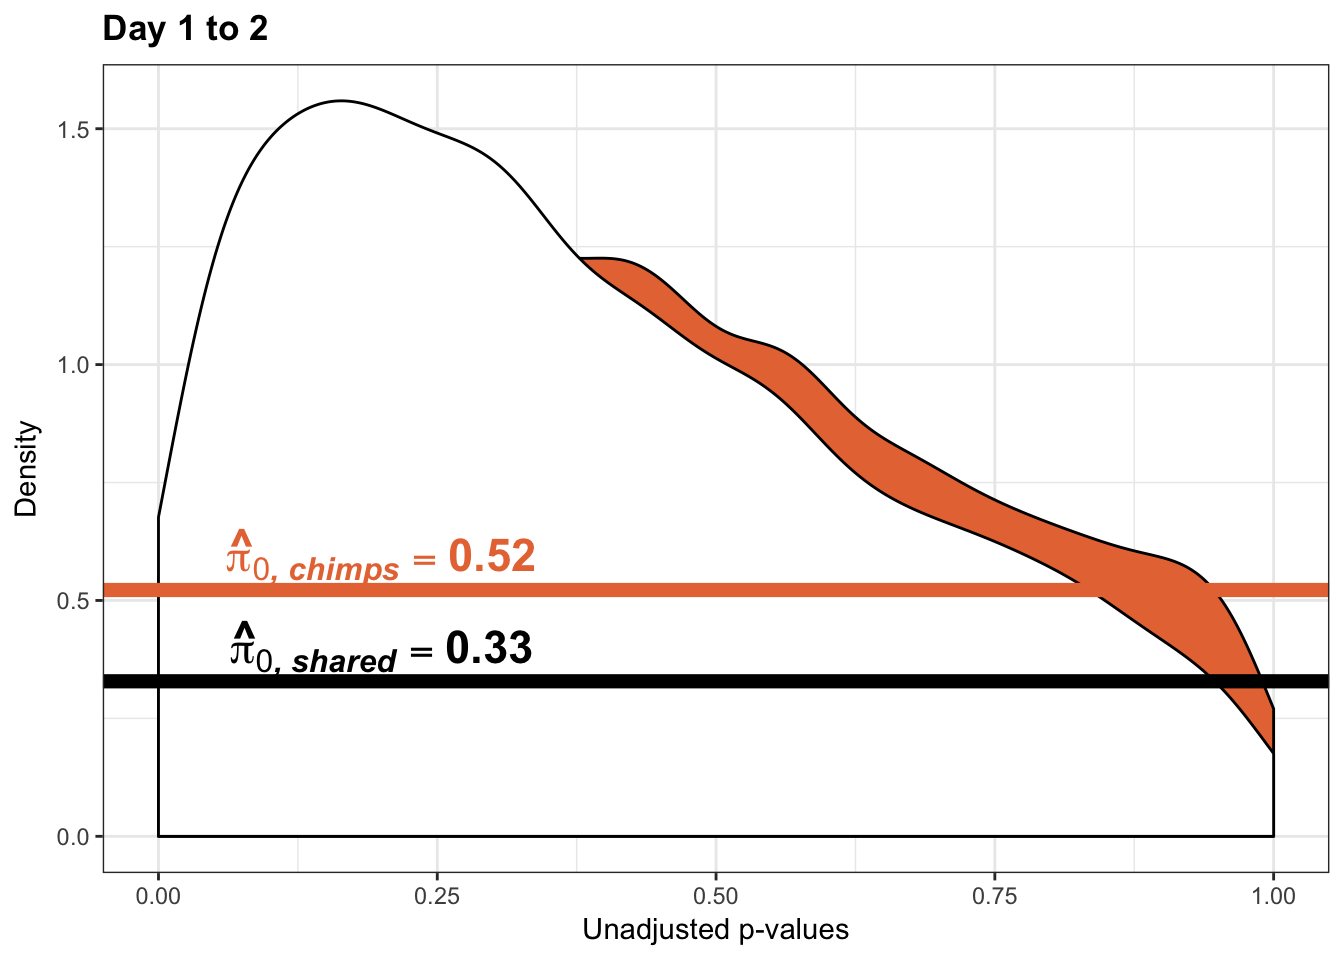
pval_c <- chimps[,1:2]
pval_h <- humans[,1:2]
pval_ch <- rbind(pval_c, pval_h)
resp <- rep(c("Days 1 to 2"), times = nrow(pval_c)+nrow(pval_h))
line1 <- as.data.frame(rep(c("0.52"), times = nrow(pval_c)))
colnames(line1) <- c("line")
line2 <- as.data.frame(rep(c("0.33"), times = nrow(pval_h)))
colnames(line2) <- c("line")
line <- rbind(line1, line2)
figS12A_fig <- cbind(pval_ch, resp, line)
figS12A <- rbind(figS12A, figS12A_fig)
# Day 2 to 3
# Obtain pvalues
chimp_p_values_gen <- as.data.frame(qqplot_inc_day23[1])
shared_p_values_gen <- as.data.frame(qqplot_inc_day23[2])
# Pi_0 estimate for the chimps
pi0est_chimps <- qvalue(p=chimp_p_values_gen, pi0.method="smoother", fdr.level=NULL, robust=TRUE)$pi0
pi0est_chimps[1] 0.3652978# Pi_1 estimate for the chimps
pi1est_chimps <- 1 - pi0est_chimps
pi1est_chimps[1] 0.6347022# Pi_0 estimate for the chimps given significant in the humans
pi0est_chimps_given_humans <- qvalue(p=shared_p_values_gen, pi0.method="smoother", fdr.level=NULL, robust=TRUE)$pi0
pi0est_chimps_given_humans[1] 0.3533745# Pi_1 estimate for the humans
pi1est_chimps_given_humans <- 1 - pi0est_chimps_given_humans
pi1est_chimps_given_humans[1] 0.6466255# Let's overlap the two histograms
labels_c <- array("Chimpanzee", dim = c(10304,1))
labels_h <- array("Shared (Chimpanzee|Significant in Humans)", dim = c(as.data.frame(qqplot_inc_day23[[3]][2]),1))
chimps <- cbind(labels_c, chimp_p_values_gen)
colnames(chimps) <- c("Species", "pval")
humans <- cbind(labels_h, shared_p_values_gen)
colnames(humans) <- c("Species", "pval")
# Combine the two
all_pval <- rbind(chimps[,1:2], humans[,1:2])
pal <- c("#00A4F4", "#E77642", "white")
p3_inc_10 <- ggplot(all_pval, aes(pval, fill = Species)) + scale_fill_manual(values=pal[2:3]) +
geom_density(show.legend = F, alpha = 1) +
scale_x_continuous(limits = c(0,1), breaks = seq(0,1,0.25)) +
theme_bw() + labs(title = "Day 2 to 3") + theme(plot.title = element_text(face = "bold")) + labs(x = "Unadjusted p-values") + labs(y = "Density") +
geom_hline(yintercept = pi0est_chimps_given_humans, size = 2.5) + scale_y_continuous(labels=scaleFUN) +
geom_hline(yintercept = pi0est_chimps, size = 2.5, color = "#E77642") +
annotate("text", label= 'bold(bolditalic(hat(pi)[0][", chimps"])=="0.37")', parse=TRUE, x=0.2, y=(pi0est_chimps+0.13), colour = "#E77642", size = 6) + annotate("text", label = 'bold(bolditalic(hat(pi)[0][", shared"])=="0.35")', parse=TRUE, x=0.2, y=(pi0est_chimps_given_humans+0.07), size = 6)
p3_inc_10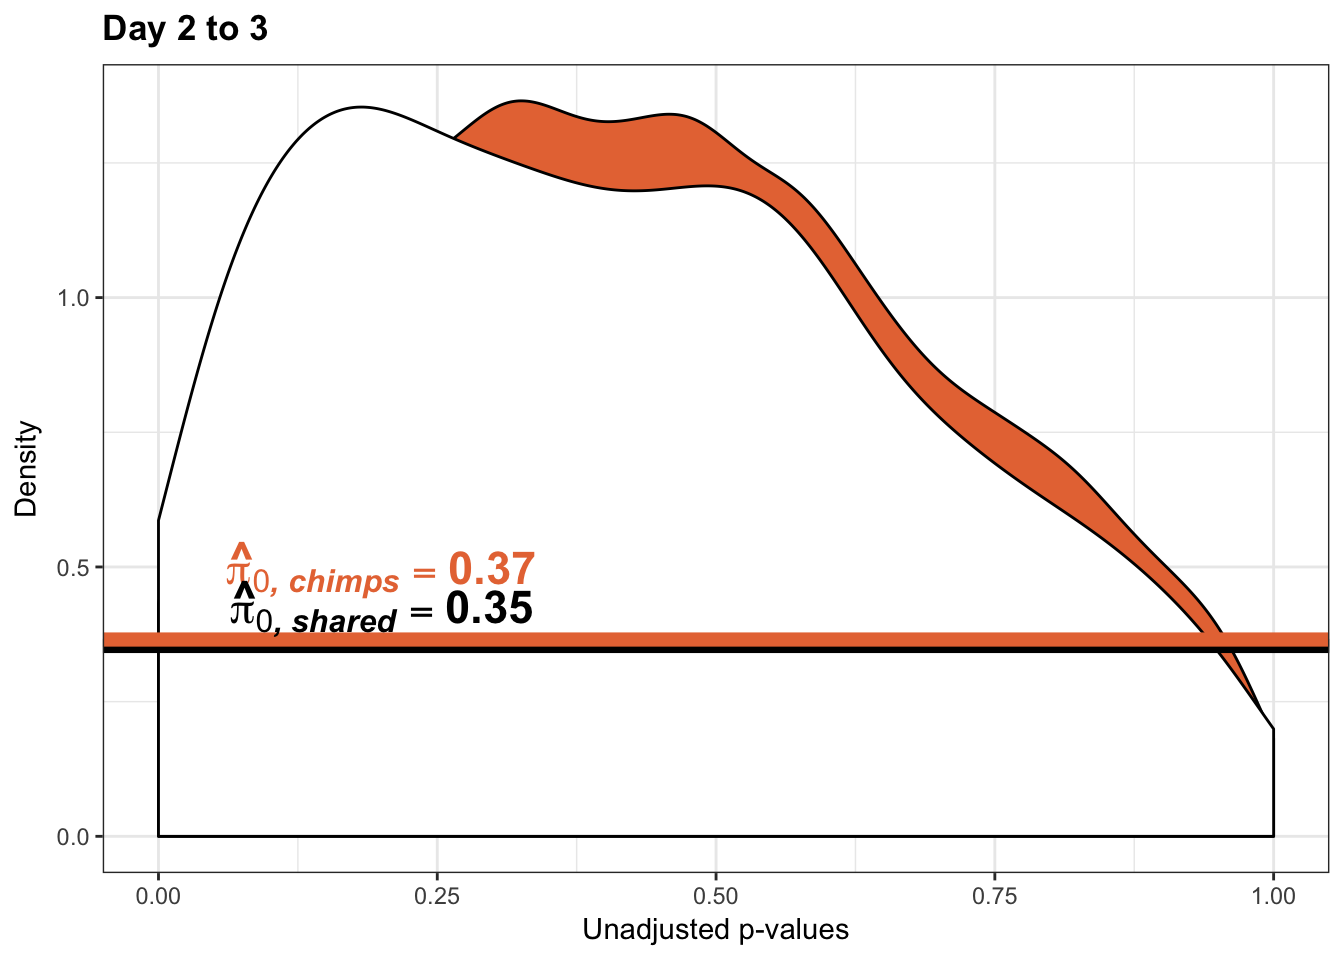
pval_c <- chimps[,1:2]
pval_h <- humans[,1:2]
pval_ch <- rbind(pval_c, pval_h)
resp <- rep(c("Days 2 to 3"), times = nrow(pval_c)+nrow(pval_h))
line1 <- as.data.frame(rep(c("0.37"), times = nrow(pval_c)))
colnames(line1) <- c("line")
line2 <- as.data.frame(rep(c("0.35"), times = nrow(pval_h)))
colnames(line2) <- c("line")
line <- rbind(line1, line2)
figS12A_fig <- cbind(pval_ch, resp, line)
figS12A <- rbind(figS12A, figS12A_fig)
# Day 1 to 3
# Obtain pvalues
chimp_p_values_gen <- as.data.frame(qqplot_inc_day13[1])
shared_p_values_gen <- as.data.frame(qqplot_inc_day13[2])
# Pi_0 estimate for the chimps
pi0est_chimps <- qvalue(p=chimp_p_values_gen, pi0.method="smoother", fdr.level=NULL, robust=TRUE)$pi0
pi0est_chimps[1] 0.5071291# Pi_1 estimate for the chimps
pi1est_chimps <- 1 - pi0est_chimps
pi1est_chimps[1] 0.4928709# Pi_0 estimate for the chimps given significant in the humans
pi0est_chimps_given_humans <- qvalue(p=shared_p_values_gen, pi0.method="smoother", fdr.level=NULL, robust=TRUE)$pi0
pi0est_chimps_given_humans[1] 0.4191553# Pi_1 estimate for the humans
pi1est_chimps_given_humans <- 1 - pi0est_chimps_given_humans
pi1est_chimps_given_humans[1] 0.5808447# Let's overlap the two histograms
labels_c <- array("Chimpanzee", dim = c(10304,1))
labels_h <- array("Shared (Chimpanzee|Significant in Humans)", dim = c(as.data.frame(qqplot_inc_day13[[3]][2]),1))
chimps <- cbind(labels_c, chimp_p_values_gen)
colnames(chimps) <- c("Species", "pval")
humans <- cbind(labels_h, shared_p_values_gen)
colnames(humans) <- c("Species", "pval")
# Combine the two
all_pval <- rbind(chimps[,1:2], humans[,1:2])
pal <- c("#00A4F4", "#E77642", "white")
p4_inc_10 <- ggplot(all_pval, aes(pval, fill = Species)) + scale_fill_manual(values=pal[2:3]) +
geom_density(show.legend = F, alpha = 1) +
scale_x_continuous(limits = c(0,1), breaks = seq(0,1,0.25)) + scale_y_continuous(labels=scaleFUN) +
theme_bw() + labs(title = "Day 1 to 3") + theme(plot.title = element_text(face = "bold")) + labs(x = "Unadjusted p-values") + labs(y = "Density") +
geom_hline(yintercept = pi0est_chimps_given_humans, size = 2.5) +
geom_hline(yintercept = pi0est_chimps, size = 2.5, color = "#E77642") +
annotate("text", label= 'bold(bolditalic(hat(pi)[0][", chimps"])=="0.51")', parse=TRUE, x=0.2, y=(pi0est_chimps+0.08), colour = "#E77642", size = 6) + annotate("text", label = 'bold(bolditalic(hat(pi)[0][", shared"])=="0.42")', parse=TRUE, x=0.2, y=(pi0est_chimps_given_humans-0.08), size = 6)
p4_inc_10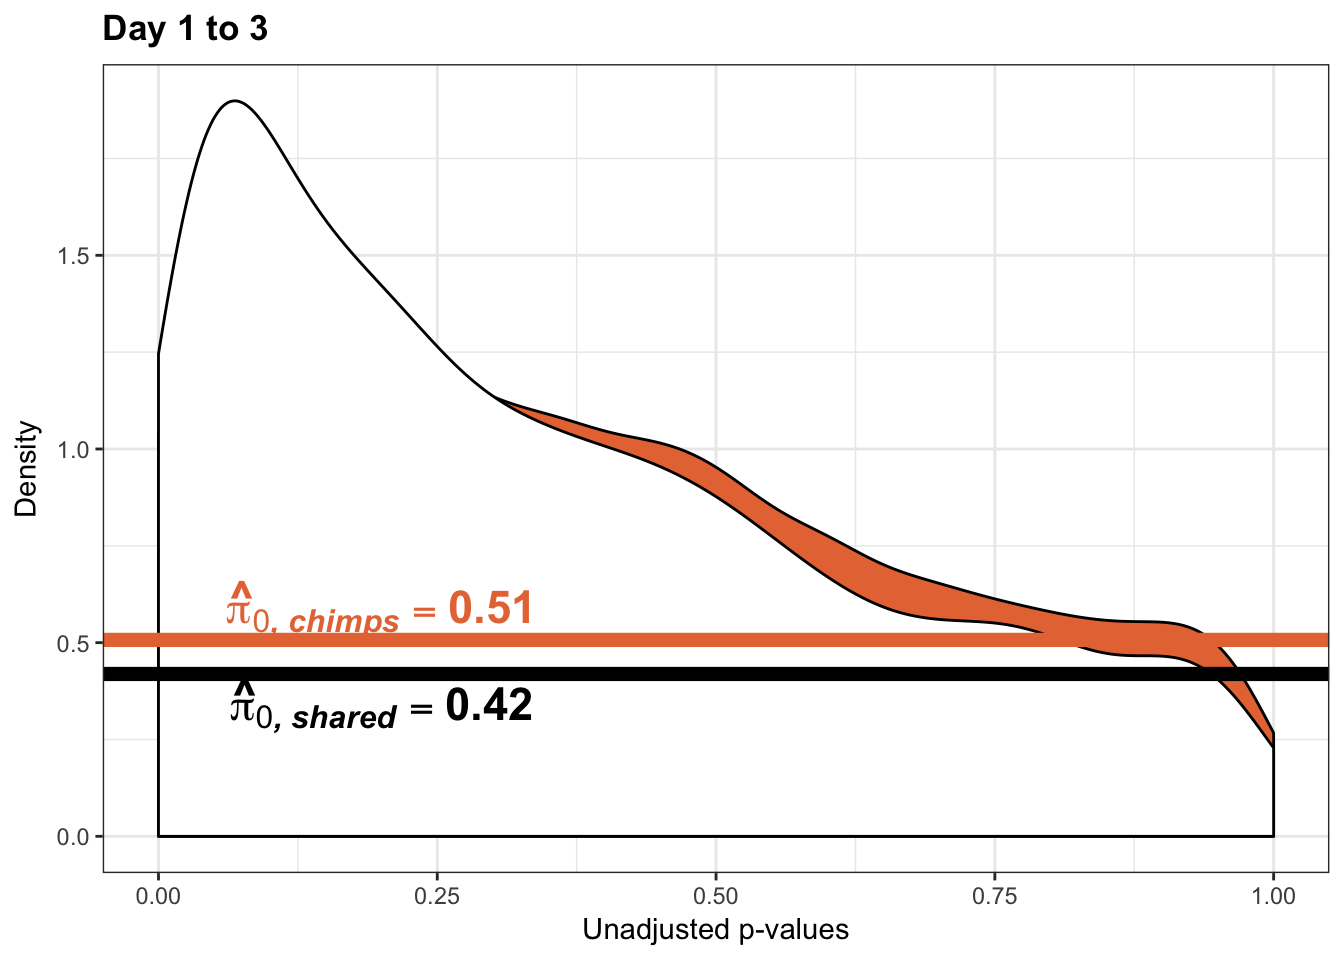
pval_c <- chimps[,1:2]
pval_h <- humans[,1:2]
pval_ch <- rbind(pval_c, pval_h)
resp <- rep(c("Days 1 to 3"), times = nrow(pval_c)+nrow(pval_h))
line1 <- as.data.frame(rep(c("0.51"), times = nrow(pval_c)))
colnames(line1) <- c("line")
line2 <- as.data.frame(rep(c("0.42"), times = nrow(pval_h)))
colnames(line2) <- c("line")
line <- rbind(line1, line2)
figS12A_fig <- cbind(pval_ch, resp, line)
figS12A <- rbind(figS12A, figS12A_fig)
#write.csv(figS12A, "/Users/laurenblake/Dropbox/Endoderm TC/Draft versions/Resubmit1_Genome Biology/Supplemental/Data_figS14J.csv", quote = FALSE, row.names = FALSE)Changes of variation in humans (p = 0.10)
# Reduction in variance from day 0 to day 1 humans
qqplot_red_day01 <- find_qqplot_red_humans(7,10,17,20,1,6,11,16, 0.1)

# Reduction in variance from day 1 to day 2 humans
qqplot_red_day12 <- find_qqplot_red_humans(17,20,27,30,11,16,21,26,0.1)

# Reduction in variance from day 2 to day 3 humans
qqplot_red_day23 <- find_qqplot_red_humans(27,30,37,40,21,26,31,36,0.1)

# Reduction in variance from day 1 to day 3 humans
qqplot_red_day13 <- find_qqplot_red_humans(17,20,37,40,11,16,31,36,0.1)

# Reduction in variance from day 0 to day 2 humans
qqplot_red_day02 <- find_qqplot_red_humans(7,10,27,30,1,6,21,26,0.1)

# Inc. in variance from day 0 to day 1 humans
qqplot_inc_day01 <- find_qqplot_inc_humans(7,10,17,20,1,6,11,16,0.1)

# Inc. in variance from day 1 to day 2 humans
qqplot_inc_day12 <- find_qqplot_inc_humans(17,20,27,30,11,16,21,26,0.1)

# Inc. in variance from day 2 to day 3 humans
qqplot_inc_day23 <- find_qqplot_inc_humans(27,30,37,40,21,26,31,36,0.1)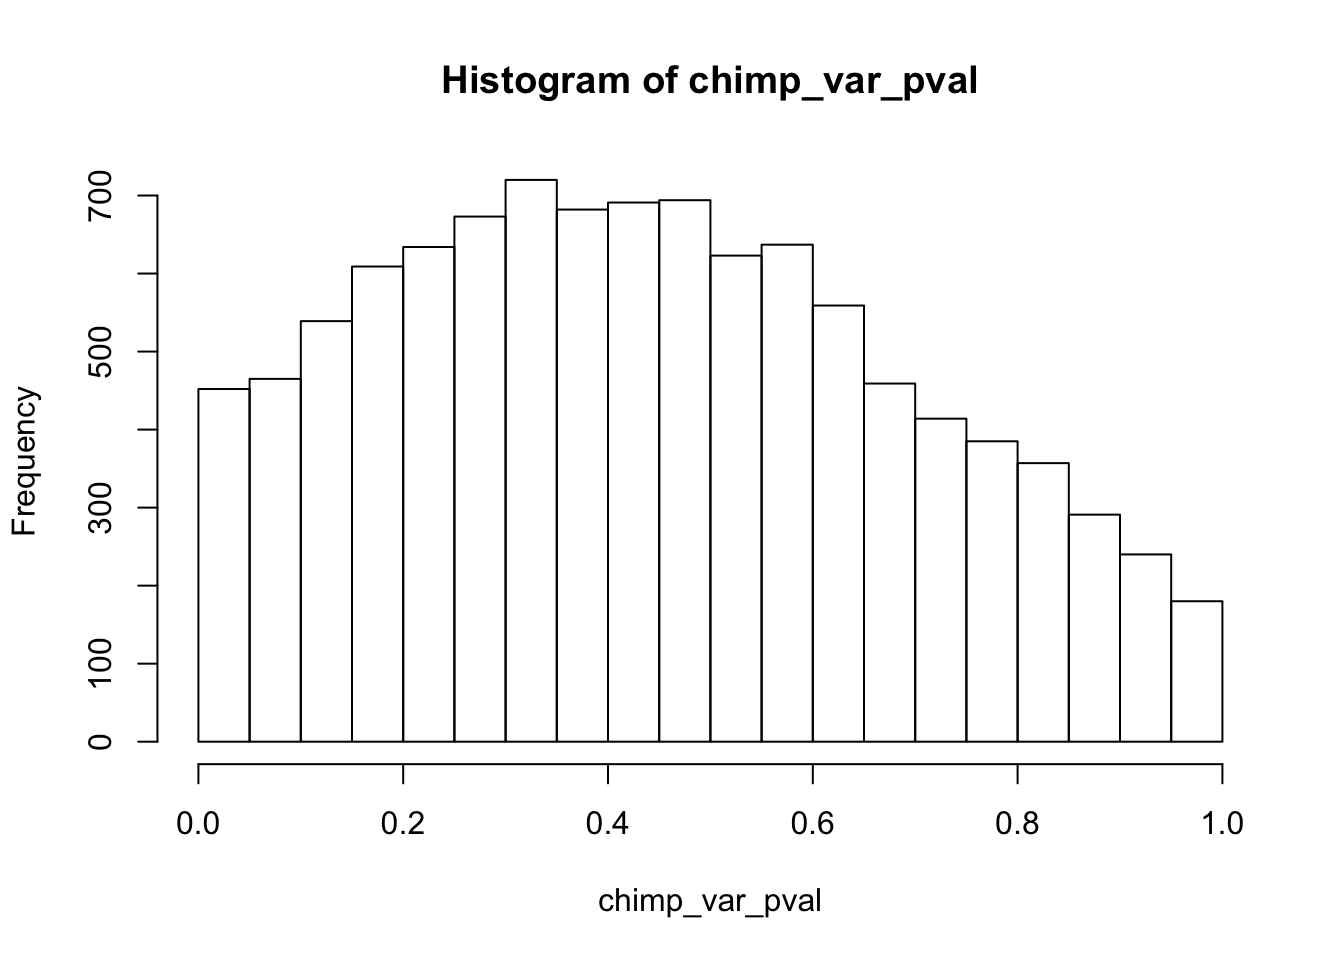

# Inc. in variance from day 0 to day 2
qqplot_inc_day02 <- find_qqplot_inc_humans(7,10,27,30,1,6,21,26,0.1)
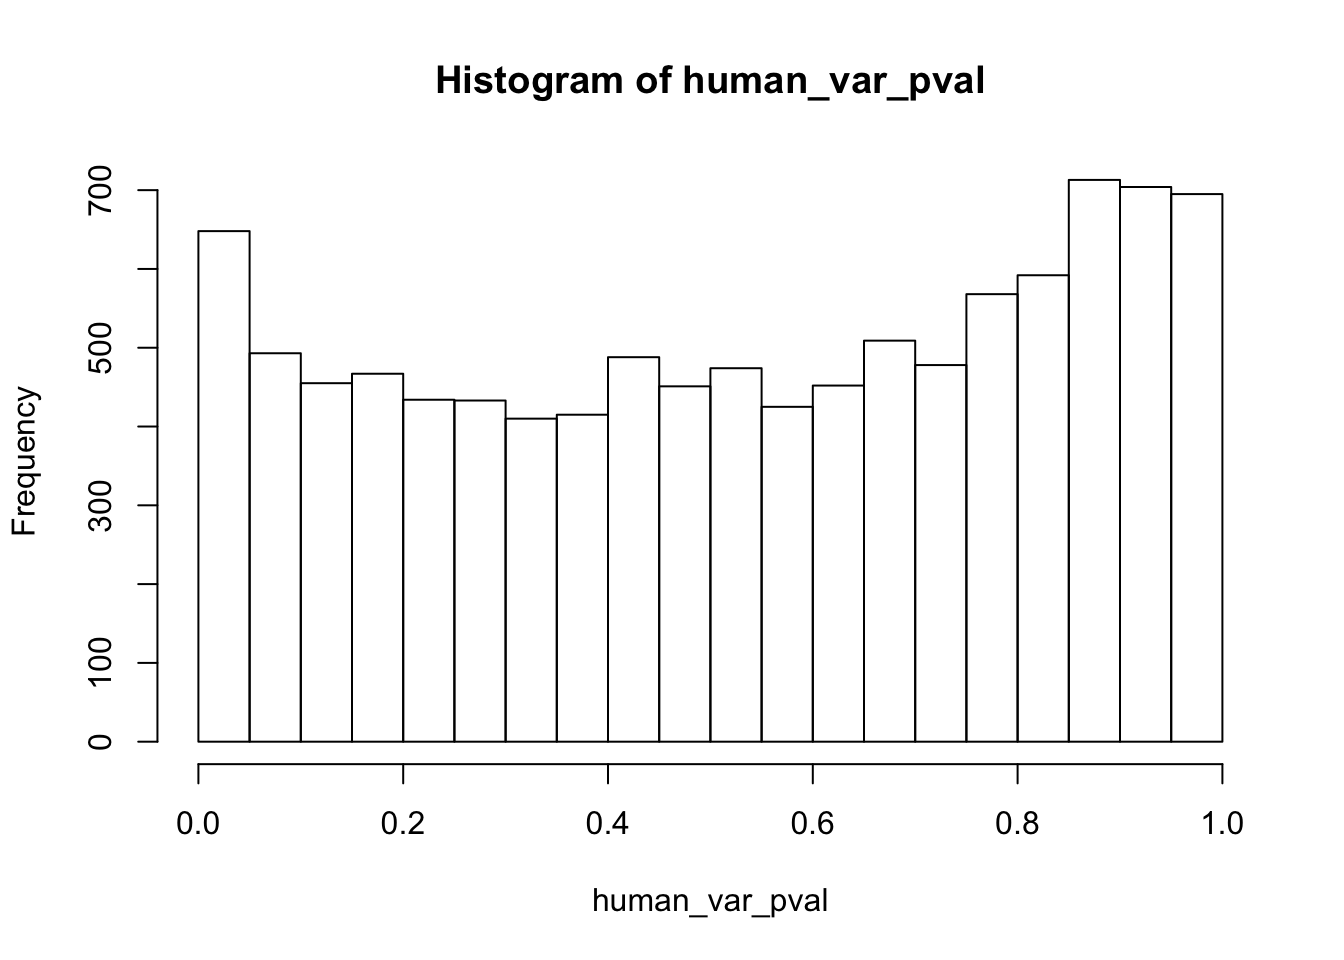
# Inc. in variance from day ` to day 3 humans
qqplot_inc_day13 <- find_qqplot_inc_humans(17,20,37,40,11,16,31,36,0.1)

Estimates of pi0 and pi1 for reduction of variation in humans conditioned on significance in chimps (p = 0.10)
####################### REDUCTION OF VARIATION IN HUMANS (p = 0.10)
# Day 0 to 1
# Obtain pvalues
human_p_values_gen <- as.data.frame(qqplot_red_day01[1])
shared_p_values_gen <- as.data.frame(qqplot_red_day01[2])
# Pi_0 estimate for the humans
pi0est_humans <- qvalue(p= human_p_values_gen, pi0.method="smoother", fdr.level=NULL, robust=TRUE)$pi0
pi0est_humans[1] 0.174912# Pi_1 estimate for the humans
pi1est_humans <- 1 - pi0est_humans
pi1est_humans[1] 0.825088# Pi_0 estimate for the chimps given significant in the humans
pi0est_humans_given_chimps <- qvalue(p=shared_p_values_gen, pi0.method="smoother", fdr.level=NULL, robust=TRUE)$pi0
pi0est_humans_given_chimps[1] 0.1538704# Pi_1 estimate for the humans
pi1est_humans_given_chimps <- 1 - pi0est_humans_given_chimps
pi1est_humans_given_chimps[1] 0.8461296# Let's overlap the two histograms
labels_h <- array("Human", dim = c(10304,1))
labels_c <- array("Shared (Human|Significant in Chimps)", dim = c(as.data.frame(qqplot_red_day01[[3]][1]),1))
chimps <- cbind(labels_c, shared_p_values_gen)
colnames(chimps) <- c("Species", "pval")
humans <- cbind(labels_h, human_p_values_gen)
colnames(humans) <- c("Species", "pval")
# Combine the two
all_pval <- rbind(humans[,1:2], chimps[,1:2])
pal <- c("#00A4F4", "white")
p5_10 <- ggplot(all_pval, aes(pval, fill = Species)) + scale_fill_manual(values=pal[1:2]) +
geom_density(show.legend = F, alpha = 1) +
scale_x_continuous(limits = c(0,1), breaks = seq(0,1,0.25)) +
theme_bw() + labs(title = "Day 0 to 1") + theme(plot.title = element_text(face = "bold")) + labs(x = "Unadjusted p-values") + labs(y = "Density") + scale_y_continuous(labels=scaleFUN) +
geom_hline(yintercept = pi0est_humans_given_chimps, size = 2.5) +
geom_hline(yintercept = pi0est_humans, size = 2.5, color = "#00A4F4") +
annotate("text", label= 'bold(bolditalic(hat(pi)[0][", humans"])=="0.17")', parse=TRUE, x=0.2, y=(pi0est_humans+0.3), colour = "#00A4F4", size = 6) + annotate("text", label = 'bold(bolditalic(hat(pi)[0][", shared"])=="0.15")', parse=TRUE, x=0.2, y=(pi0est_humans_given_chimps+0.15), size = 6)
p5_10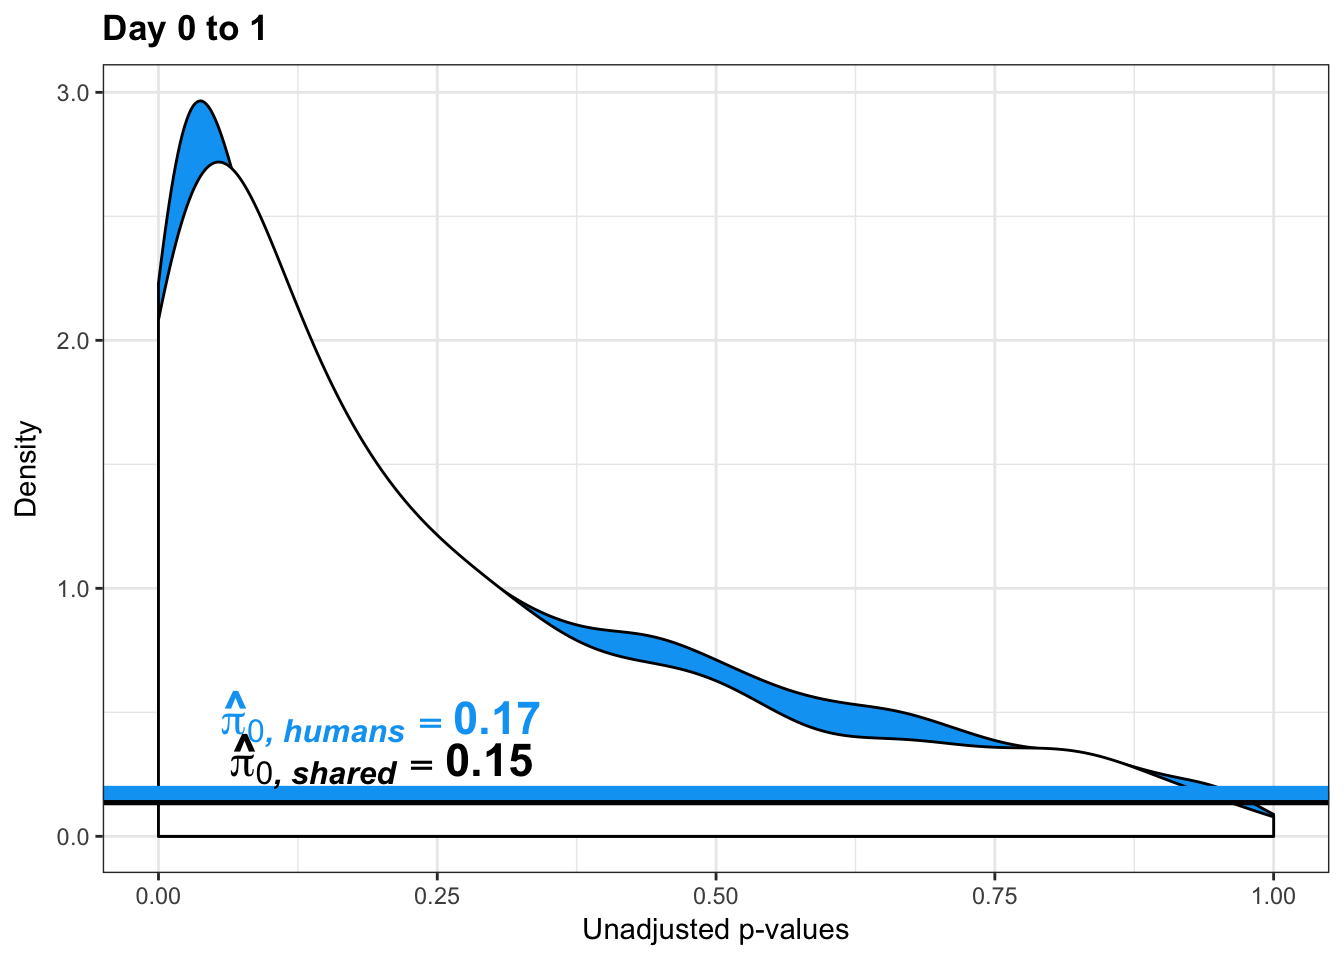
pval_c <- chimps[,1:2]
pval_h <- humans[,1:2]
pval_ch <- rbind(pval_h, pval_c)
resp <- rep(c("Days 0 to 1"), times = nrow(pval_c)+nrow(pval_h))
line1 <- as.data.frame(rep(c("0.17"), times = nrow(pval_h)))
colnames(line1) <- c("line")
line2 <- as.data.frame(rep(c("0.15"), times = nrow(pval_c)))
colnames(line2) <- c("line")
line <- rbind(line1, line2)
figS12A <- cbind(pval_ch, resp, line)
# Day 1 to 2
# Obtain pvalues
human_p_values_gen <- as.data.frame(qqplot_red_day12[1])
shared_p_values_gen <- as.data.frame(qqplot_red_day12[2])
# Pi_0 estimate for the humans
pi0est_humans <- qvalue(p= human_p_values_gen, pi0.method="smoother", fdr.level=NULL, robust=TRUE)$pi0
pi0est_humans[1] 1# Pi_1 estimate for the humans
pi1est_humans <- 1 - pi0est_humans
pi1est_humans[1] 0# Pi_0 estimate for the chimps given significant in the humans
pi0est_humans_given_chimps <- qvalue(p=shared_p_values_gen, pi0.method="smoother", fdr.level=NULL, robust=TRUE)$pi0
pi0est_humans_given_chimps[1] 1# Pi_1 estimate for the humans
pi1est_humans_given_chimps <- 1 - pi0est_humans_given_chimps
pi1est_humans_given_chimps[1] 0# Let's overlap the two histograms
labels_h <- array("Human", dim = c(10304,1))
labels_c <- array("Shared (Human|Significant in Chimps)", dim = c(as.data.frame(qqplot_red_day12[[3]][1]),1))
chimps <- cbind(labels_c, shared_p_values_gen)
colnames(chimps) <- c("Species", "pval")
humans <- cbind(labels_h, human_p_values_gen)
colnames(humans) <- c("Species", "pval")
# Combine the two
all_pval <- rbind(humans[,1:2], chimps[,1:2])
pal <- c("#00A4F4", "white")
p6_10 <- ggplot(all_pval, aes(pval, fill = Species)) + scale_fill_manual(values=pal[1:2]) +
geom_density(show.legend = F, alpha = 1) +
scale_x_continuous(limits = c(0,1), breaks = seq(0,1,0.25)) +
theme_bw() + labs(title = "Day 1 to 2") + theme(plot.title = element_text(face = "bold")) + labs(x = "Unadjusted p-values") + labs(y = "Density") + scale_y_continuous(labels=scaleFUN) +
geom_hline(yintercept = pi0est_humans_given_chimps, size = 2.5) +
geom_hline(yintercept = pi0est_humans, size = 2.5, color = "#00A4F4") +
annotate("text", label= 'bold(bolditalic(hat(pi)[0][", humans"])=="1")', parse=TRUE, x=0.2, y=(pi0est_humans+0.3), colour = "#00A4F4", size = 6) + annotate("text", label = 'bold(bolditalic(hat(pi)[0][", shared"])=="1")', parse=TRUE, x=0.2, y=(pi0est_humans_given_chimps+0.15), size = 6)
p6_10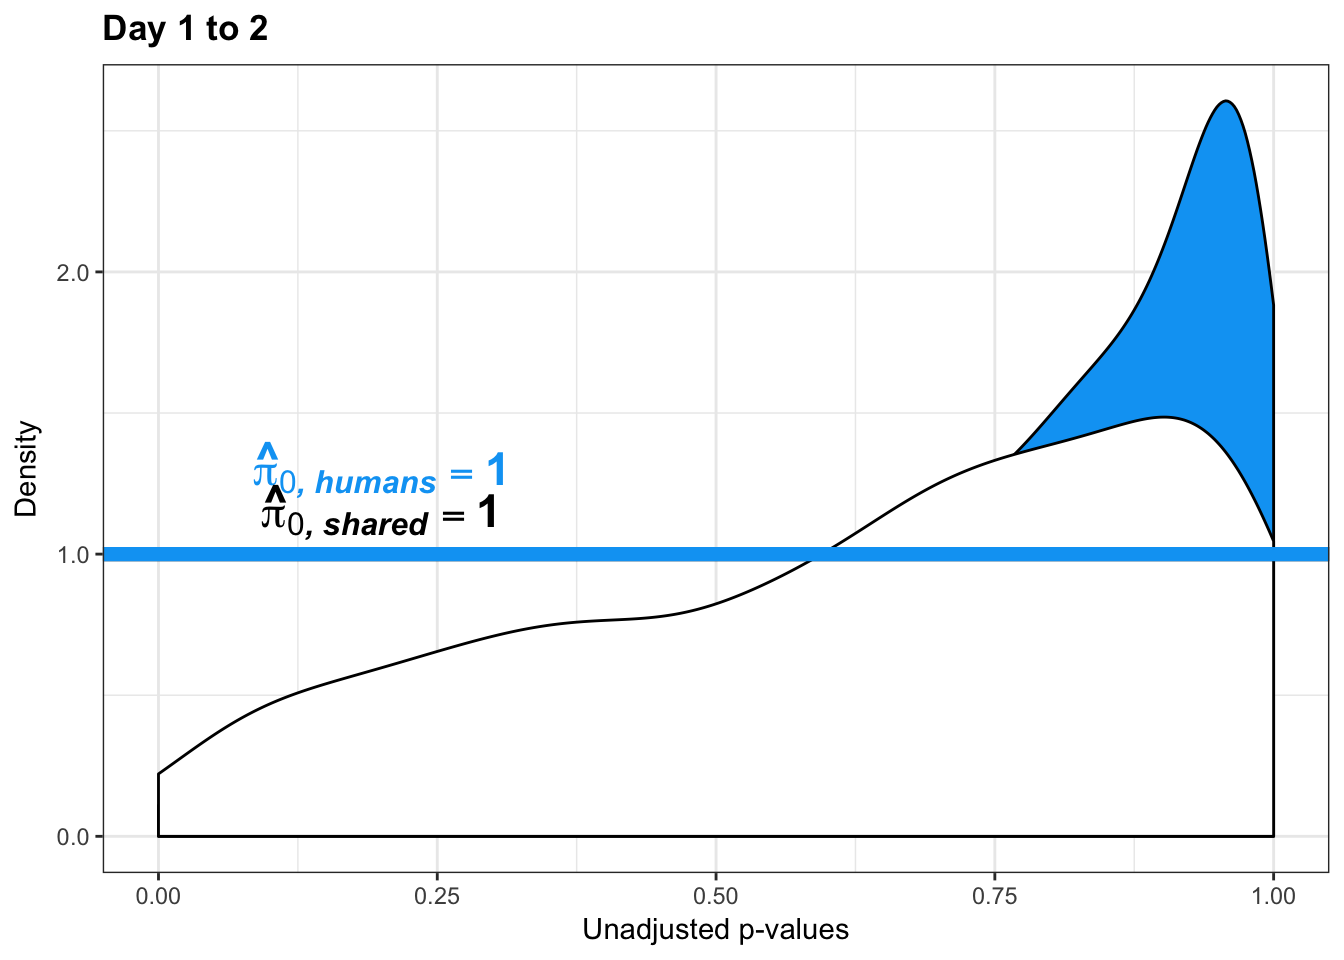
pval_c <- chimps[,1:2]
pval_h <- humans[,1:2]
pval_ch <- rbind(pval_h, pval_c)
resp <- rep(c("Days 1 to 2"), times = nrow(pval_c)+nrow(pval_h))
line1 <- as.data.frame(rep(c("NA"), times = nrow(pval_h)))
colnames(line1) <- c("line")
line2 <- as.data.frame(rep(c("NA"), times = nrow(pval_c)))
colnames(line2) <- c("line")
line <- rbind(line1, line2)
figS12A_fig <- cbind(pval_ch, resp, line)
figS12A <- rbind(figS12A, figS12A_fig)
# Day 2 to 3
# Obtain pvalues
human_p_values_gen <- as.data.frame(qqplot_red_day23[1])
shared_p_values_gen <- as.data.frame(qqplot_red_day23[2])
# Pi_0 estimate for the humans
pi0est_humans <- qvalue(p= human_p_values_gen, pi0.method="smoother", fdr.level=NULL, robust=TRUE)$pi0
pi0est_humans[1] 0.8664877# Pi_1 estimate for the humans
pi1est_humans <- 1 - pi0est_humans
pi1est_humans[1] 0.1335123# Pi_0 estimate for the chimps given significant in the humans
pi0est_humans_given_chimps <- qvalue(p=shared_p_values_gen, pi0.method="smoother", fdr.level=NULL, robust=TRUE)$pi0
pi0est_humans_given_chimps[1] 0.7630281# Pi_1 estimate for the humans
pi1est_humans_given_chimps <- 1 - pi0est_humans_given_chimps
pi1est_humans_given_chimps[1] 0.2369719# Let's overlap the two histograms
labels_h <- array("Human", dim = c(10304,1))
labels_c <- array("Shared (Human|Significant in Chimps)", dim = c(as.data.frame(qqplot_red_day23[[3]][1]),1))
chimps <- cbind(labels_c, shared_p_values_gen)
colnames(chimps) <- c("Species", "pval")
humans <- cbind(labels_h, human_p_values_gen)
colnames(humans) <- c("Species", "pval")
# Combine the two
all_pval <- rbind(humans[,1:2], chimps[,1:2])
pal <- c("#00A4F4", "white")
p7_10 <- ggplot(all_pval, aes(pval, fill = Species)) + scale_fill_manual(values=pal[1:2]) +
geom_density(show.legend = F, alpha = 1) +
scale_x_continuous(limits = c(0,1), breaks = seq(0,1,0.25)) +
theme_bw() + labs(title = "Day 2 to 3") + theme(plot.title = element_text(face = "bold")) + labs(x = "Unadjusted p-values") + labs(y = "Density") +
geom_hline(yintercept = pi0est_humans_given_chimps, size = 2.5) +
geom_hline(yintercept = pi0est_humans, size = 2.5, color = "#00A4F4") +
annotate("text", label= 'bold(bolditalic(hat(pi)[0][", humans"])=="0.87")', parse=TRUE, x=0.7, y=(pi0est_humans+0.06), colour = "#00A4F4", size = 6) + annotate("text", label = 'bold(bolditalic(hat(pi)[0][", shared"])=="0.76")', parse=TRUE, x=0.7, y=(pi0est_humans_given_chimps+0.06), size = 6)
p7_10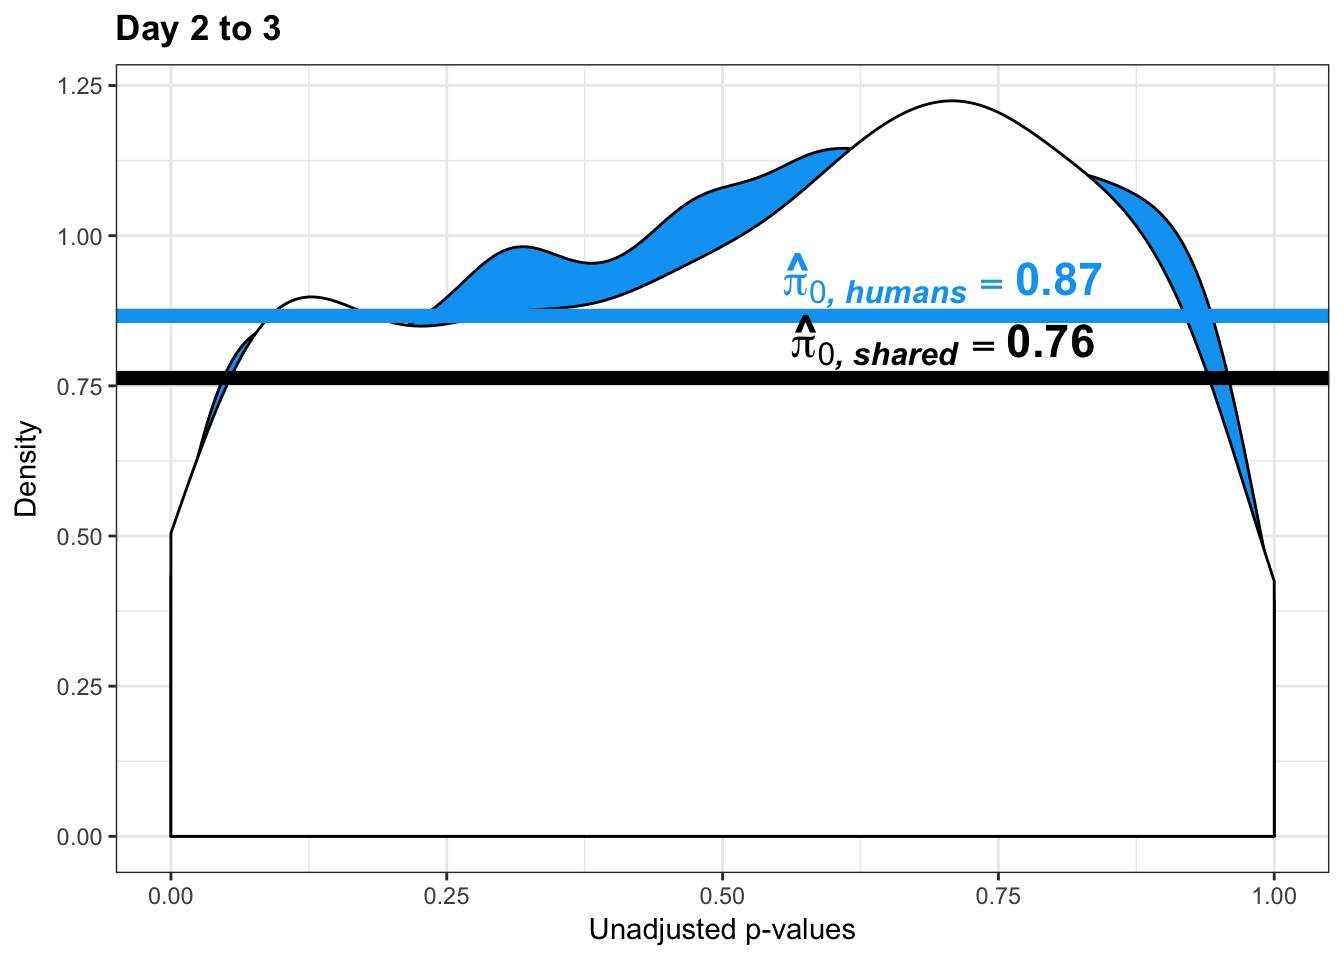
pval_c <- chimps[,1:2]
pval_h <- humans[,1:2]
pval_ch <- rbind(pval_h, pval_c)
resp <- rep(c("Days 2 to 3"), times = nrow(pval_c)+nrow(pval_h))
line1 <- as.data.frame(rep(c("NA"), times = nrow(pval_h)))
colnames(line1) <- c("line")
line2 <- as.data.frame(rep(c("NA"), times = nrow(pval_c)))
colnames(line2) <- c("line")
line <- rbind(line1, line2)
figS12A_fig <- cbind(pval_ch, resp, line)
figS12A <- rbind(figS12A, figS12A_fig)
# Day 1 to 3
# Obtain pvalues
human_p_values_gen <- as.data.frame(qqplot_red_day13[1])
shared_p_values_gen <- as.data.frame(qqplot_red_day13[2])
# Pi_0 estimate for the humans
pi0est_humans <- qvalue(p= human_p_values_gen, pi0.method="smoother", fdr.level=NULL, robust=TRUE)$pi0
pi0est_humans[1] 1# Pi_1 estimate for the humans
pi1est_humans <- 1 - pi0est_humans
pi1est_humans[1] 0# Pi_0 estimate for the chimps given significant in the humans
pi0est_humans_given_chimps <- qvalue(p=shared_p_values_gen, pi0.method="smoother", fdr.level=NULL, robust=TRUE)$pi0
pi0est_humans_given_chimps[1] 1# Pi_1 estimate for the humans
pi1est_humans_given_chimps <- 1 - pi0est_humans_given_chimps
pi1est_humans_given_chimps[1] 0# Let's overlap the two histograms
labels_h <- array("Human", dim = c(10304,1))
labels_c <- array("Shared (Human|Significant in Chimps)", dim = c(as.data.frame(qqplot_red_day13[[3]][1]),1))
chimps <- cbind(labels_c, shared_p_values_gen)
colnames(chimps) <- c("Species", "pval")
humans <- cbind(labels_h, human_p_values_gen)
colnames(humans) <- c("Species", "pval")
# Combine the two
all_pval <- rbind(humans[,1:2], chimps[,1:2])
pal <- c("#00A4F4", "white")
p8_10 <- ggplot(all_pval, aes(pval, fill = Species)) + scale_fill_manual(values=pal[1:2]) +
geom_density(show.legend = F, alpha = 1) +
scale_x_continuous(limits = c(0,1), breaks = seq(0,1,0.25)) +
theme_bw() + labs(title = "Day 1 to 3") + theme(plot.title = element_text(face = "bold")) + labs(x = "Unadjusted p-values") + labs(y = "Density") + scale_y_continuous(labels=scaleFUN) +
geom_hline(yintercept = pi0est_humans_given_chimps, size = 2.5) +
geom_hline(yintercept = pi0est_humans, size = 2.5, color = "#00A4F4") +
annotate("text", label= 'bold(bolditalic(hat(pi)[0][", humans"])=="1")', parse=TRUE, x=0.2, y=(pi0est_humans+0.3), colour = "#00A4F4", size = 6) + annotate("text", label = 'bold(bolditalic(hat(pi)[0][", shared"])=="1")', parse=TRUE, x=0.2, y=(pi0est_humans_given_chimps+0.15), size = 6)
p8_10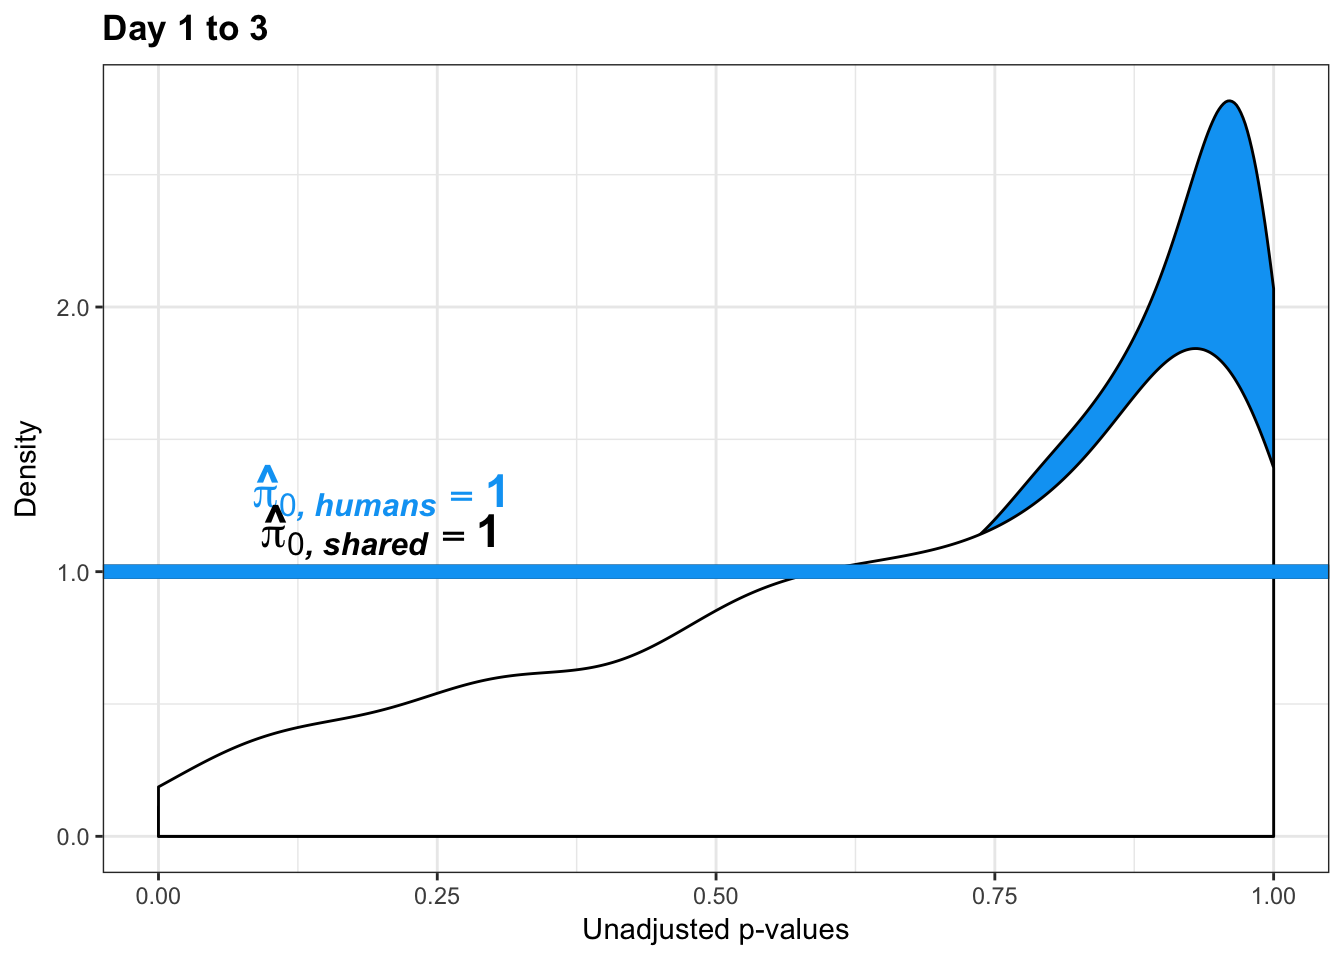
pval_c <- chimps[,1:2]
pval_h <- humans[,1:2]
pval_ch <- rbind(pval_h, pval_c)
resp <- rep(c("Days 1 to 3"), times = nrow(pval_c)+nrow(pval_h))
line1 <- as.data.frame(rep(c("NA"), times = nrow(pval_h)))
colnames(line1) <- c("line")
line2 <- as.data.frame(rep(c("NA"), times = nrow(pval_c)))
colnames(line2) <- c("line")
line <- rbind(line1, line2)
figS12A_fig <- cbind(pval_ch, resp, line)
figS12A <- rbind(figS12A, figS12A_fig)
#write.csv(figS12A, "/Users/laurenblake/Dropbox/Endoderm TC/Draft versions/Resubmit1_Genome Biology/Supplemental/Data_figS14H.csv", quote = FALSE, row.names = FALSE)
multiplot(p1_10,p5_10,p2_10,p6_10,p3_10,p7_10,p4_10,p8_10,cols=4)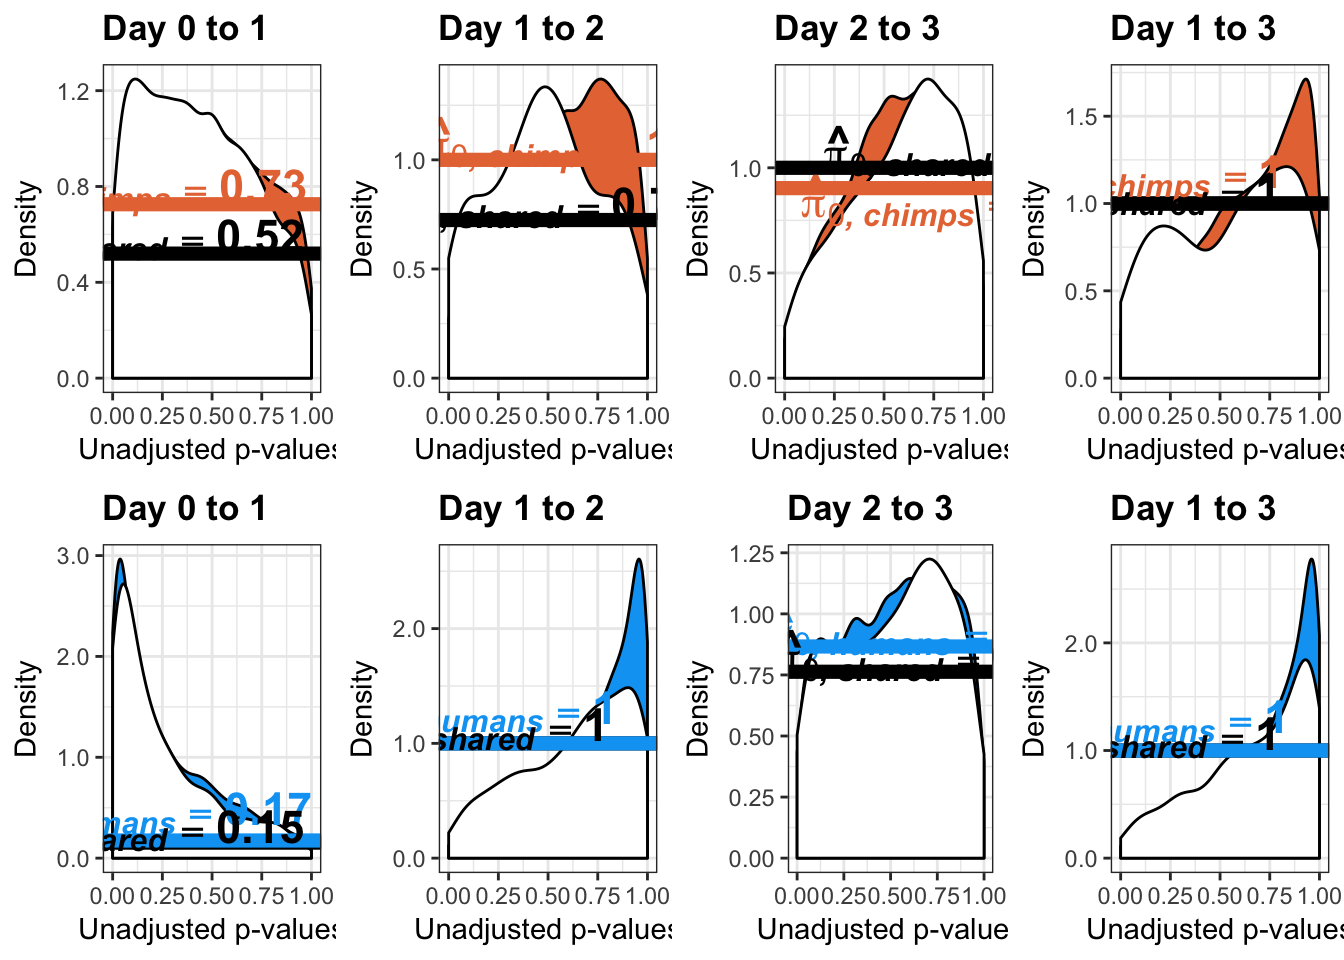
Estimates of pi0 and pi1 for increase of variation in humans conditioned on significance in chimps (p = 0.10)
####################### INCREASE IN VARIATION IN HUMANS (p = 0.1)
# Day 0 to 1
# Obtain pvalues
human_p_values_gen <- as.data.frame(qqplot_inc_day01[1])
shared_p_values_gen <- as.data.frame(qqplot_inc_day01[2])
# Pi_0 estimate for the humans
pi0est_humans <- qvalue(p= human_p_values_gen, pi0.method="smoother", fdr.level=NULL, robust=TRUE)$pi0
pi0est_humans[1] 1# Pi_1 estimate for the humans
pi1est_humans <- 1 - pi0est_humans
pi1est_humans[1] 0# Pi_0 estimate for the chimps given significant in the humans
pi0est_humans_given_chimps <- qvalue(p=shared_p_values_gen, pi0.method="smoother", fdr.level=NULL, robust=TRUE)$pi0
pi0est_humans_given_chimps[1] 1# Pi_1 estimate for the humans
pi1est_humans_given_chimps <- 1 - pi0est_humans_given_chimps
pi1est_humans_given_chimps[1] 0# Let's overlap the two histograms
labels_h <- array("Human", dim = c(10304,1))
labels_c <- array("Shared (Human|Significant in Chimps)", dim = c(as.data.frame(qqplot_inc_day01[[3]][1]),1))
chimps <- cbind(labels_c, shared_p_values_gen)
colnames(chimps) <- c("Species", "pval")
humans <- cbind(labels_h, human_p_values_gen)
colnames(humans) <- c("Species", "pval")
# Combine the two
all_pval <- rbind(humans[,1:2], chimps[,1:2])
pal <- c("#00A4F4", "white")
p5_inc_10 <- ggplot(all_pval, aes(pval, fill = Species)) + scale_fill_manual(values=pal[1:2]) +
geom_density(show.legend = F, alpha = 1) +
scale_x_continuous(limits = c(0,1), breaks = seq(0,1,0.25)) +
theme_bw() + labs(title = "Day 0 to 1") + theme(plot.title = element_text(face = "bold")) + labs(x = "Unadjusted p-values") + labs(y = "Density") +
geom_hline(yintercept = pi0est_humans_given_chimps, size = 2.5) + scale_y_continuous(labels=scaleFUN) +
geom_hline(yintercept = pi0est_humans, size = 2.5, color = "#00A4F4") +
annotate("text", label= 'bold(bolditalic(hat(pi)[0][", humans"])=="1")', parse=TRUE, x=0.2, y=(pi0est_humans+0.3), colour = "#00A4F4", size = 6) + annotate("text", label = 'bold(bolditalic(hat(pi)[0][", shared"])=="1")', parse=TRUE, x=0.2, y=(pi0est_humans_given_chimps+0.15), size = 6)
p5_inc_10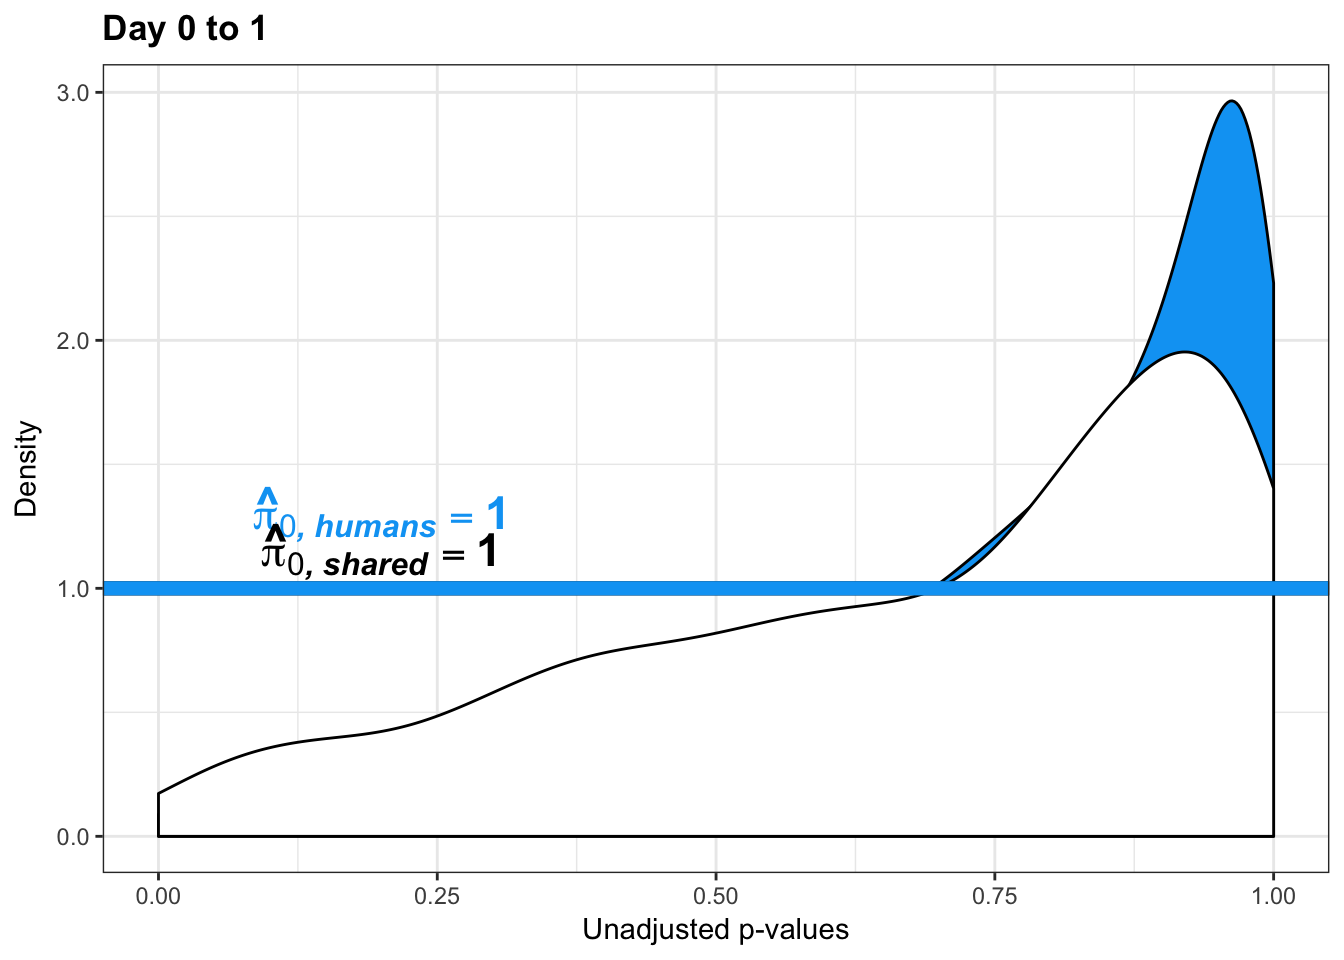
pval_c <- chimps[,1:2]
pval_h <- humans[,1:2]
pval_ch <- rbind(pval_h, pval_c)
resp <- rep(c("Days 0 to 1"), times = nrow(pval_c)+nrow(pval_h))
line1 <- as.data.frame(rep(c("NA"), times = nrow(pval_h)))
colnames(line1) <- c("line")
line2 <- as.data.frame(rep(c("NA"), times = nrow(pval_c)))
colnames(line2) <- c("line")
line <- rbind(line1, line2)
figS12A <- cbind(pval_ch, resp, line)
# Day 1 to 2
# Obtain pvalues
human_p_values_gen <- as.data.frame(qqplot_inc_day12[1])
shared_p_values_gen <- as.data.frame(qqplot_inc_day12[2])
# Pi_0 estimate for the humans
pi0est_humans <- qvalue(p= human_p_values_gen, pi0.method="smoother", fdr.level=NULL, robust=TRUE)$pi0
pi0est_humans[1] 0.2141993# Pi_1 estimate for the humans
pi1est_humans <- 1 - pi0est_humans
pi1est_humans[1] 0.7858007# Pi_0 estimate for the chimps given significant in the humans
pi0est_humans_given_chimps <- qvalue(p=shared_p_values_gen, pi0.method="smoother", fdr.level=NULL, robust=TRUE)$pi0
pi0est_humans_given_chimps[1] 0.09899168# Pi_1 estimate for the humans
pi1est_humans_given_chimps <- 1 - pi0est_humans_given_chimps
pi1est_humans_given_chimps[1] 0.9010083# Let's overlap the two histograms
labels_h <- array("Human", dim = c(10304,1))
labels_c <- array("Shared (Human|Significant in Chimps)", dim = c(as.data.frame(qqplot_inc_day12[[3]][1]),1))
chimps <- cbind(labels_c, shared_p_values_gen)
colnames(chimps) <- c("Species", "pval")
humans <- cbind(labels_h, human_p_values_gen)
colnames(humans) <- c("Species", "pval")
# Combine the two
all_pval <- rbind(humans[,1:2], chimps[,1:2])
pal <- c("#00A4F4", "white")
p6_inc_10 <- ggplot(all_pval, aes(pval, fill = Species)) + scale_fill_manual(values=pal[1:2]) +
geom_density(show.legend = F, alpha = 1) +
scale_x_continuous(limits = c(0,1), breaks = seq(0,1,0.25)) +
theme_bw() + labs(title = "Day 1 to 2") + theme(plot.title = element_text(face = "bold")) + labs(x = "Unadjusted p-values") + labs(y = "Density") + scale_y_continuous(labels=scaleFUN) +
geom_hline(yintercept = pi0est_humans_given_chimps, size = 2.5) +
geom_hline(yintercept = pi0est_humans, size = 2.5, color = "#00A4F4") +
annotate("text", label= 'bold(bolditalic(hat(pi)[0][", humans"])=="0.21")', parse=TRUE, x=0.2, y=(pi0est_humans+0.28), colour = "#00A4F4", size = 6) + annotate("text", label = 'bold(bolditalic(hat(pi)[0][", shared"])=="0.10")', parse=TRUE, x=0.2, y=(pi0est_humans_given_chimps+0.25), size = 6)
p6_inc_10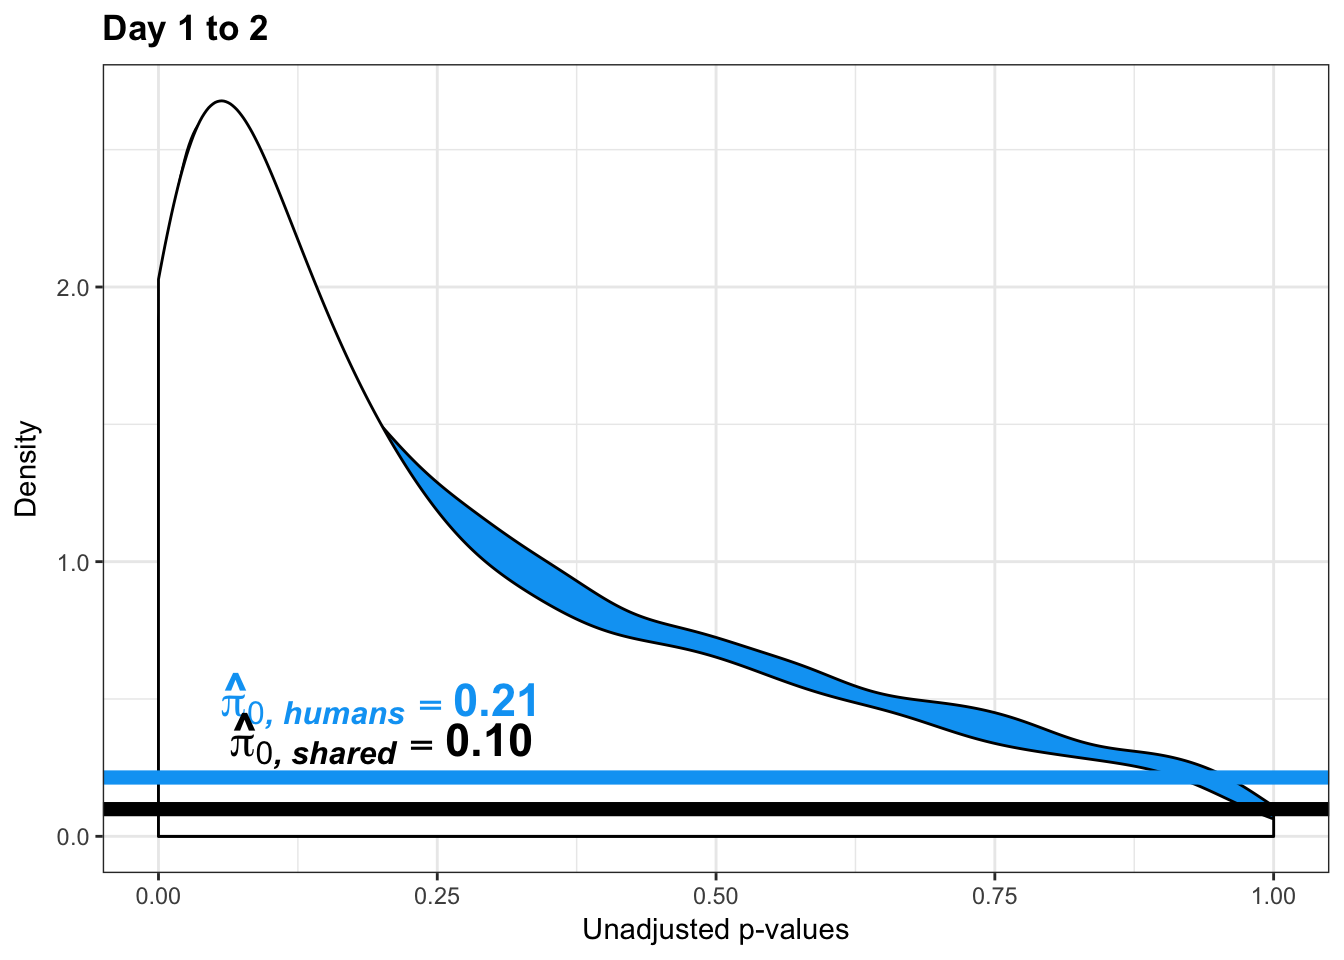
pval_c <- chimps[,1:2]
pval_h <- humans[,1:2]
pval_ch <- rbind(pval_h, pval_c)
resp <- rep(c("Days 1 to 2"), times = nrow(pval_c)+nrow(pval_h))
line1 <- as.data.frame(rep(c("0.21"), times = nrow(pval_h)))
colnames(line1) <- c("line")
line2 <- as.data.frame(rep(c("0.10"), times = nrow(pval_c)))
colnames(line2) <- c("line")
line <- rbind(line1, line2)
figS12A_fig <- cbind(pval_ch, resp, line)
figS12A <- rbind(figS12A, figS12A_fig)
# Day 2 to 3
# Obtain pvalues
human_p_values_gen <- as.data.frame(qqplot_inc_day23[1])
shared_p_values_gen <- as.data.frame(qqplot_inc_day23[2])
# Pi_0 estimate for the humans
pi0est_humans <- qvalue(p= human_p_values_gen, pi0.method="smoother", fdr.level=NULL, robust=TRUE)$pi0
pi0est_humans[1] 0.8477893# Pi_1 estimate for the humans
pi1est_humans <- 1 - pi0est_humans
pi1est_humans[1] 0.1522107# Pi_0 estimate for the chimps given significant in the humans
pi0est_humans_given_chimps <- qvalue(p=shared_p_values_gen, pi0.method="smoother", fdr.level=NULL, robust=TRUE)$pi0
pi0est_humans_given_chimps[1] 1# Pi_1 estimate for the humans
pi1est_humans_given_chimps <- 1 - pi0est_humans_given_chimps
pi1est_humans_given_chimps[1] 0# Let's overlap the two histograms
labels_h <- array("Human", dim = c(10304,1))
labels_c <- array("Shared (Human|Significant in Chimps)", dim = c(as.data.frame(qqplot_inc_day23[[3]][1]),1))
chimps <- cbind(labels_c, shared_p_values_gen)
colnames(chimps) <- c("Species", "pval")
humans <- cbind(labels_h, human_p_values_gen)
colnames(humans) <- c("Species", "pval")
# Combine the two
all_pval <- rbind(humans[,1:2], chimps[,1:2])
pal <- c("#00A4F4", "white")
p7_inc_10 <- ggplot(all_pval, aes(pval, fill = Species)) + scale_fill_manual(values=pal[1:2]) +
geom_density(show.legend = F, alpha = 1) +
scale_x_continuous(limits = c(0,1), breaks = seq(0,1,0.25)) +
theme_bw() + labs(title = "Day 2 to 3") + theme(plot.title = element_text(face = "bold")) +
geom_hline(yintercept = pi0est_humans_given_chimps, size = 2.5) + labs(x = "Unadjusted p-values") + labs(y = "Density") + scale_y_continuous(labels=scaleFUN) +
geom_hline(yintercept = pi0est_humans, size = 2.5, color = "#00A4F4") +
annotate("text", label= 'bold(bolditalic(hat(pi)[0][", humans"])=="0.85")', parse=TRUE, x=0.2, y=(pi0est_humans+0.07), colour = "#00A4F4", size = 6) + annotate("text", label = 'bold(bolditalic(hat(pi)[0][", shared"])=="1")', parse=TRUE, x=0.2, y=(pi0est_humans_given_chimps+0.07), size = 6)
p7_inc_10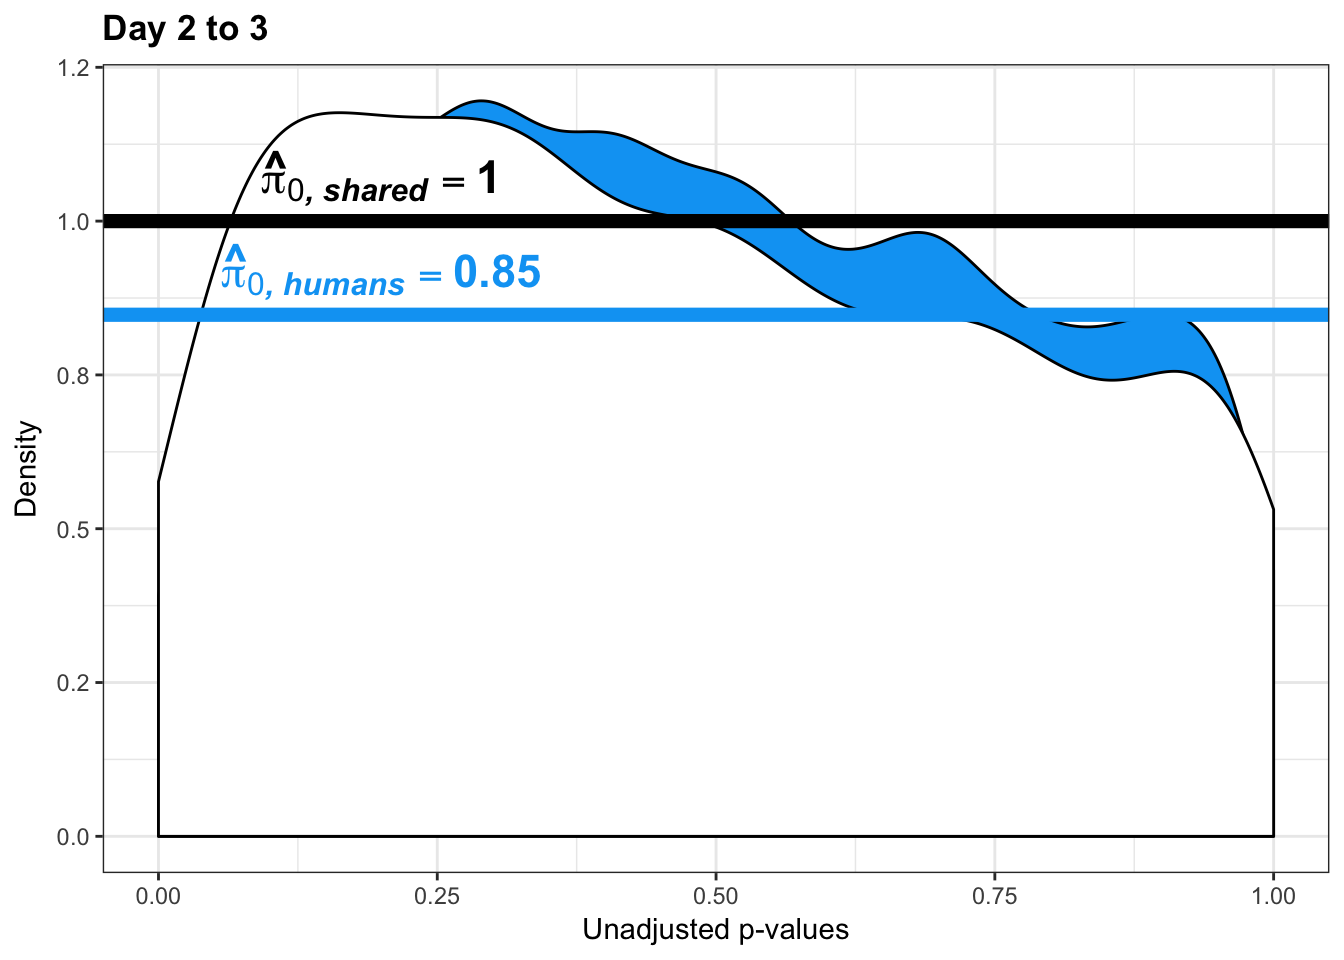
pval_c <- chimps[,1:2]
pval_h <- humans[,1:2]
pval_ch <- rbind(pval_h, pval_c)
resp <- rep(c("Days 2 to 3"), times = nrow(pval_c)+nrow(pval_h))
line1 <- as.data.frame(rep(c("1"), times = nrow(pval_h)))
colnames(line1) <- c("line")
line2 <- as.data.frame(rep(c("0.85"), times = nrow(pval_c)))
colnames(line2) <- c("line")
line <- rbind(line1, line2)
figS12A_fig <- cbind(pval_ch, resp, line)
figS12A <- rbind(figS12A, figS12A_fig)
# Day 1 to 3
# Obtain pvalues
human_p_values_gen <- as.data.frame(qqplot_inc_day13[1])
shared_p_values_gen <- as.data.frame(qqplot_inc_day13[2])
# Pi_0 estimate for the humans
pi0est_humans <- qvalue(p= human_p_values_gen, pi0.method="smoother", fdr.level=NULL, robust=TRUE)$pi0
pi0est_humans[1] 0.203399# Pi_1 estimate for the humans
pi1est_humans <- 1 - pi0est_humans
pi1est_humans[1] 0.796601# Pi_0 estimate for the chimps given significant in the humans
pi0est_humans_given_chimps <- qvalue(p=shared_p_values_gen, pi0.method="smoother", fdr.level=NULL, robust=TRUE)$pi0
pi0est_humans_given_chimps[1] 0.1556774# Pi_1 estimate for the humans
pi1est_humans_given_chimps <- 1 - pi0est_humans_given_chimps
pi1est_humans_given_chimps[1] 0.8443226# Let's overlap the two histograms
labels_h <- array("Human", dim = c(10304,1))
labels_c <- array("Shared (Human|Significant in Chimps)", dim = c(as.data.frame(qqplot_inc_day13[[3]][1]),1))
chimps <- cbind(labels_c, shared_p_values_gen)
colnames(chimps) <- c("Species", "pval")
humans <- cbind(labels_h, human_p_values_gen)
colnames(humans) <- c("Species", "pval")
# Combine the two
all_pval <- rbind(humans[,1:2], chimps[,1:2])
pal <- c("#00A4F4", "white")
p8_inc_10 <- ggplot(all_pval, aes(pval, fill = Species)) + scale_fill_manual(values=pal[1:2]) +
geom_density(show.legend = F, alpha = 1) +
scale_x_continuous(limits = c(0,1), breaks = seq(0,1,0.25)) + scale_y_continuous(labels=scaleFUN) +
theme_bw() + labs(title = "Day 1 to 3") + theme(plot.title = element_text(face = "bold")) +
geom_hline(yintercept = pi0est_humans_given_chimps, size = 2.5) + labs(x = "Unadjusted p-values") + labs(y = "Density") + geom_hline(yintercept = pi0est_humans, size = 2.5, color = "#00A4F4") +
annotate("text", label= 'bold(bolditalic(hat(pi)[0][", humans"])=="0.20")', parse=TRUE, x=0.2, y=(pi0est_humans+0.3), colour = "#00A4F4", size = 6) + annotate("text", label = 'bold(bolditalic(hat(pi)[0][", shared"])=="0.16")', parse=TRUE, x=0.2, y=(pi0est_humans_given_chimps+0.17), size = 6)
p8_inc_10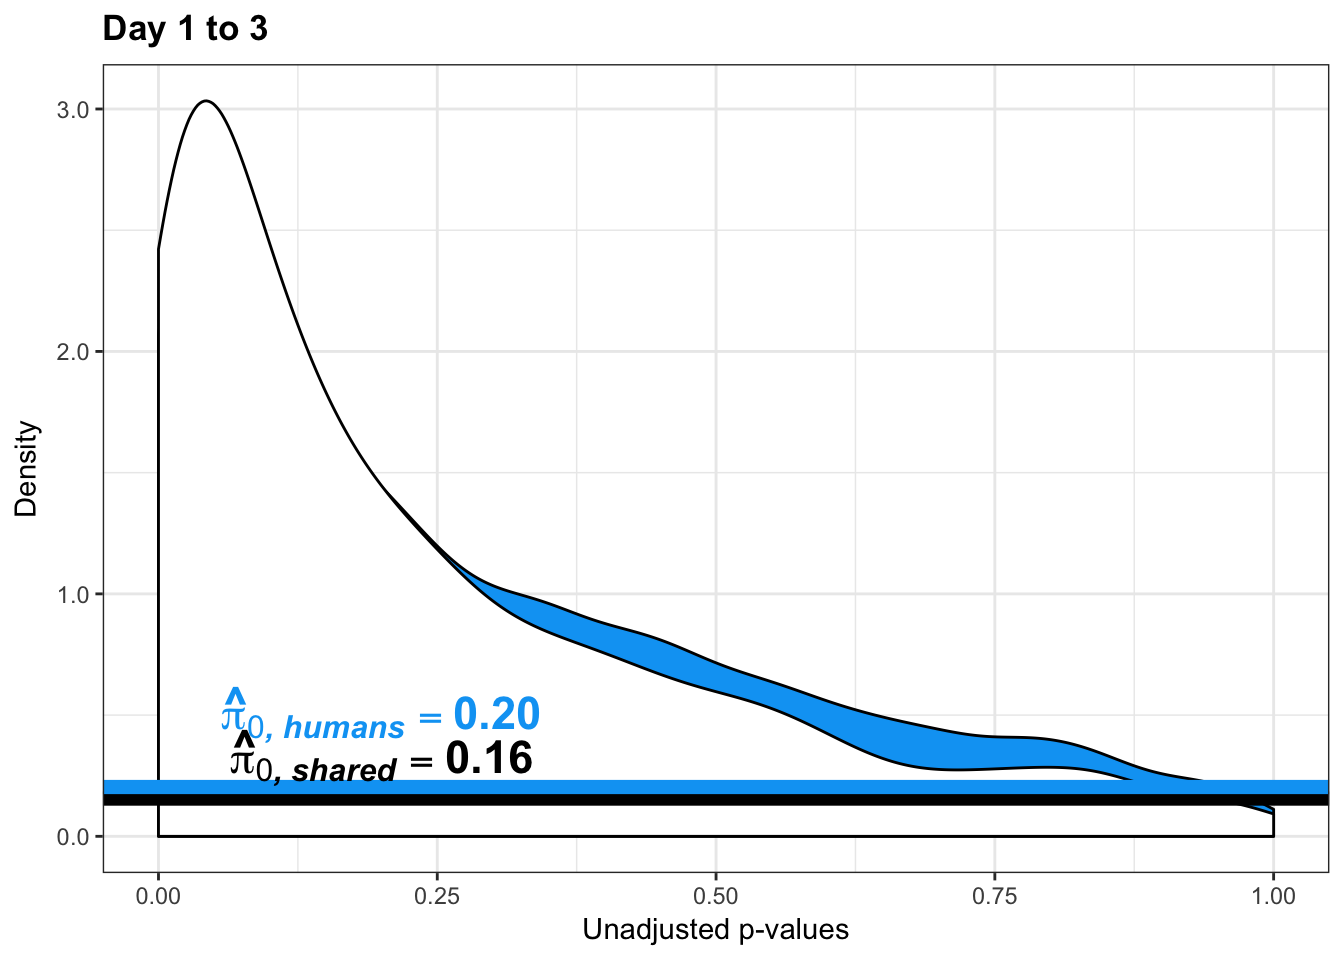
pval_c <- chimps[,1:2]
pval_h <- humans[,1:2]
pval_ch <- rbind(pval_h, pval_c)
resp <- rep(c("Days 1 to 3"), times = nrow(pval_c)+nrow(pval_h))
line1 <- as.data.frame(rep(c("0.20"), times = nrow(pval_h)))
colnames(line1) <- c("line")
line2 <- as.data.frame(rep(c("0.16"), times = nrow(pval_c)))
colnames(line2) <- c("line")
line <- rbind(line1, line2)
figS12A_fig <- cbind(pval_ch, resp, line)
figS12A <- rbind(figS12A, figS12A_fig)
#write.csv(figS12A, "/Users/laurenblake/Dropbox/Endoderm TC/Draft versions/Resubmit1_Genome Biology/Supplemental/Data_figS14L.csv", quote = FALSE, row.names = FALSE)
multiplot(p1_inc_10,p5_inc_10,p2_inc_10,p6_inc_10,p3_inc_10,p7_inc_10,p4_inc_10,p8_inc_10,cols=4)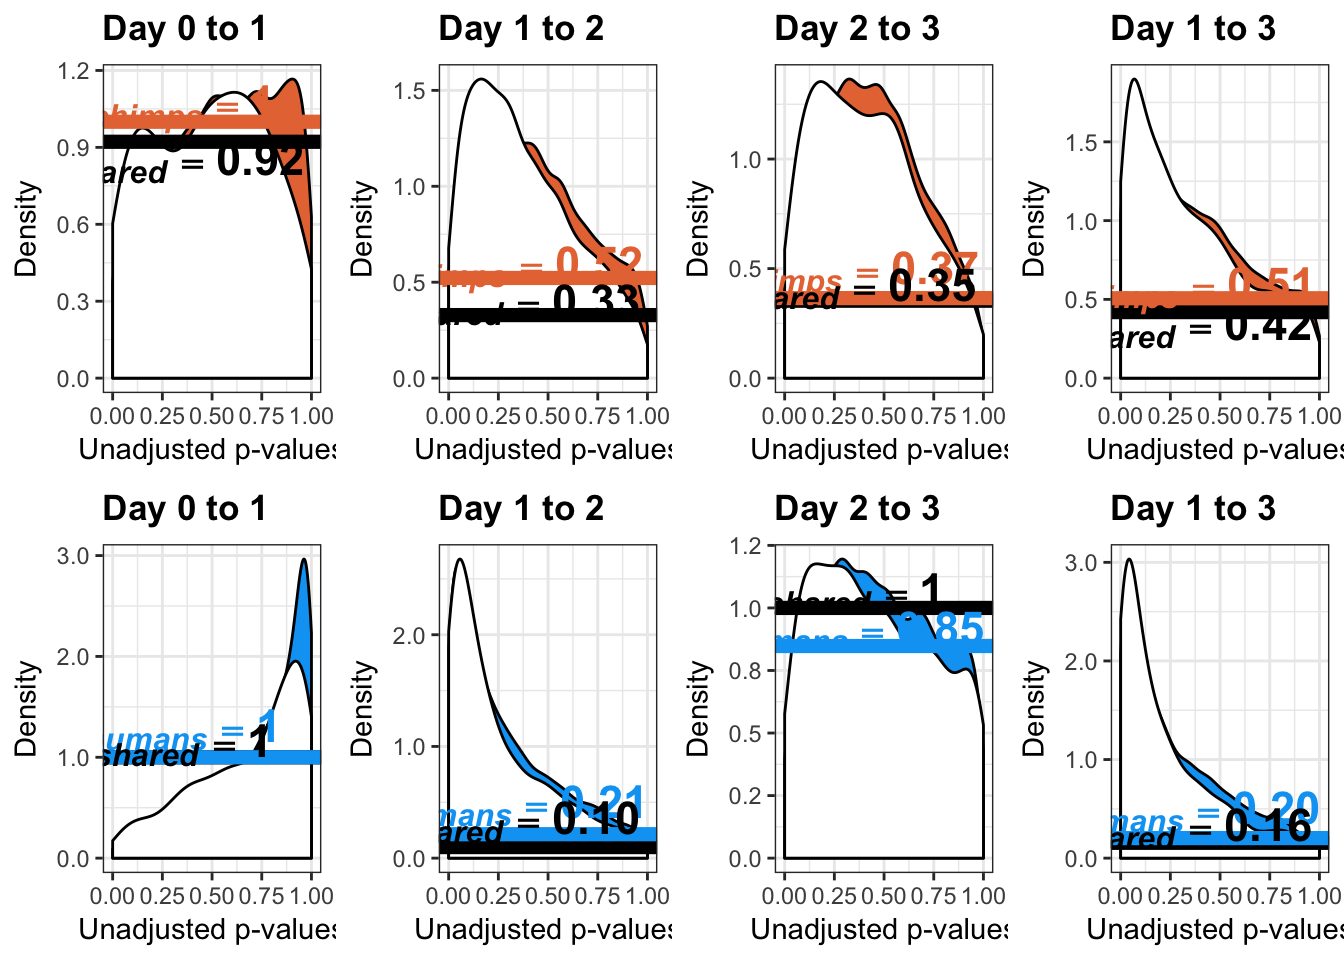
Note: code to make other figures
# 6A)
multiplot(p1s,p3s,p2s,p3_13s, cols=2)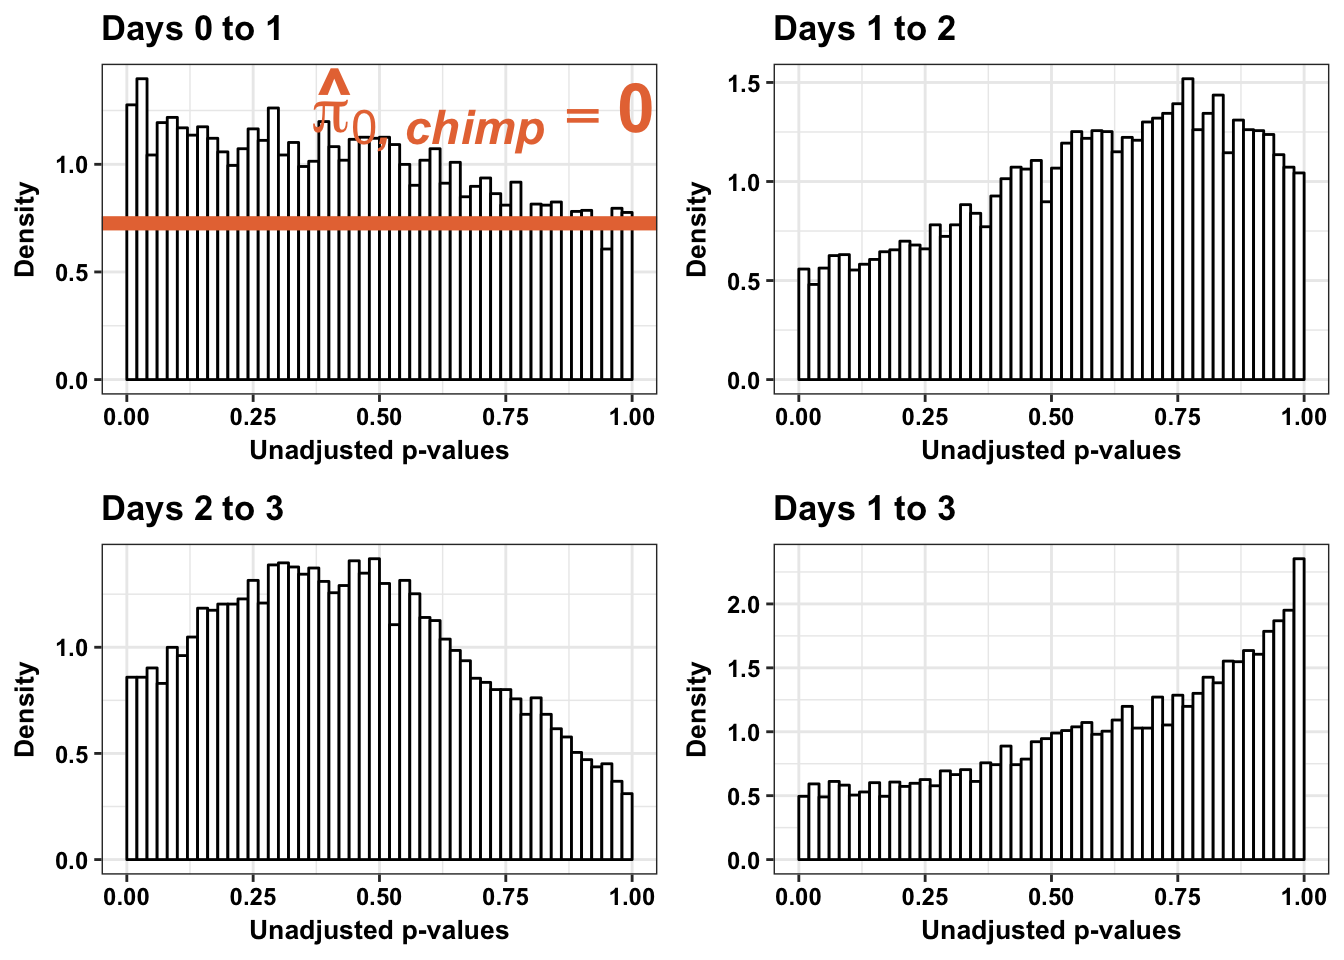
# 6B)
multiplot(p1s,p3s,p2s,p3_13s, cols=2)
# 6C-F)
multiplot(p1_05, p2_inc_05, p5_05, p6_inc_05, cols=2)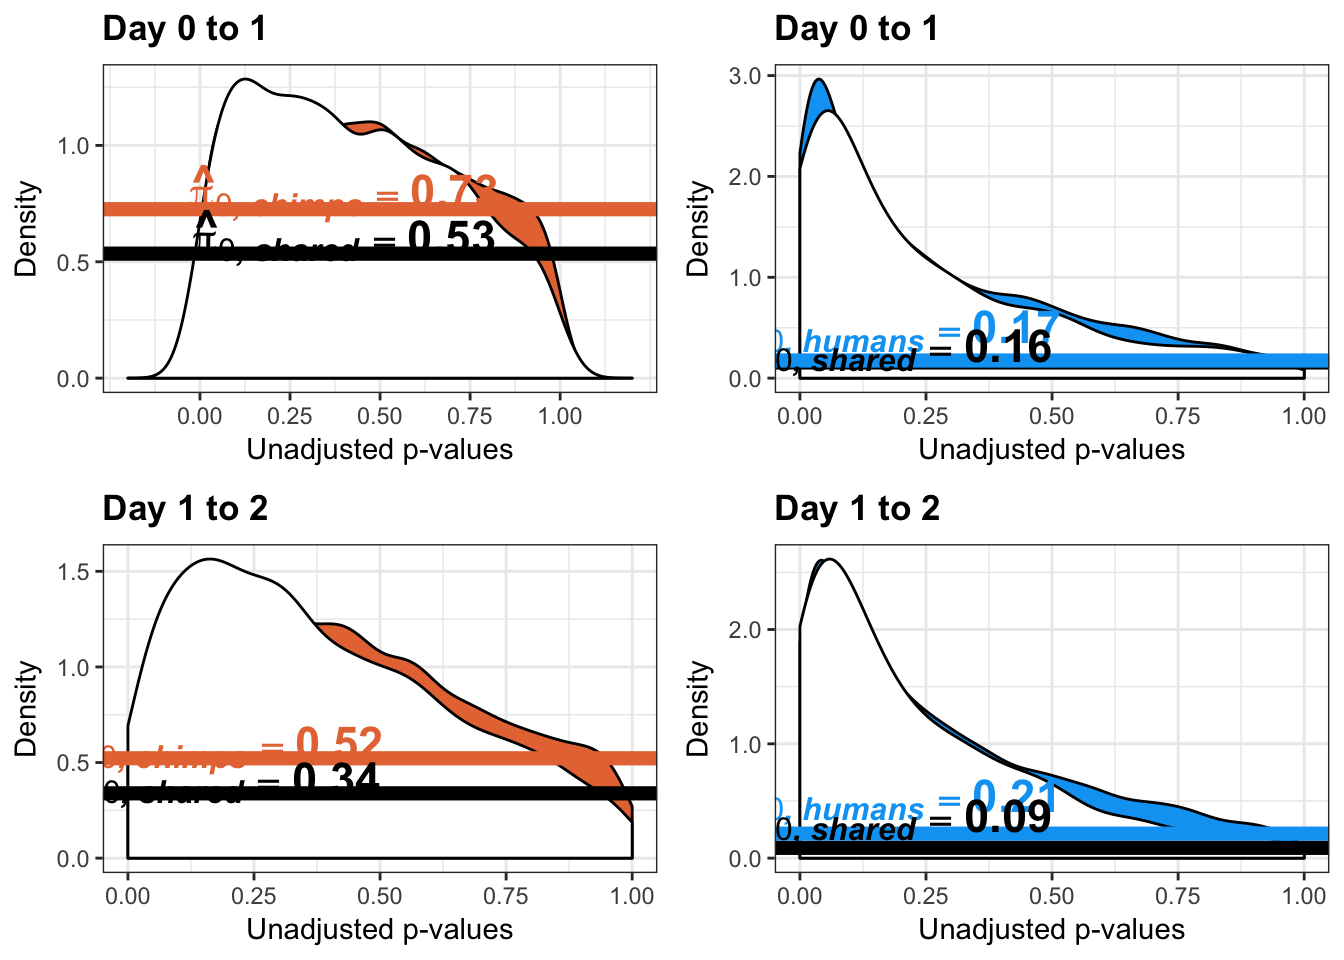
# SF 12A)
multiplot(p1,p2,p3,p3_13, cols=2)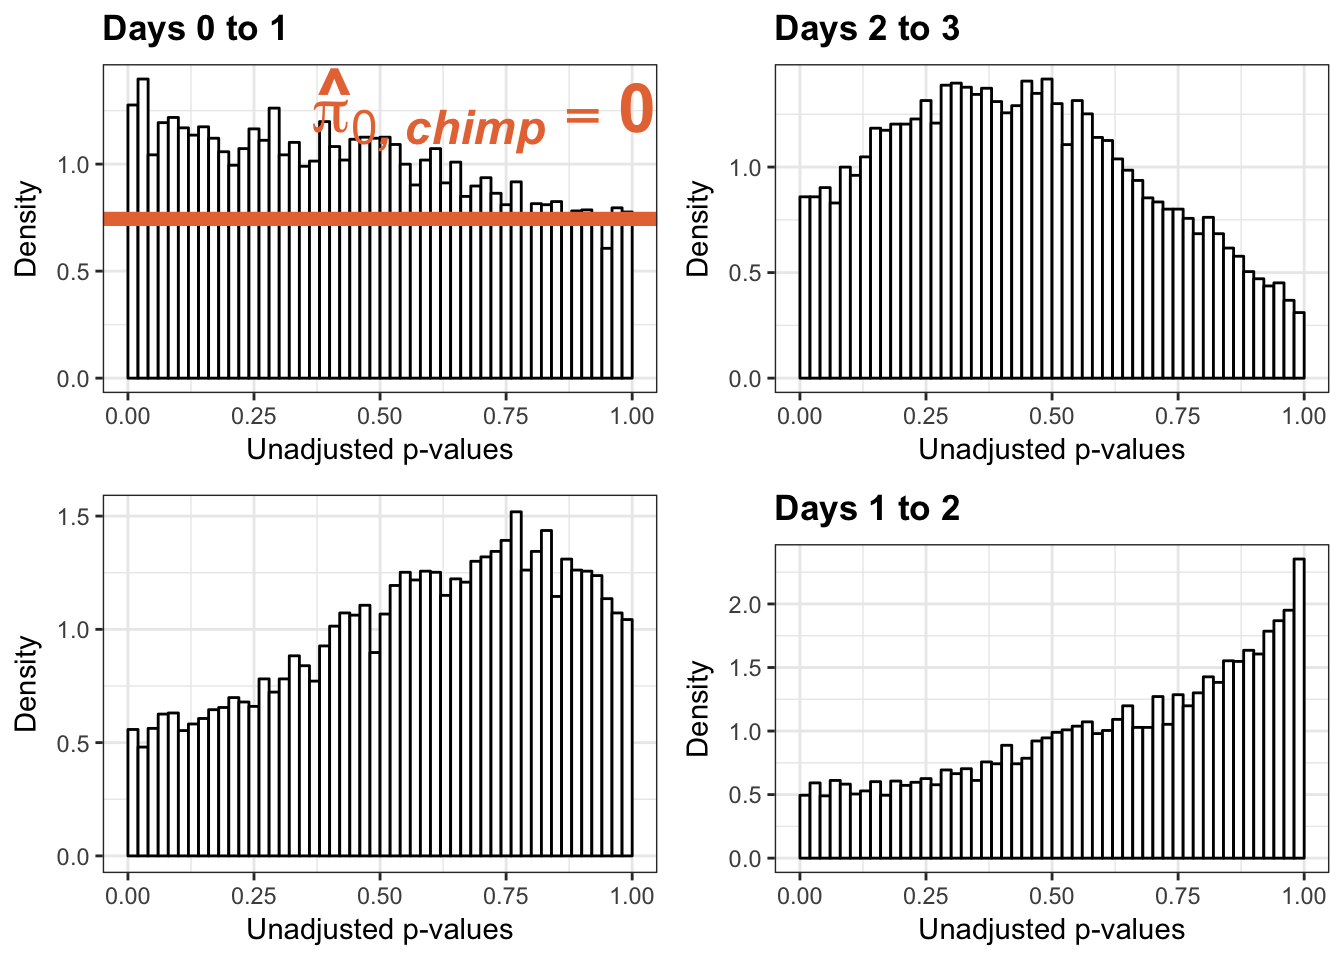
# SF12 B)
multiplot(p4,p5,p6,p6_13, cols=2)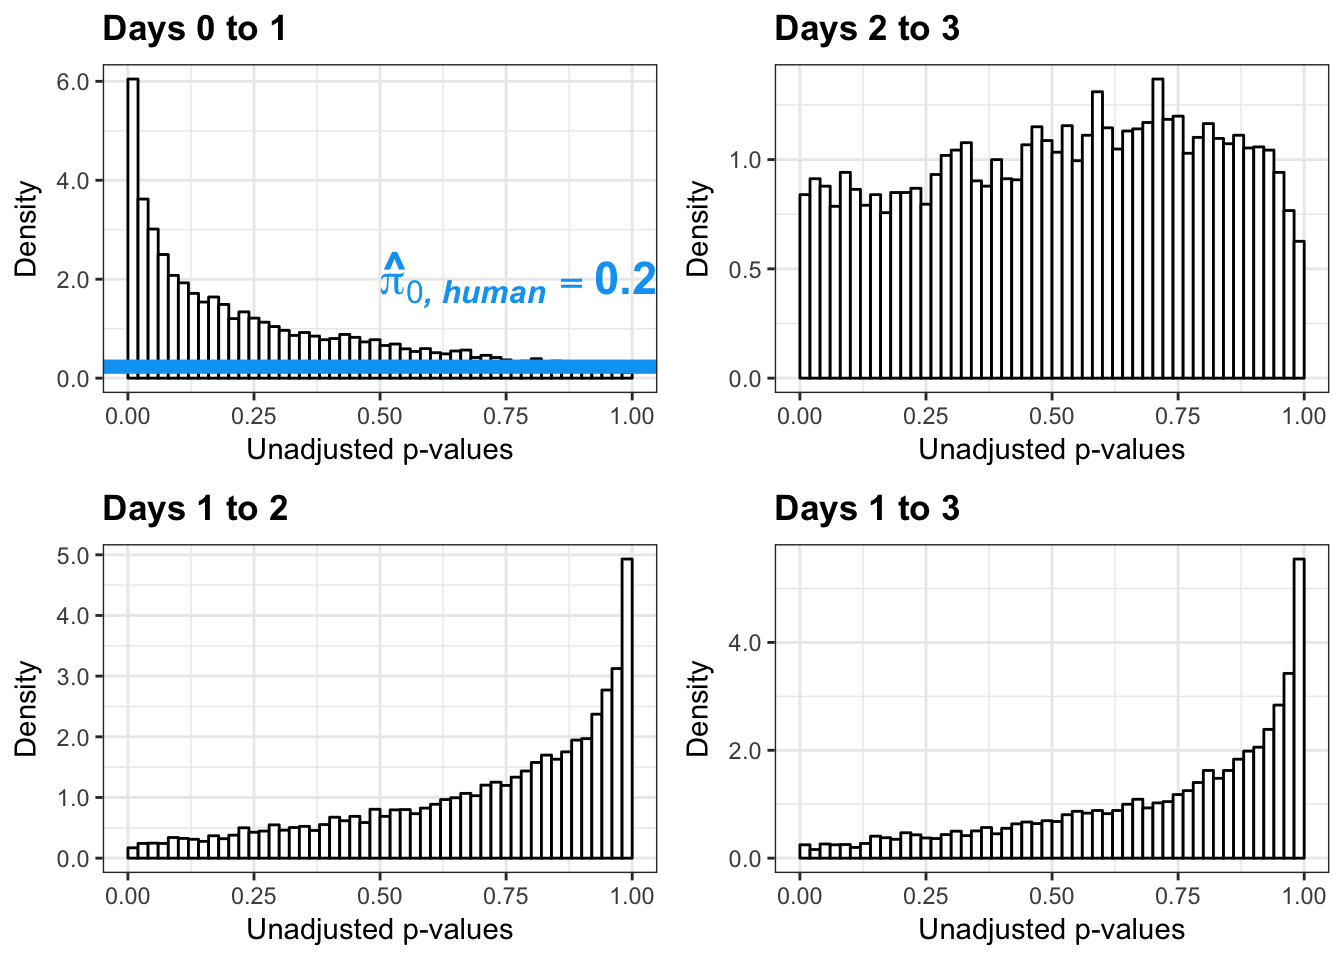
# SF13 A)
multiplot(p2_05, p3_05,p4_05,cols=2)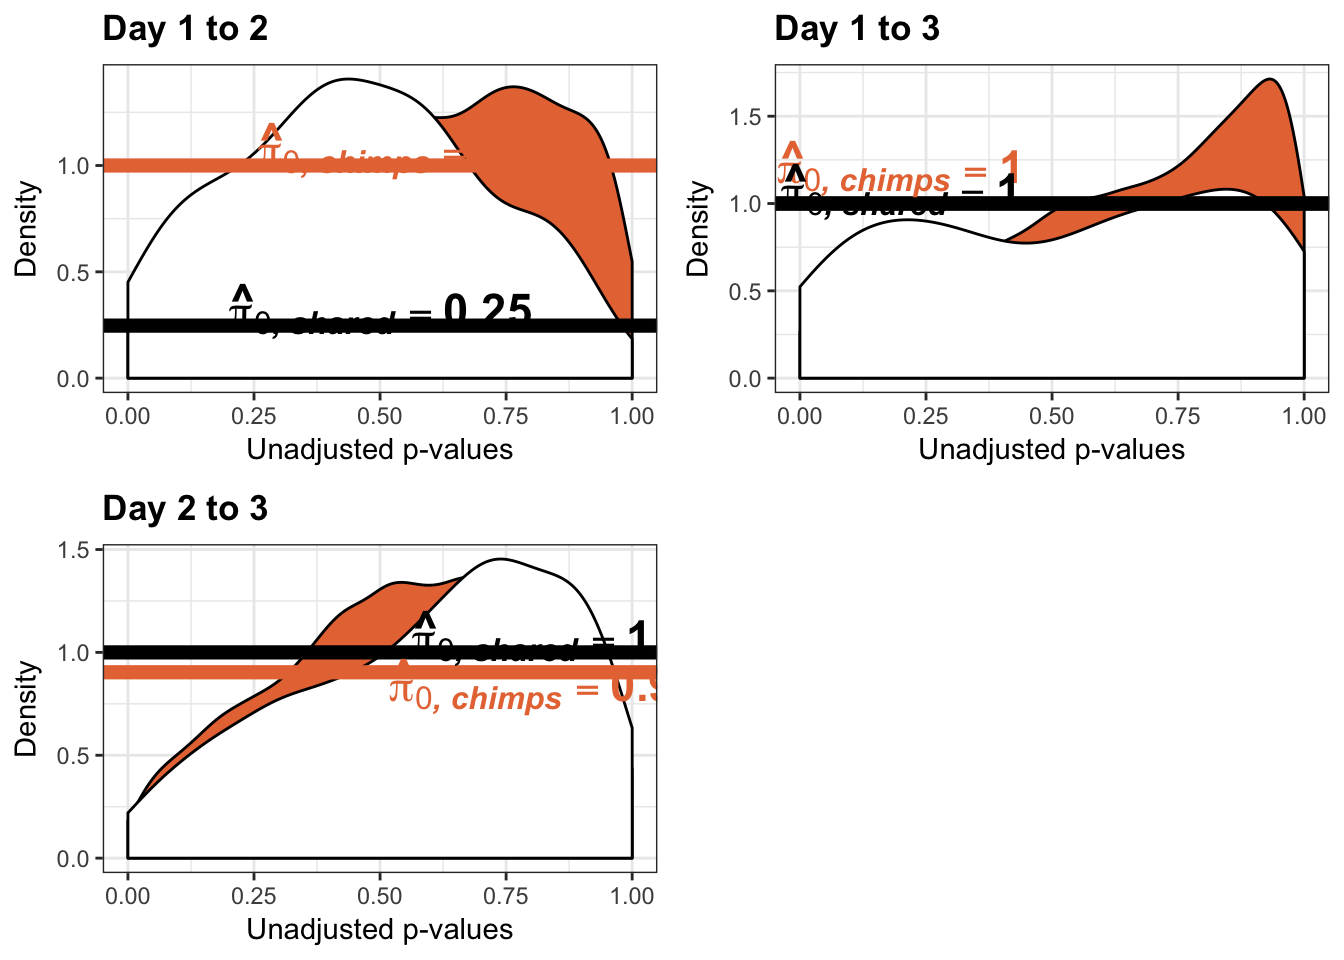
# SF13 B)
multiplot(p6_05, p7_05,p8_05,cols=2)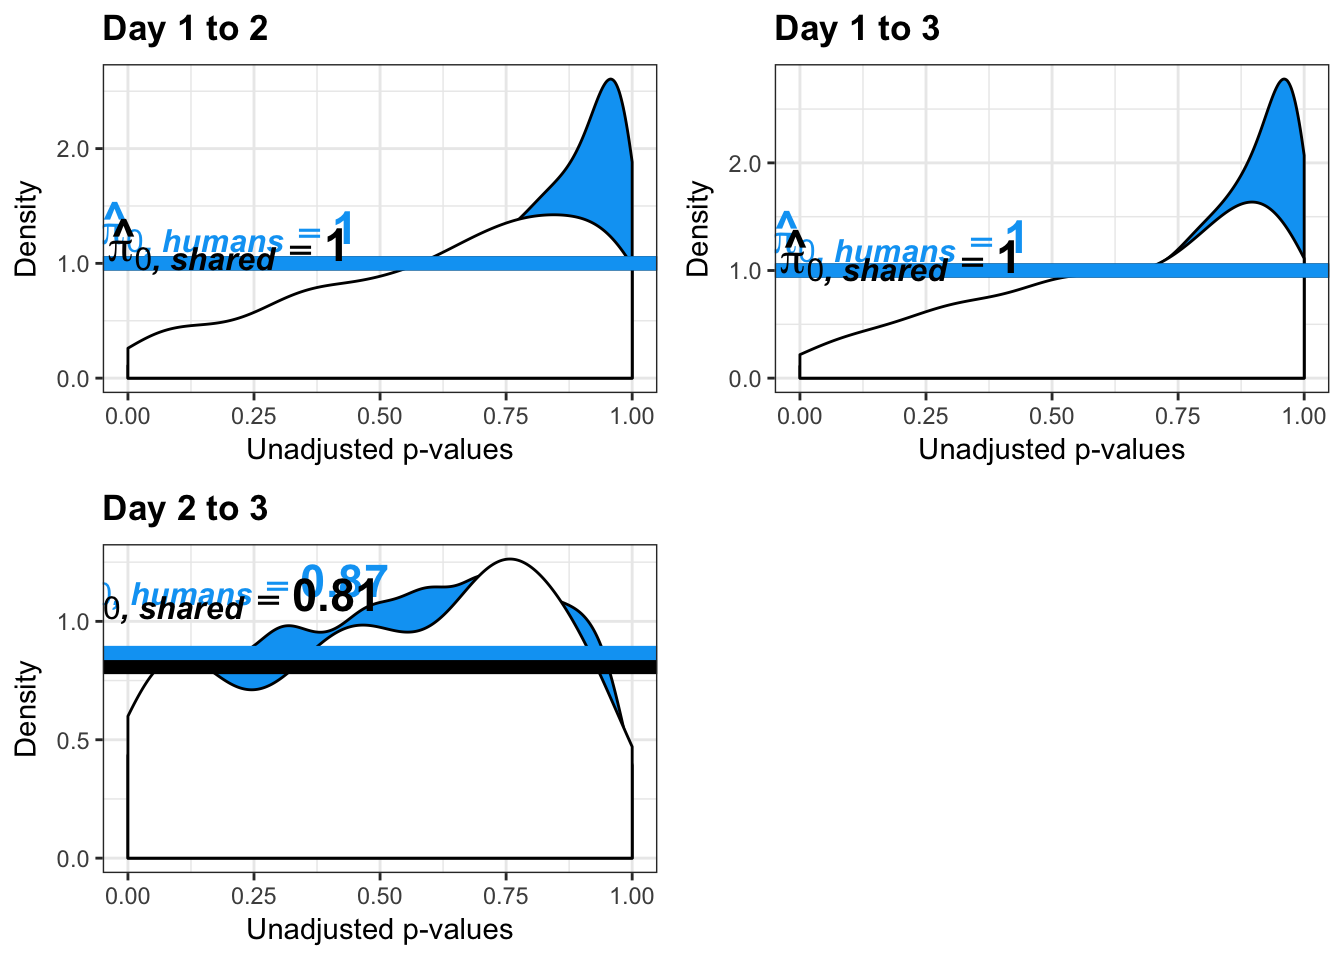
# SF13 C)
multiplot(p1_inc_05, p3_inc_05,p4_inc_05,cols=2)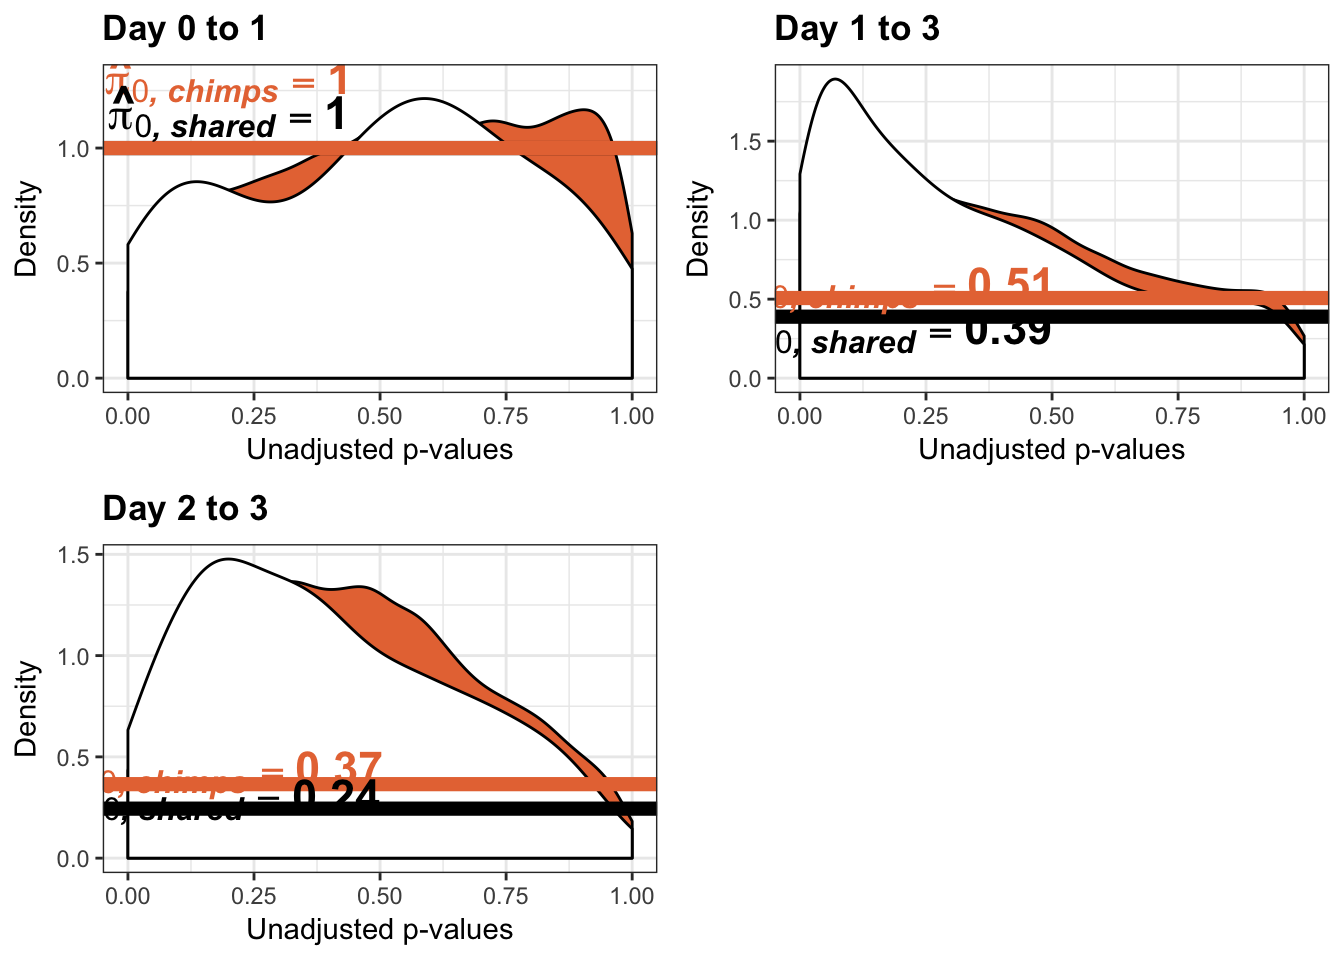
# SF13 D)
multiplot(p5_inc_05, p7_inc_05,p8_inc_05,cols=2)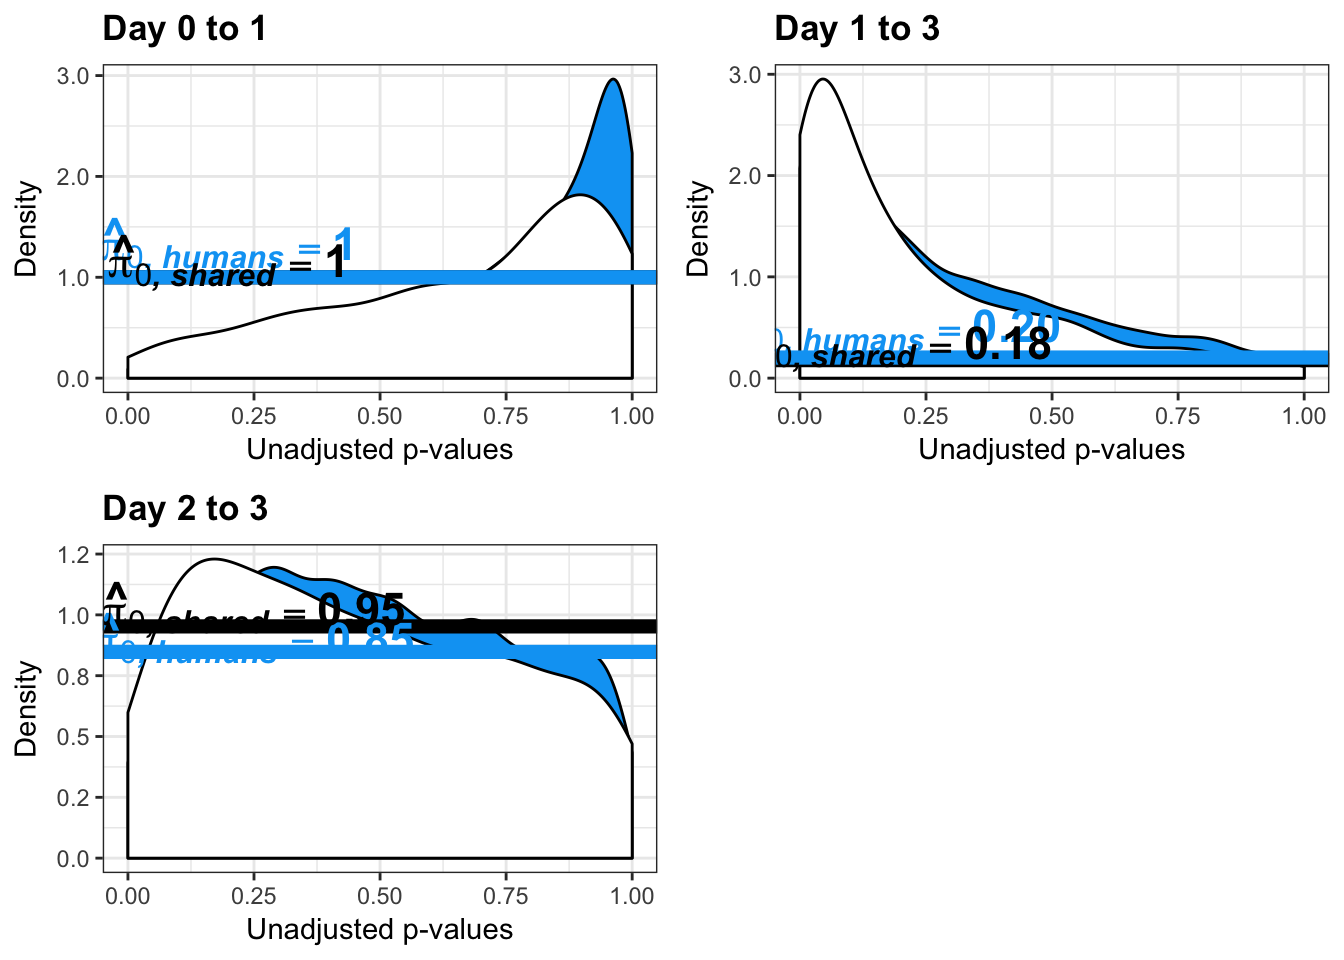
# SF14 E)
multiplot(p1_01, p3_01,p4_01,cols=2)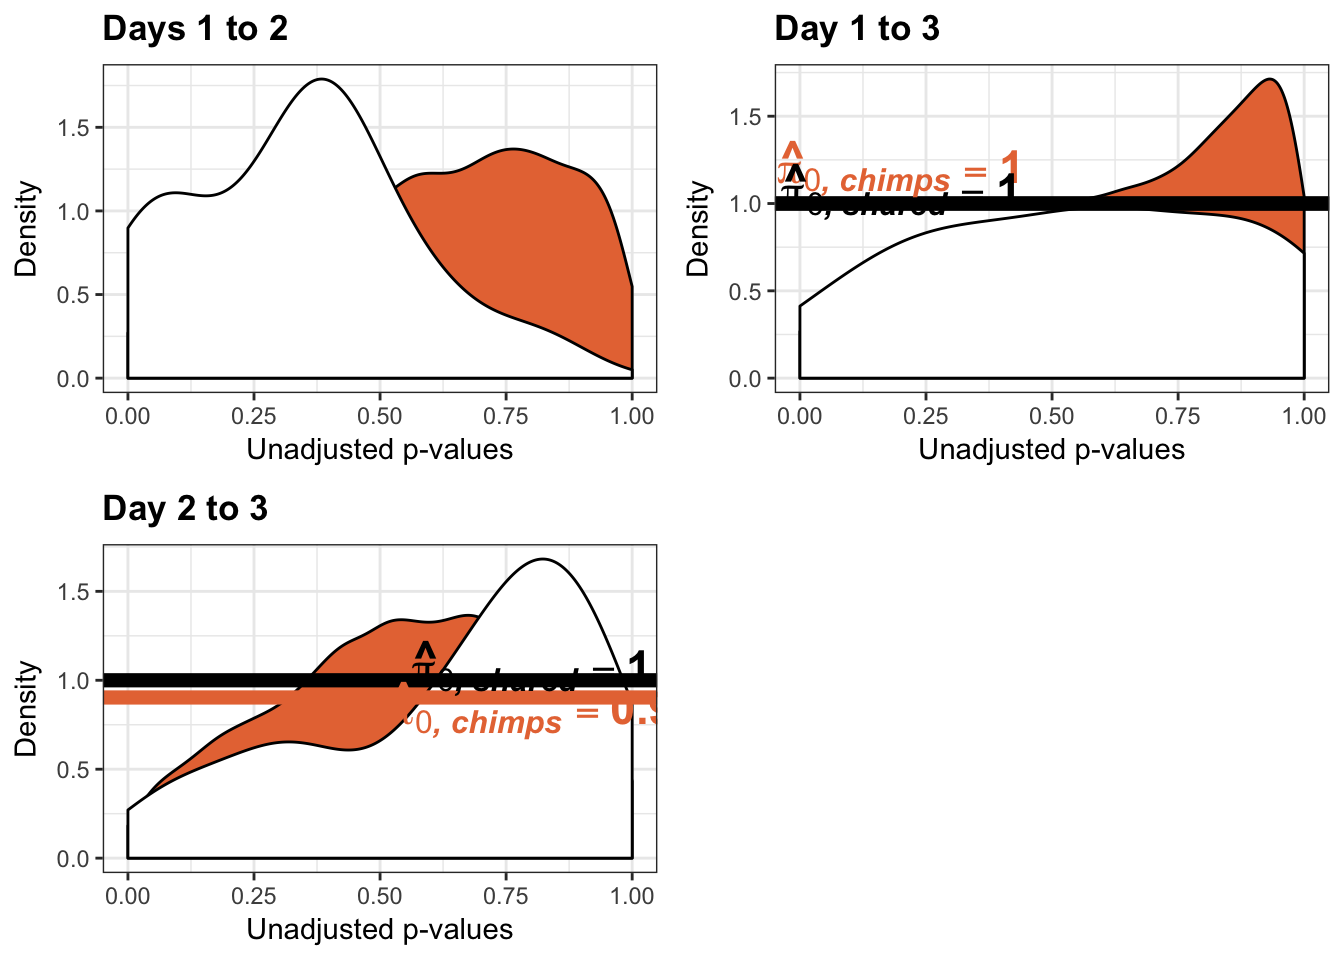
# SF14 F)
multiplot(p5_01, p6_01, p7_01,p8_01,cols=2)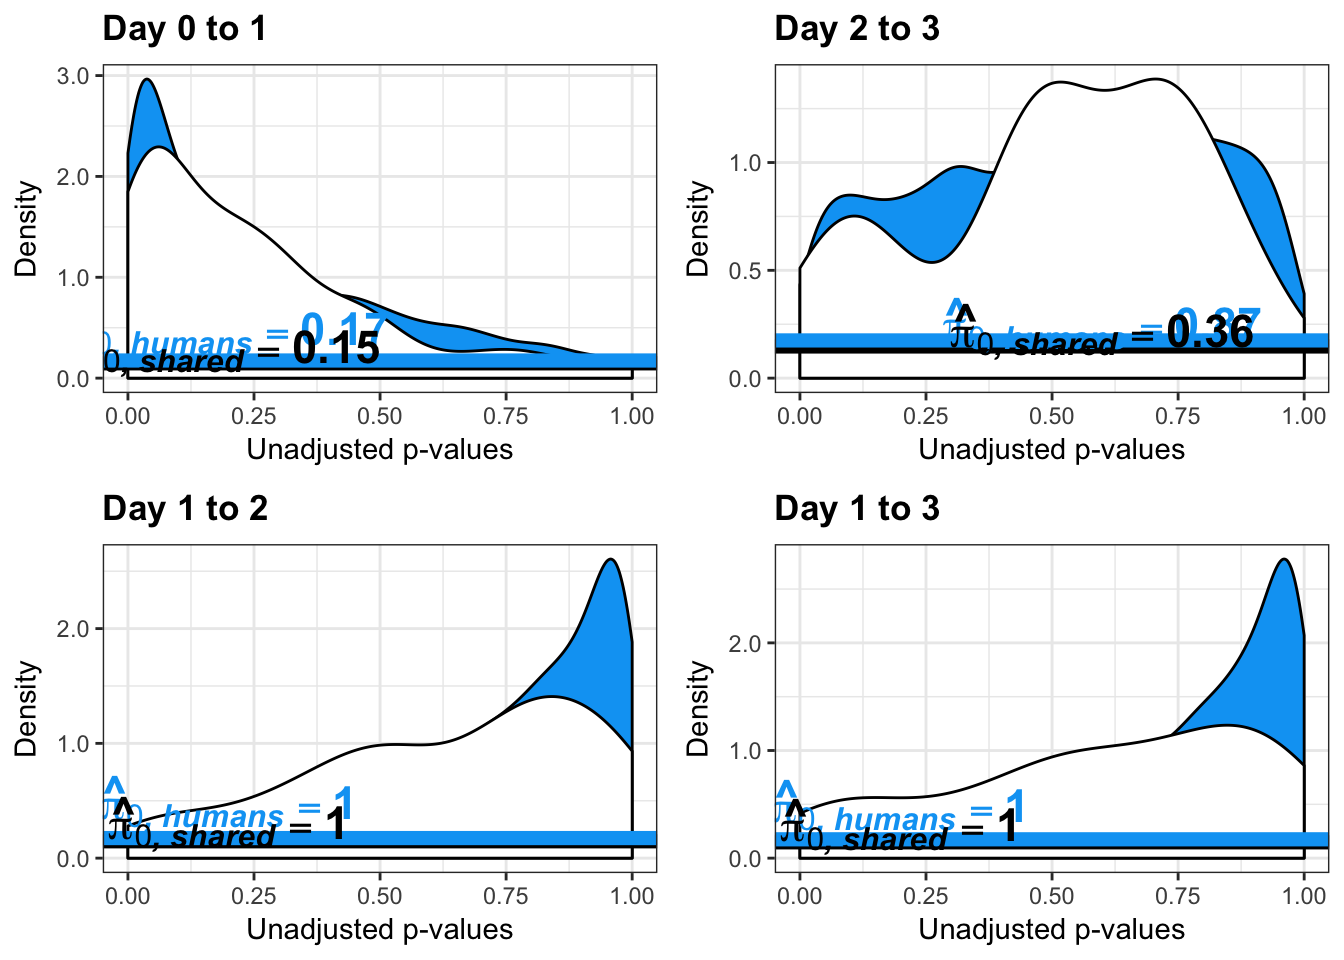
# SF14 G)
multiplot(p1_inc_01, p2_inc_01, p3_inc_01,p4_inc_01,cols=2)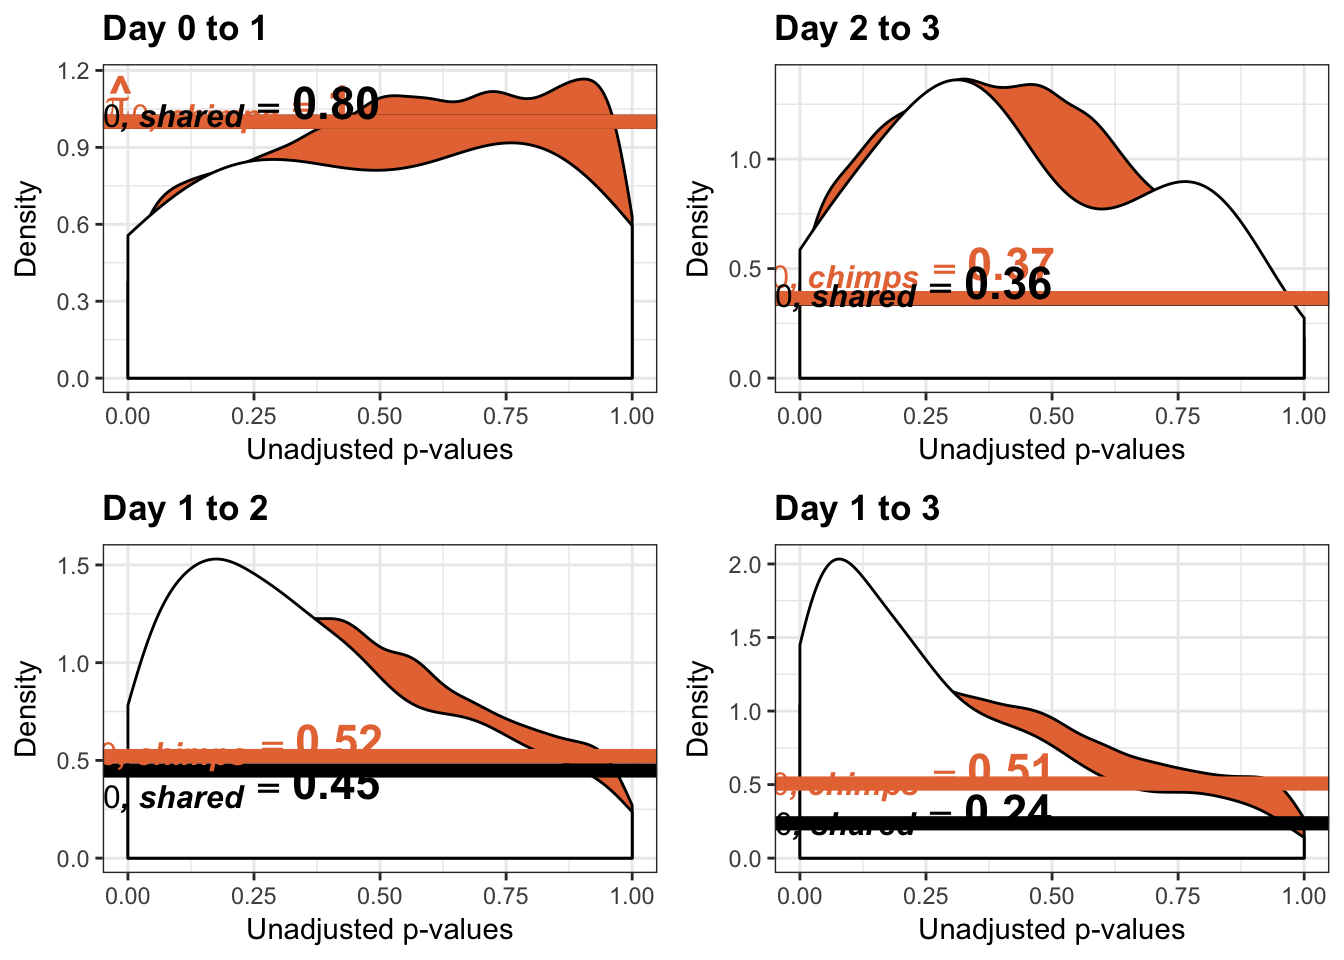
# SF14 H)
multiplot(p5_inc_01, p6_inc_01, p7_inc_01,p8_inc_01,cols=2)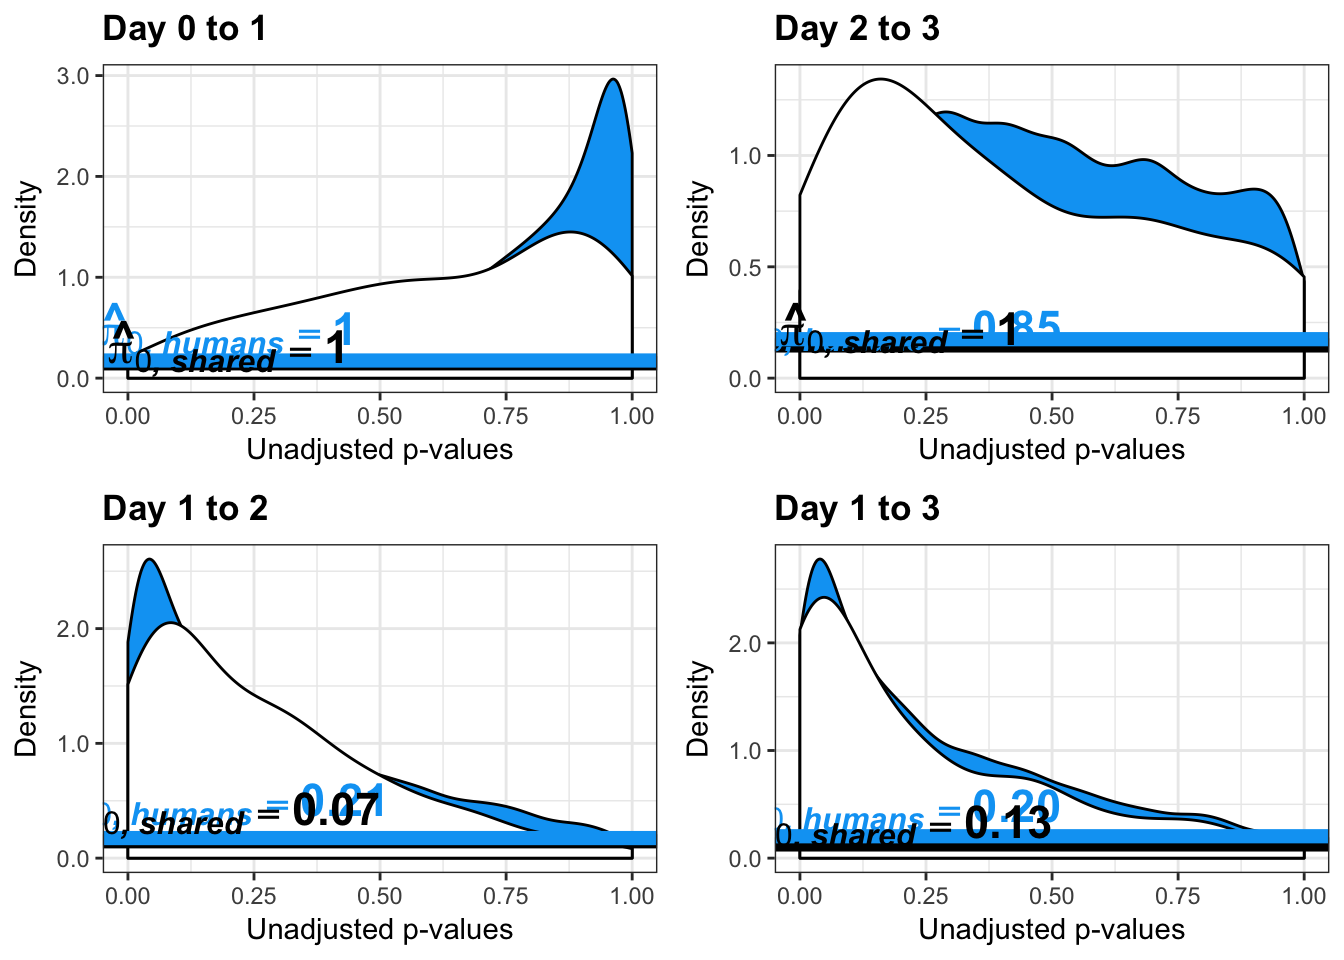
# SF14 I)
multiplot(p1_10, p2_10, p3_10,p4_10,cols=2)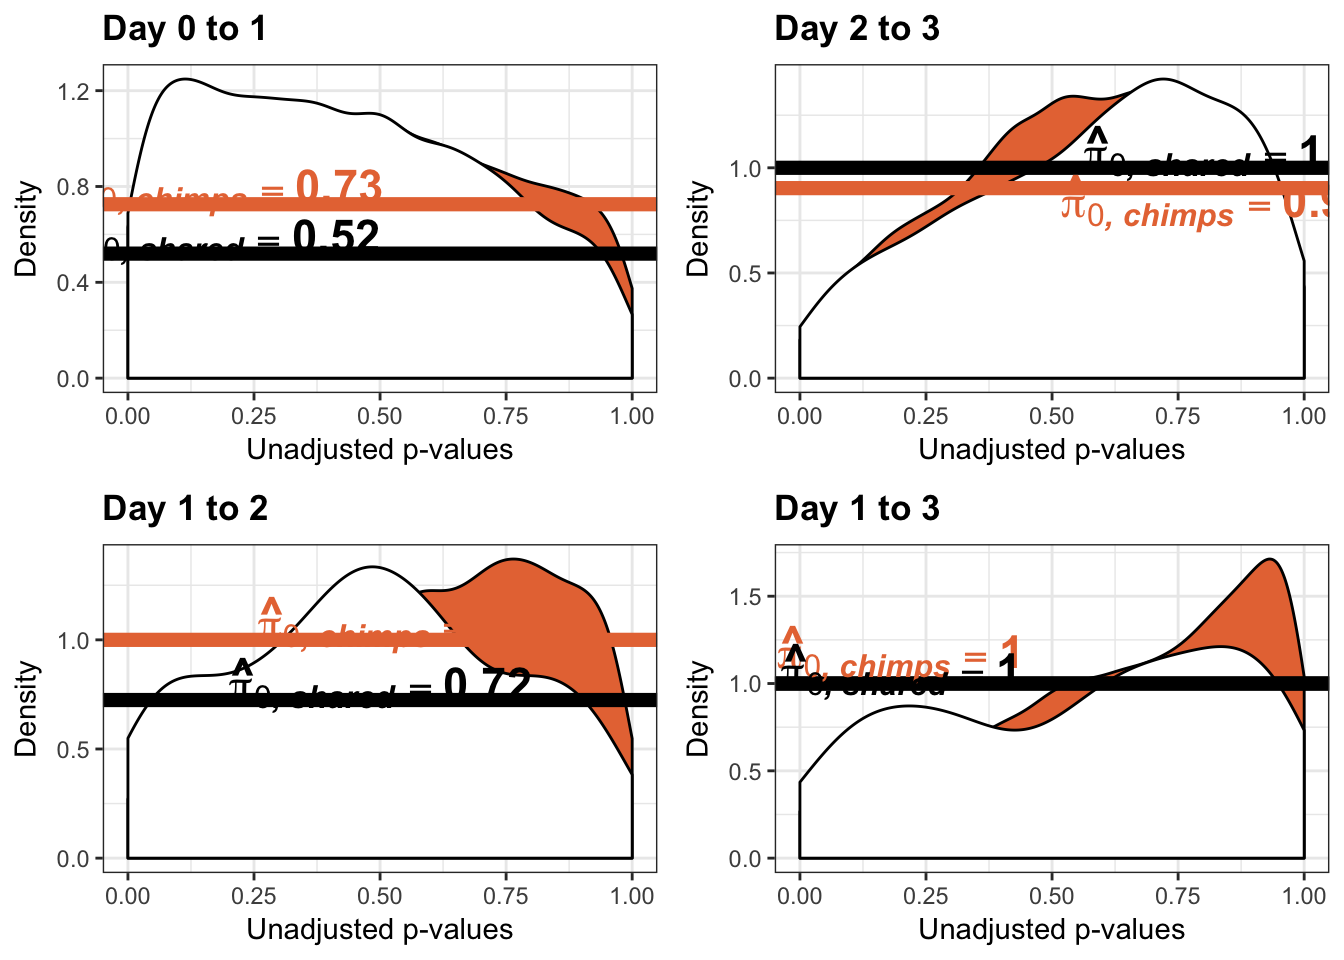
# SF14 J)
multiplot(p5_10, p6_10, p7_10,p8_10,cols=2)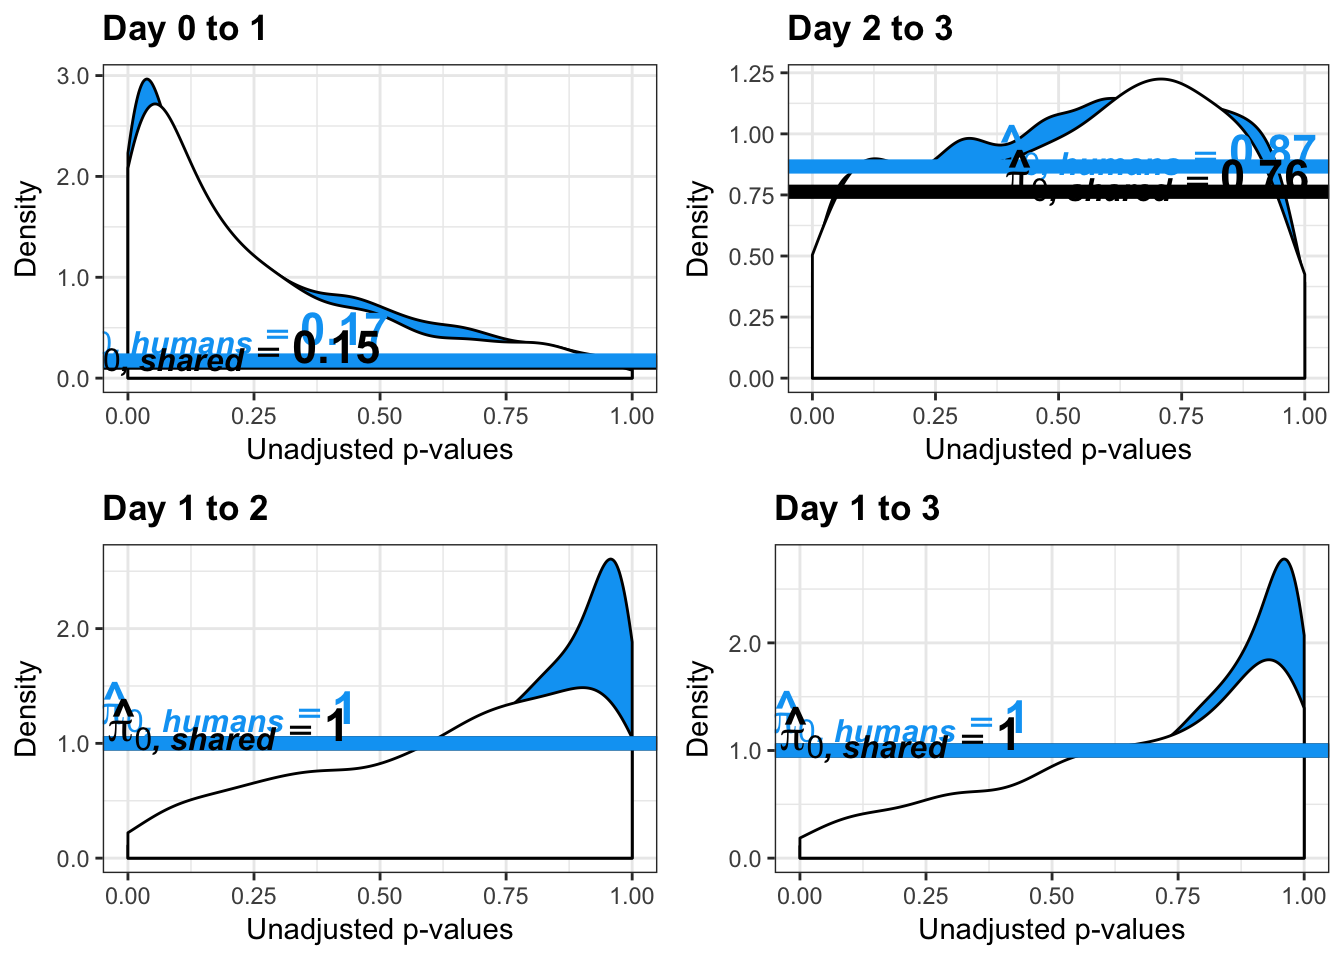
# SF14 K)
multiplot(p1_inc_10, p2_inc_10, p3_inc_10,p4_inc_10,cols=2)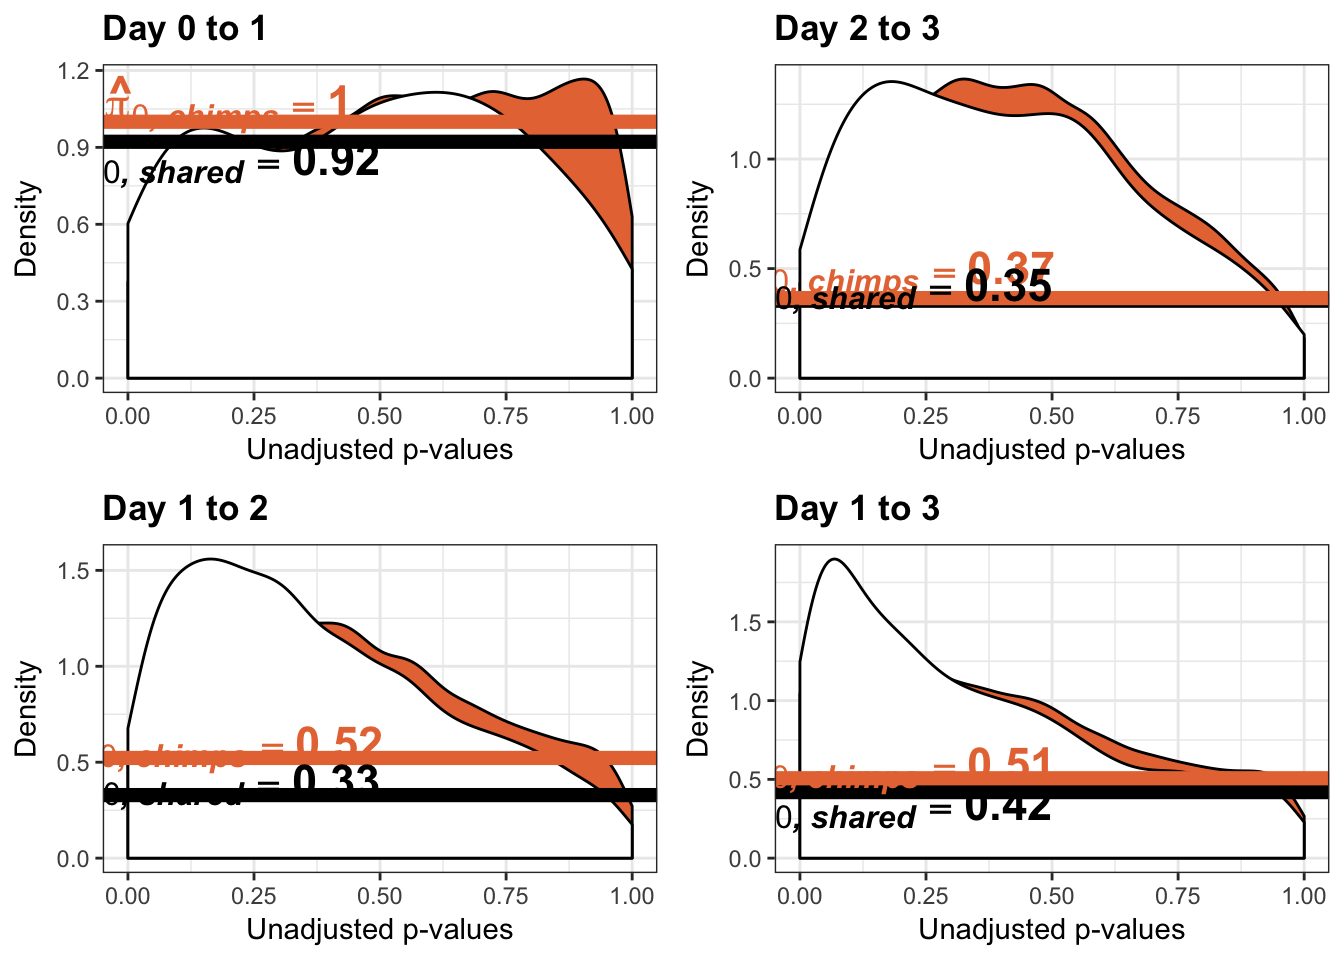
# SF14 L)
multiplot(p5_inc_10, p6_inc_10, p7_inc_10,p8_inc_10,cols=2)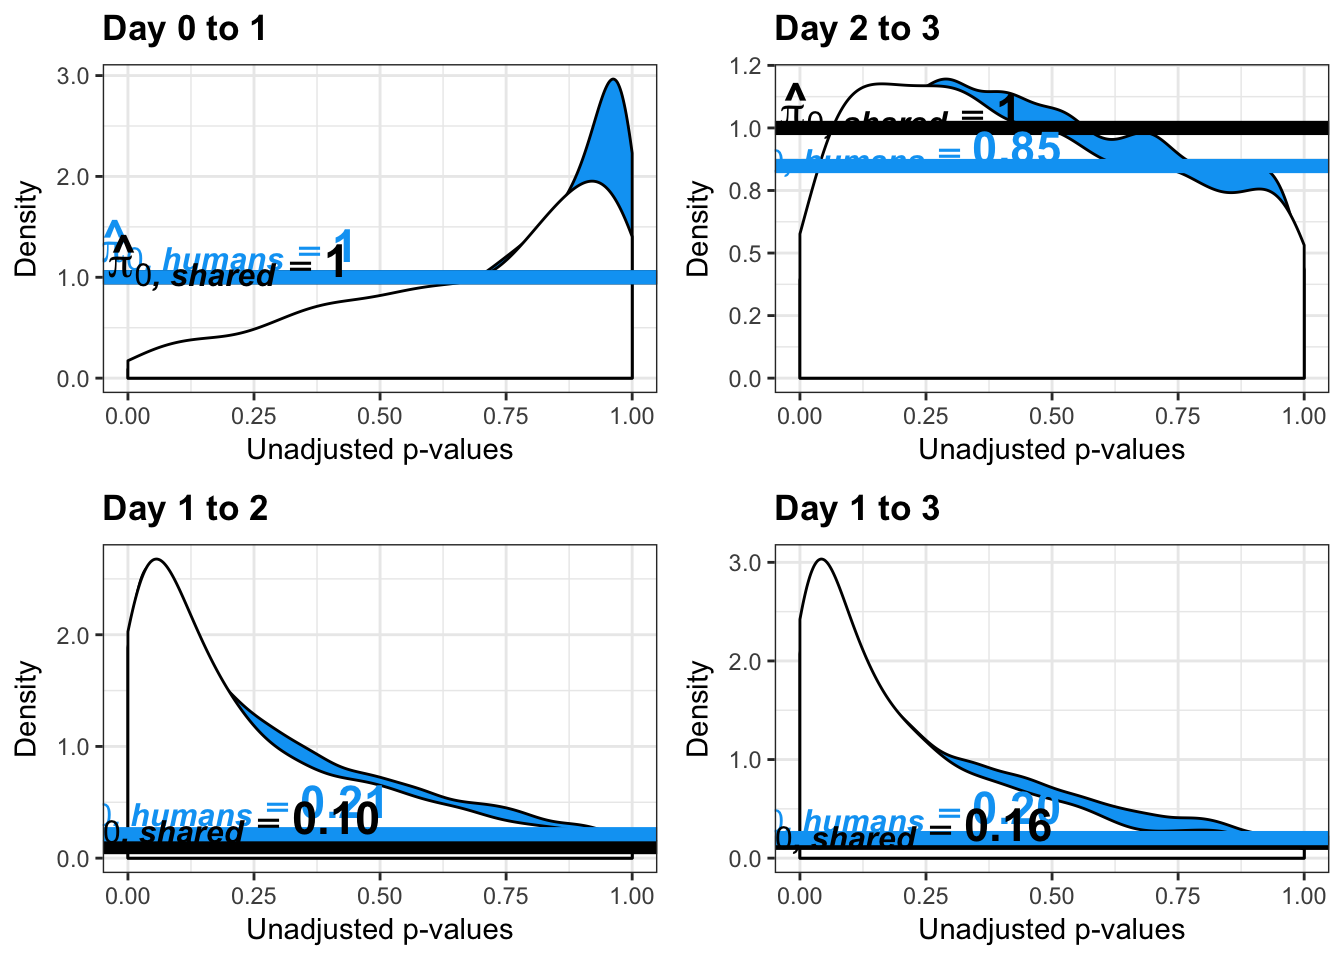
Gene names showing reduction (increase) in variance from days 0 to 1 (days 1 to 2)
# Reduction Day 0 to 1 chimps
chimp_var_pval <- array(NA, dim = c(10304, 1))
for(i in 1:10304){
x <- t(mean_tech_reps[i,7:10])
y <- t(mean_tech_reps[i,17:20])
htest <- var.test(x, y, alternative = c("greater"))
chimp_var_pval[i,1] <- htest$p.value
}
rownames(chimp_var_pval) <- rownames(mean_tech_reps)
length(which(chimp_var_pval < 0.05))[1] 664chimp_red_01 <- as.data.frame(chimp_var_pval[which(chimp_var_pval < 0.05), ])
dim(chimp_red_01)[1] 664 1#write.table(chimp_red_01,file="~/Desktop/Endoderm_TC/ashlar-trial/data/red_chimps_day0_1.txt",sep="\t", col.names = T, row.names = T)
# Reduction Day 0 to 1 humans
human_var_pval <- array(NA, dim = c(10304, 1))
for(i in 1:10304){
x <- t(mean_tech_reps[i,1:6])
y <- t(mean_tech_reps[i,11:16])
htest <- var.test(x, y, alternative = c("greater"))
human_var_pval[i,1] <- htest$p.value
}
rownames(human_var_pval) <- rownames(mean_tech_reps)
length(which(human_var_pval < 0.05))[1] 2309human_red_01 <- as.data.frame(human_var_pval[which(human_var_pval < 0.05), ])
dim(human_red_01)[1] 2309 1#write.table(human_red_01,file="~/Desktop/Endoderm_TC/ashlar-trial/data/red_human_day0_1.txt",sep="\t", col.names = T, row.names = T)
# Increase Day 1 to 2 chimps
chimp_var_pval <- array(NA, dim = c(10304, 1))
for(i in 1:10304){
x <- t(mean_tech_reps[i,17:20])
y <- t(mean_tech_reps[i,27:30])
htest <- var.test(x, y, alternative = c("less"))
chimp_var_pval[i,1] <- htest$p.value
}
rownames(chimp_var_pval) <- rownames(mean_tech_reps)
length(which(chimp_var_pval < 0.05))[1] 558chimp_inc_12 <- as.data.frame(chimp_var_pval[which(chimp_var_pval < 0.05), ])
dim(chimp_inc_12)[1] 558 1write.table(chimp_inc_12,file="~/Desktop/Endoderm_TC/ashlar-trial/data/inc_chimps_day1_2.txt",sep="\t", col.names = T, row.names = T)
# Increase Day 1 to 2 humans
human_var_pval <- array(NA, dim = c(10304, 1))
for(i in 1:10304){
x <- t(mean_tech_reps[i,11:16])
y <- t(mean_tech_reps[i,21:26])
htest <- var.test(x, y, alternative = c("less"))
human_var_pval[i,1] <- htest$p.value
}
rownames(human_var_pval) <- rownames(mean_tech_reps)
length(which(human_var_pval < 0.05))[1] 1968human_inc_12 <- as.data.frame(human_var_pval[which(human_var_pval < 0.05), ])
dim(human_inc_12)[1] 1968 1#write.table(human_inc_12,file="~/Desktop/Endoderm_TC/ashlar-trial/data/inc_human_day1_2.txt",sep="\t", col.names = T, row.names = T)