Analysis_of_counfounders2_gene_exp
Lauren Blake
July 21, 2016
This script is a follow up to the analysis of technical variables for the gene expression data.
The impact of when the samples were collected (relative to time of death)
There was a concern that “Hours post-mortem” were confounded by species. For example, according to the documentation that we received from the different sites, the rhesus macaque samples were collected earlier than the chimpanzee samples and the chimpanzee samples were collected earlier than humans. These differences could impact the quality of the RNA. We can look at RIN score as a proxy for RNA quality. Therefore, we will look to see if there are differences in RIN score
Note: RIN score is missing for H4Lu
# Load libraries

library("ggplot2")

# Load information about the

RNA_seq_info <- read.csv("~/Reg_Evo_Primates/ashlar-trial/data/RNA_seq_info.csv")

# Boxplot RIN score by species

new_plot <- ggplot(data = RNA_seq_info, aes(y = RIN.score, x = Species)) + geom_boxplot() + geom_point(aes(color = Tissue), size = 5,  position=position_jitter(width=0.2, height=0.1))
new_plot + labs(title = "RIN score versus species by tissue", y = "RIN score", x = "Species")
## Warning: Removed 1 rows containing non-finite values (stat_boxplot).## Warning: Removed 1 rows containing missing values (geom_point).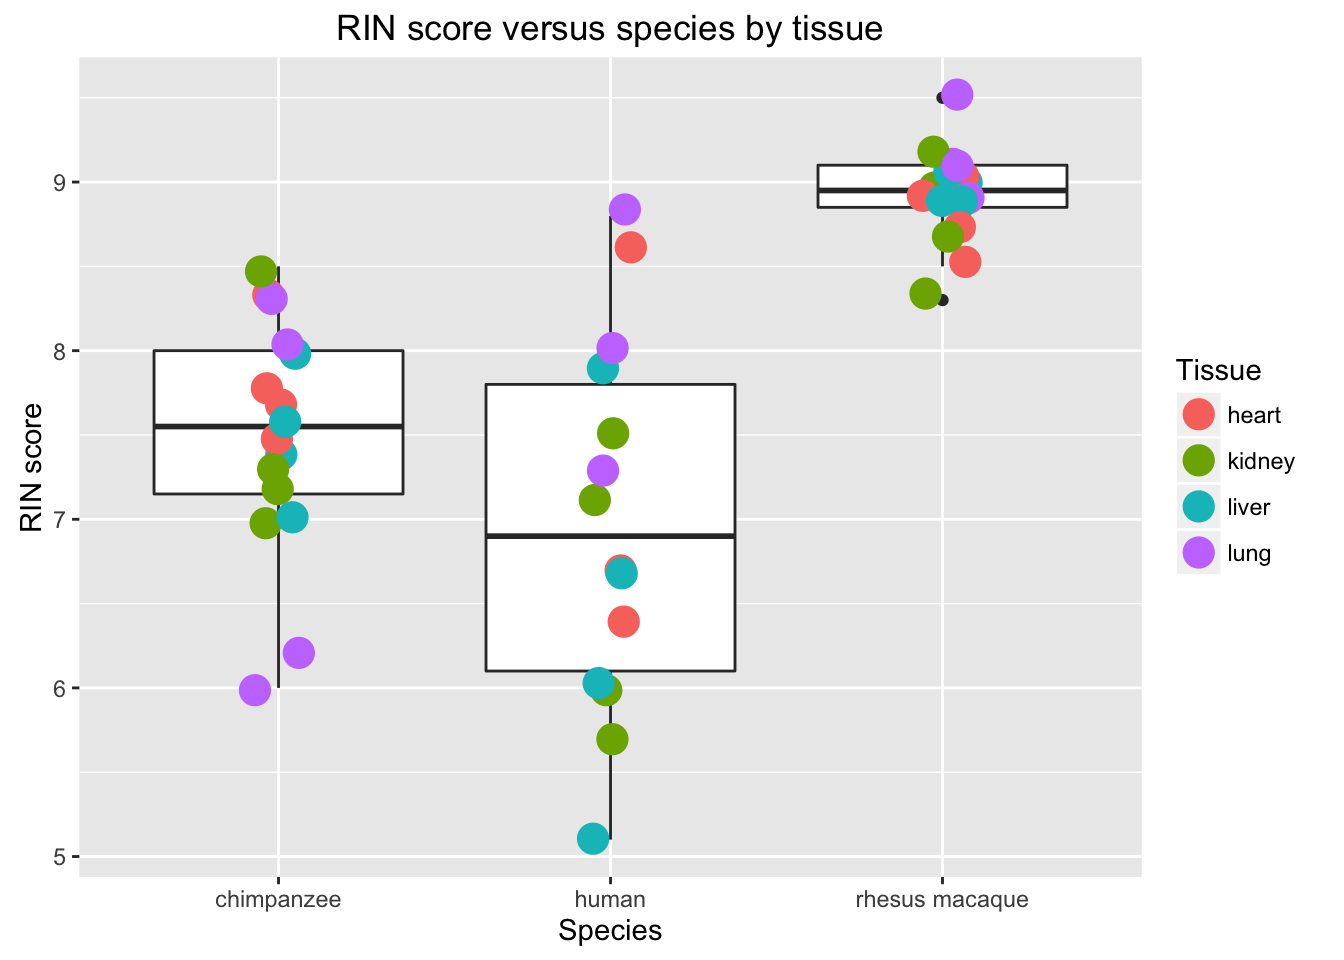
# RIN score by species with individual name

new_plot <- ggplot(data = RNA_seq_info, aes(y = RIN.score, x = Species, label = RNA_seq_info$Individual)) + geom_point(aes(color = Tissue), size = 5)
new_plot + geom_text(vjust = -0.4, nudge_y = 1.5) + labs(title = "RIN score versus species by tissue", y = "RIN score", x = "Species")
## Warning: Removed 1 rows containing missing values (geom_point).## Warning: Removed 1 rows containing missing values (geom_text).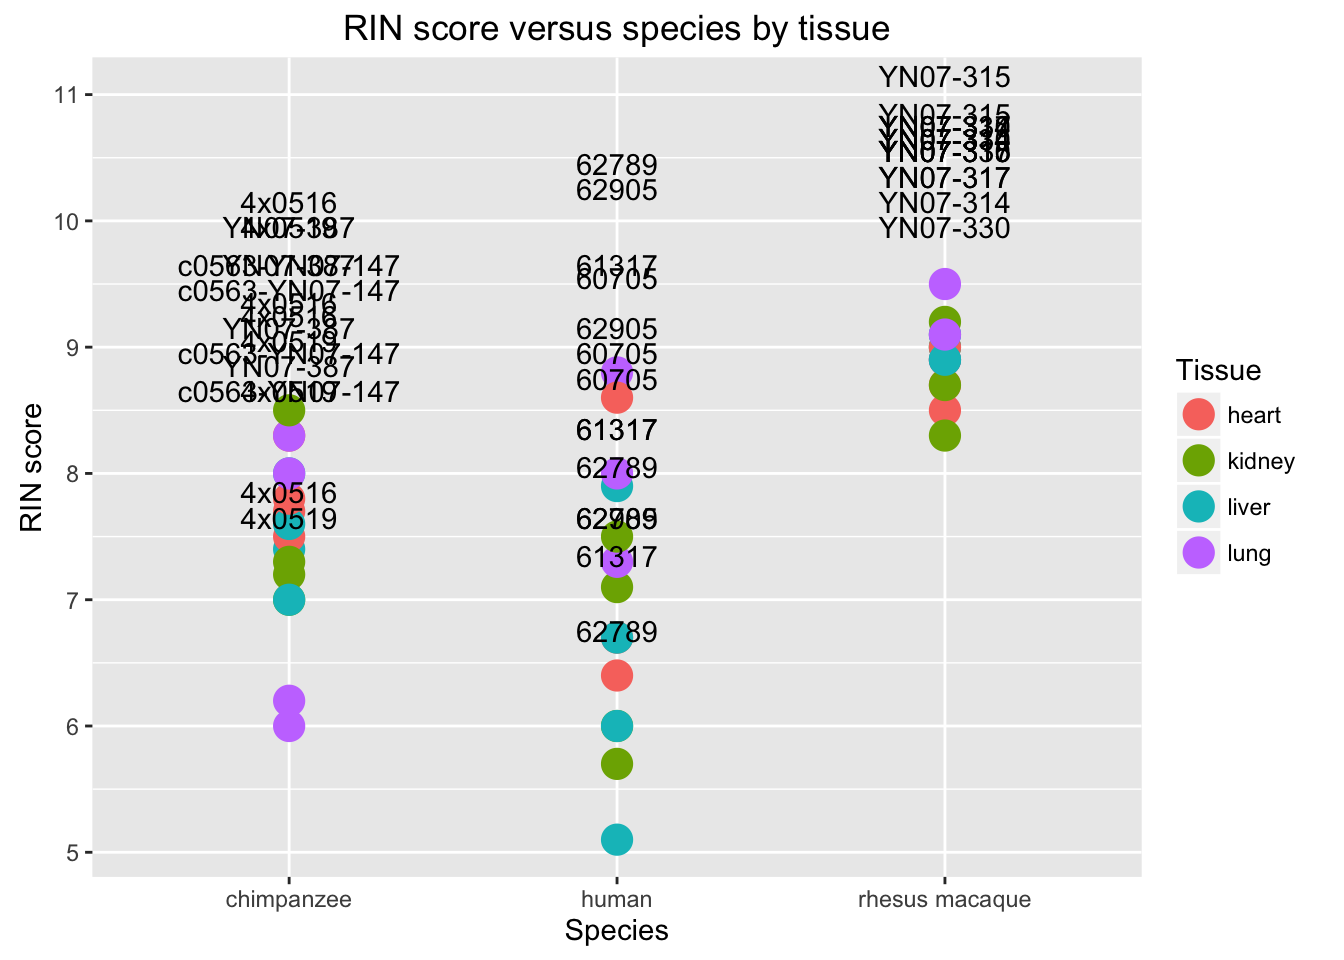
# Boxplot RIN score by tissue

new_plot <- ggplot(data = RNA_seq_info, aes(y = RIN.score, x = Tissue)) + geom_boxplot() + geom_point(aes(color = Species), size = 5,  position=position_jitter(width=0.2, height=0.1))
new_plot + labs(title = "RIN score versus tissue by species", y = "RIN score", x = "Tissue")
## Warning: Removed 1 rows containing non-finite values (stat_boxplot).## Warning: Removed 1 rows containing missing values (geom_point).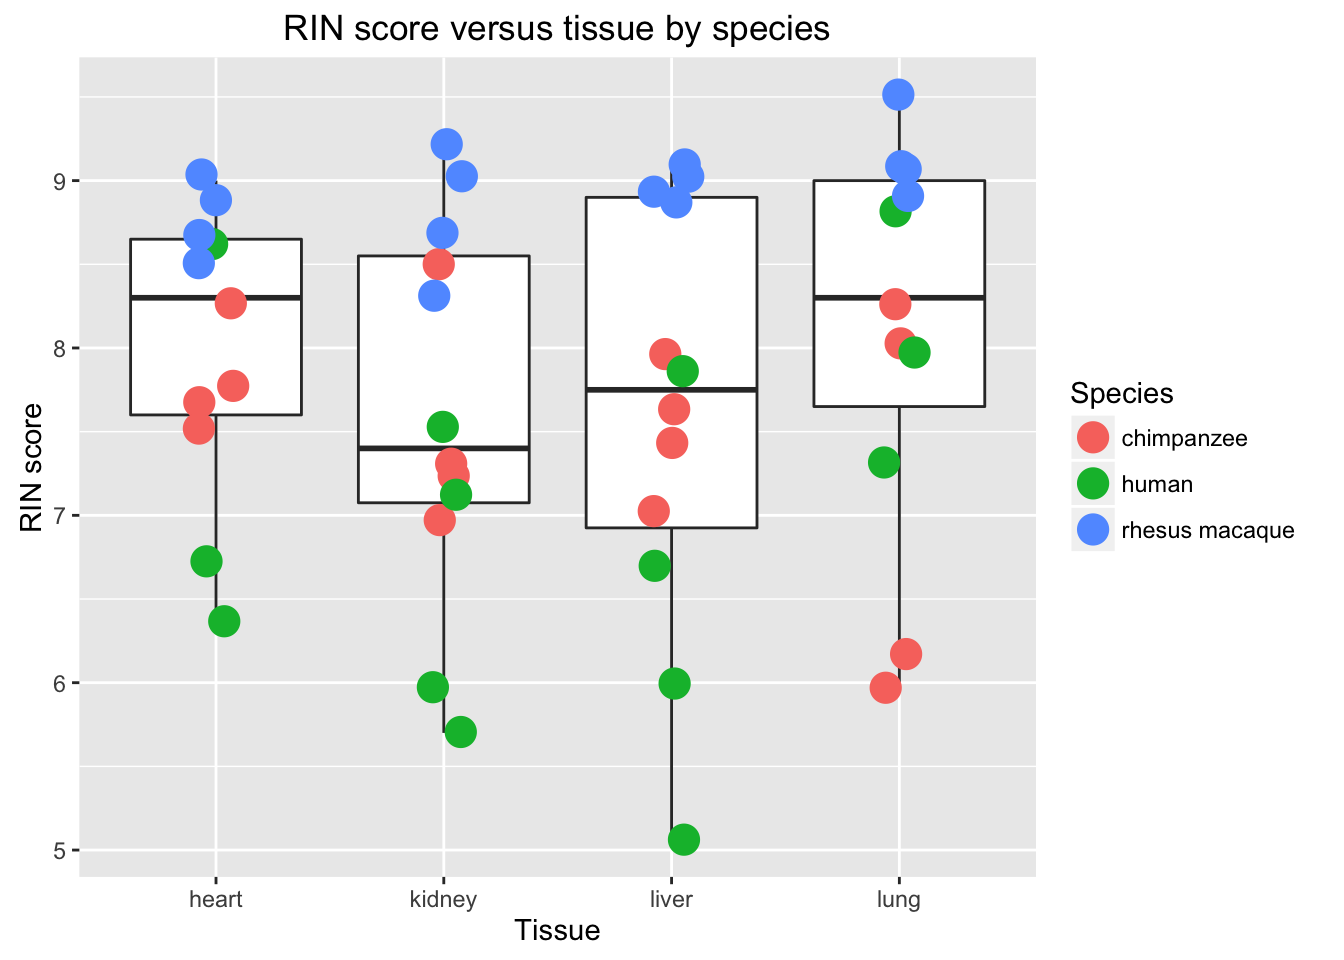
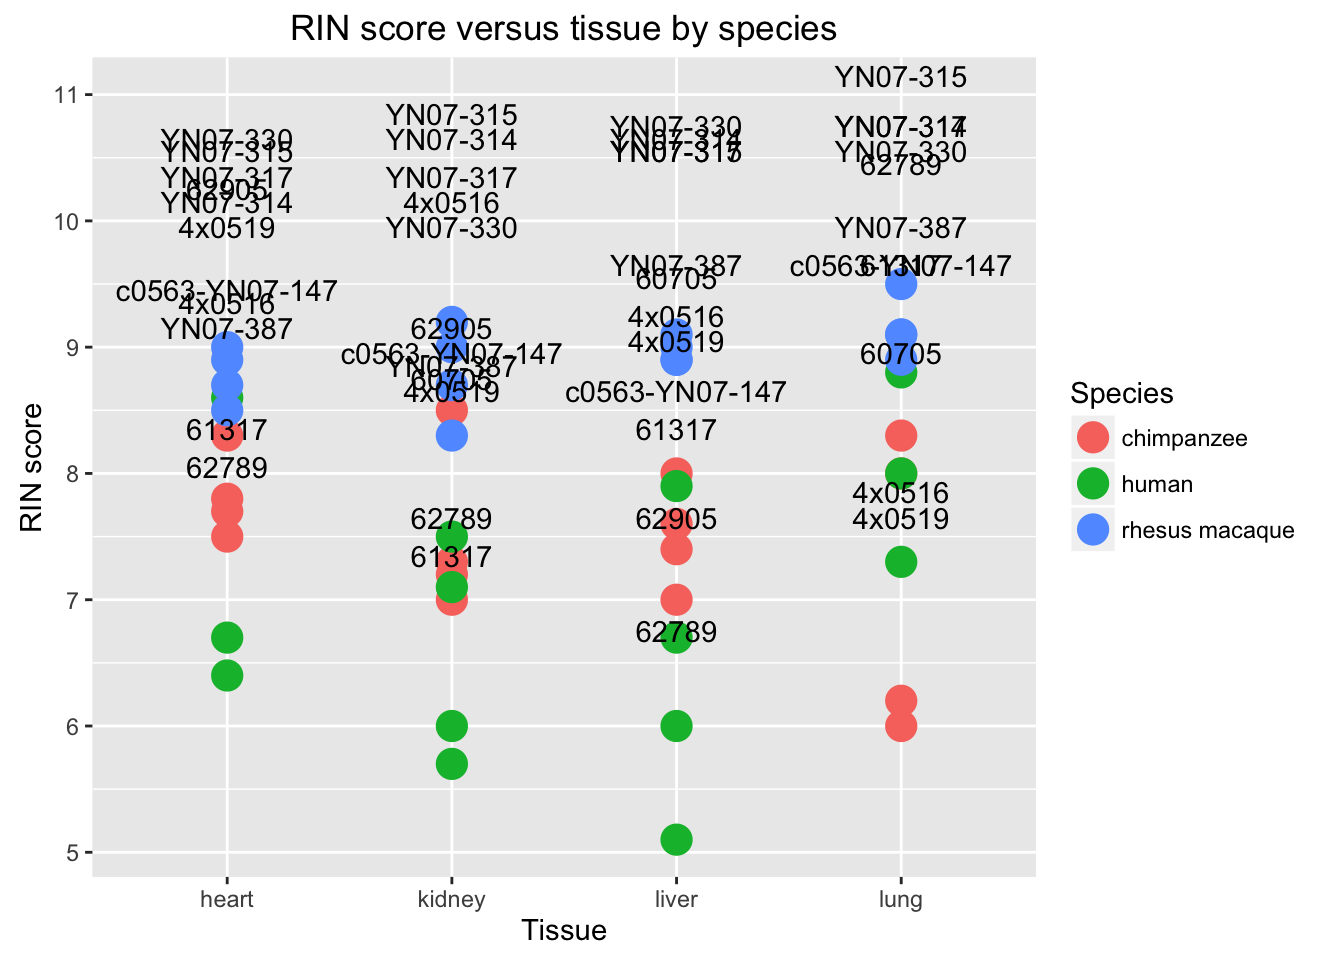
# RIN score by species with individual name

new_plot <- ggplot(data = RNA_seq_info, aes(y = RIN.score, x = Tissue, label = RNA_seq_info$Individual)) + geom_point(aes(color = Species), size = 5)
new_plot + geom_text(vjust = -0.4, nudge_y = 1.5) + labs(title = "RIN score versus tissue by species", y = "RIN score", x = "Tissue")
## Warning: Removed 1 rows containing missing values (geom_point).## Warning: Removed 1 rows containing missing values (geom_text).