getwd()
## [1] "/Users/laurenblake/Desktop/Regulatory_Evol/ashlar-trial/analysis"
# import sample labels
samples <- read.delim("../../../Reg_Evo_Primates/data/Sample_info_RNAseq_RIN.txt")
RIN <- samples$RIN
# expression
exprs <- read.table("../../../Reg_Evo_Primates/data/human_chimp_orth_exp_methyl_7725_hum.txt", sep="")
# methylation data
methyl <- read.csv("../../../Reg_Evo_Primates/data/chimp_human_orth_7725_avg_methyl_per_ts_gene.txt", sep="")

# Normalized gene expression data
cpm.voom.cyclic <- readRDS("../../../Reg_Evo_Primates/data/human_chimp_orth_cpm_voom_cyclic.rds")


# Load libraries
library("edgeR")
## Loading required package: limma
library("limma")
library("plyr")
library("ashr")
library("cowplot")
## Warning: package 'cowplot' was built under R version 3.4.4
## Loading required package: ggplot2
## Warning: package 'ggplot2' was built under R version 3.4.4
##
## Attaching package: 'cowplot'
## The following object is masked from 'package:ggplot2':
##
##     ggsave
library("vashr")
## Loading required package: SQUAREM
## Loading required package: qvalue
library("devtools")
## Warning: package 'devtools' was built under R version 3.4.4
#devtools::install_github("jhsiao999/mediation/pkg")
library("medinome")
Set FDR level/svalue
FDR_level <- 0.05
FDR_add <- 0.10
Human heart-kidney
# Check parameters

human_chimp_heart <- c(17, 20, 21, 24, 25, 28, 29)

# Methylation
hc_exprs <- exprs[,2:48]
exprs_methyl <- exprs[,49:79]

# HC heart only


hc_exprs_heart <- hc_exprs[,human_chimp_heart]


methyl <- exprs_methyl[,human_chimp_heart]
rownames(hc_exprs_heart) <- rownames(exprs)
rownames(methyl) <- rownames(exprs)


Y <- hc_exprs_heart
two_species <- samples$Tissue[human_chimp_heart]
X <- droplevels.factor(two_species)
M <- methyl
RIN_subset <- RIN[human_chimp_heart]
Human heart versus kidney- DE genes
# Run the linear model in limma
  design_1 <- model.matrix(~ X + RIN_subset)
  fit_all <- lmFit(cpm.voom.cyclic[,human_chimp_heart], design_1)
  fit_all <- eBayes(fit_all)

# Get results
  HvC_Heart_fit_all = topTable(fit_all, coef=2, adjust="BH", number=Inf, sort.by="none")
  HvC_Heart_fit_all_5perc <-
HvC_Heart_fit_all[which(HvC_Heart_fit_all$adj.P.Val < FDR_level), ]

 human_chimp_heart1 <-  rownames(methyl) %in% rownames( HvC_Heart_fit_all_5perc)
human_chimp_heart1 <- as.data.frame(human_chimp_heart1)
counts_genes_in <- cbind(methyl, human_chimp_heart1)
counts_genes_in_cutoff <- subset(counts_genes_in, human_chimp_heart1 == "TRUE")
counts_human_chimp_heart_subset <- counts_genes_in_cutoff[,1:7]
M <- counts_human_chimp_heart_subset

human_chimp_heart1 <-  rownames(hc_exprs_heart) %in% rownames( HvC_Heart_fit_all_5perc)
human_chimp_heart1 <- as.data.frame(human_chimp_heart1)
counts_genes_in <- cbind(hc_exprs_heart, human_chimp_heart1)
counts_genes_in_cutoff <- subset(counts_genes_in, human_chimp_heart1 == "TRUE")
counts_human_chimp_heart_subset <- counts_genes_in_cutoff[,1:7]
Y <- counts_human_chimp_heart_subset
Human heart versus kidney- conserved DE genes
# Species no DE
species_no_DE <- c(1, 2, 5, 6, 9, 10, 13, 14)

species_no_DE_exprs <- hc_exprs[,species_no_DE]

species_no_DE_methyl <- exprs_methyl[,species_no_DE]

two_species <- samples$Tissue[species_no_DE]
no_DE_tissue <- droplevels.factor(two_species)

no_DE_RIN <- RIN[species_no_DE]

design <- model.matrix(~ as.factor(no_DE_tissue) + no_DE_RIN)
  fit_species_no_DE <- lmFit(cpm.voom.cyclic[,species_no_DE], design)
  fit_species_no_DE <- eBayes(fit_species_no_DE)

  HvC_Heart_fit_species_no_DE = topTable(fit_species_no_DE, coef=2, adjust="BH", number=Inf,
sort.by="none")

# Species DE
  design_1 <- model.matrix(~ X + RIN_subset)
  fit_all <- lmFit(cpm.voom.cyclic[,human_chimp_heart], design_1)
  fit_all <- eBayes(fit_all)

# Get results
  HvC_Heart_fit_all = topTable(fit_all, coef=2, adjust="BH", number=Inf, sort.by="none")

  HvC_Heart_fit_species_no_DE = cbind(HvC_Heart_fit_species_no_DE, HvC_Heart_fit_all)


      HvC_Heart_fit_all_5perc <- HvC_Heart_fit_species_no_DE[which(HvC_Heart_fit_species_no_DE[,6] <  FDR_level & HvC_Heart_fit_species_no_DE[,13] < FDR_level), ]


   human_chimp_heart1 <-  rownames(methyl) %in% rownames( HvC_Heart_fit_all_5perc)
human_chimp_heart1 <- as.data.frame(human_chimp_heart1)
counts_genes_in <- cbind(methyl, human_chimp_heart1)
counts_genes_in_cutoff <- subset(counts_genes_in, human_chimp_heart1 == "TRUE")
counts_human_chimp_heart_subset <- counts_genes_in_cutoff[,1:7]
M <- counts_human_chimp_heart_subset

human_chimp_heart1 <-  rownames(hc_exprs_heart) %in% rownames( HvC_Heart_fit_all_5perc)
human_chimp_heart1 <- as.data.frame(human_chimp_heart1)
counts_genes_in <- cbind(hc_exprs_heart, human_chimp_heart1)
counts_genes_in_cutoff <- subset(counts_genes_in, human_chimp_heart1 == "TRUE")
counts_human_chimp_heart_subset <- counts_genes_in_cutoff[,1:7]
Y <- counts_human_chimp_heart_subset

# Save

cons_DE_heart_kidney_exp <- Y
cons_DE_heart_kidney_meth <- M

# Find the correlation

corr_cons_DE_HK <- array("NA", dim=c(nrow(Y),1))

for (i in 1:nrow(Y)){
  corr_cons_DE_HK[i,] <- cor(t(cons_DE_heart_kidney_exp[i,]), t(cons_DE_heart_kidney_meth[i,]))
}

corr_cons_DE_HK <- as.numeric(corr_cons_DE_HK)
summary(corr_cons_DE_HK)
##    Min. 1st Qu.  Median    Mean 3rd Qu.    Max.
## -0.9927 -0.5724 -0.1875 -0.1631  0.2275  0.9702
Non conserved
# Species no DE
species_no_DE <- c(1, 2, 5, 6, 9, 10, 13, 14)

species_no_DE_exprs <- hc_exprs[,species_no_DE]

species_no_DE_methyl <- exprs_methyl[,species_no_DE]

two_species <- samples$Tissue[species_no_DE]
no_DE_tissue <- droplevels.factor(two_species)

no_DE_RIN <- RIN[species_no_DE]

design <- model.matrix(~ as.factor(no_DE_tissue) + no_DE_RIN)
  fit_species_no_DE <- lmFit(cpm.voom.cyclic[,species_no_DE], design)
  fit_species_no_DE <- eBayes(fit_species_no_DE)

  HvC_Heart_fit_species_no_DE = topTable(fit_species_no_DE, coef=2, adjust="BH", number=Inf,
sort.by="none")

# Species DE
  design_1 <- model.matrix(~ X + RIN_subset)
  fit_all <- lmFit(cpm.voom.cyclic[,human_chimp_heart], design_1)
  fit_all <- eBayes(fit_all)

# Get results
  HvC_Heart_fit_all = topTable(fit_all, coef=2, adjust="BH", number=Inf, sort.by="none")

  HvC_Heart_fit_species_no_DE = cbind(HvC_Heart_fit_species_no_DE, HvC_Heart_fit_all)


      HvC_Heart_fit_all_5perc <- HvC_Heart_fit_species_no_DE[which(HvC_Heart_fit_species_no_DE[,6] >  FDR_level & HvC_Heart_fit_species_no_DE[,13] < FDR_level), ]


   human_chimp_heart1 <-  rownames(methyl) %in% rownames( HvC_Heart_fit_all_5perc)
human_chimp_heart1 <- as.data.frame(human_chimp_heart1)
counts_genes_in <- cbind(methyl, human_chimp_heart1)
counts_genes_in_cutoff <- subset(counts_genes_in, human_chimp_heart1 == "TRUE")
counts_human_chimp_heart_subset <- counts_genes_in_cutoff[,1:7]
M <- counts_human_chimp_heart_subset

human_chimp_heart1 <-  rownames(hc_exprs_heart) %in% rownames( HvC_Heart_fit_all_5perc)
human_chimp_heart1 <- as.data.frame(human_chimp_heart1)
counts_genes_in <- cbind(hc_exprs_heart, human_chimp_heart1)
counts_genes_in_cutoff <- subset(counts_genes_in, human_chimp_heart1 == "TRUE")
counts_human_chimp_heart_subset <- counts_genes_in_cutoff[,1:7]
Y <- counts_human_chimp_heart_subset


non_cons_DE_heart_kidney_exp <- Y
non_cons_DE_heart_kidney_meth <- M

# Find the correlation

corr_non_cons_DE_HK <- array("NA", dim=c(nrow(Y),1))

for (i in 1:nrow(Y)){
  corr_non_cons_DE_HK[i,] <- cor(t(non_cons_DE_heart_kidney_exp[i,]), t(non_cons_DE_heart_kidney_meth[i,]))
}

corr_non_cons_DE_HK <- as.numeric(corr_non_cons_DE_HK)
summary(corr_non_cons_DE_HK)
##     Min.  1st Qu.   Median     Mean  3rd Qu.     Max.
## -0.96377 -0.42337 -0.06886 -0.04466  0.38677  0.93749
Human heart versus kidney- non DE genes
# Run the linear model in limma
  design_1 <- model.matrix(~ X + RIN_subset)
  fit_all <- lmFit(cpm.voom.cyclic[,human_chimp_heart], design_1)
  fit_all <- eBayes(fit_all)

# Get results
  HvC_Heart_fit_all = topTable(fit_all, coef=2, adjust="BH", number=Inf, sort.by="none")
  HvC_Heart_fit_all_5perc <-
HvC_Heart_fit_all[which(HvC_Heart_fit_all$adj.P.Val > FDR_level), ]

 human_chimp_heart1 <-  rownames(methyl) %in% rownames( HvC_Heart_fit_all_5perc)
human_chimp_heart1 <- as.data.frame(human_chimp_heart1)
counts_genes_in <- cbind(methyl, human_chimp_heart1)
counts_genes_in_cutoff <- subset(counts_genes_in, human_chimp_heart1 == "TRUE")
counts_human_chimp_heart_subset <- counts_genes_in_cutoff[,1:7]
M <- counts_human_chimp_heart_subset

human_chimp_heart1 <-  rownames(hc_exprs_heart) %in% rownames( HvC_Heart_fit_all_5perc)
human_chimp_heart1 <- as.data.frame(human_chimp_heart1)
counts_genes_in <- cbind(hc_exprs_heart, human_chimp_heart1)
counts_genes_in_cutoff <- subset(counts_genes_in, human_chimp_heart1 == "TRUE")
counts_human_chimp_heart_subset <- counts_genes_in_cutoff[,1:7]
Y <- counts_human_chimp_heart_subset

non_DE_heart_kidney_exp <- Y
non_DE_heart_kidney_meth <- M

# Find the correlation

corr_non_DE_HK <- array("NA", dim=c(nrow(Y),1))

for (i in 1:nrow(Y)){
  corr_non_DE_HK[i,] <- cor(t(non_DE_heart_kidney_exp[i,]), t(non_DE_heart_kidney_meth[i,]))
}

corr_non_DE_HK <- as.numeric(corr_non_DE_HK)
summary(corr_non_DE_HK)
##     Min.  1st Qu.   Median     Mean  3rd Qu.     Max.
## -0.96869 -0.34937 -0.02627 -0.02398  0.30455  0.96692
Attempt to make this into a figure
length(corr_cons_DE_HK)
## [1] 1163
length(corr_non_cons_DE_HK)
## [1] 302
length(corr_non_DE_HK)
## [1] 6260
corr_cons_DE_HK <- as.data.frame(corr_cons_DE_HK)
cons_label <- array("Conserved DE", dim=c(nrow(corr_cons_DE_HK),1))
corr_cons_DE_HK_full <- as.data.frame(cbind(corr_cons_DE_HK, cons_label))
colnames(corr_cons_DE_HK_full) <- c("Pearson's correlation", "DE status")
corr_non_cons_DE_HK <- as.data.frame(corr_non_cons_DE_HK)
non_cons_label <- array("Human only DE", dim=c(nrow(corr_non_cons_DE_HK),1))
corr_non_cons_DE_HK_full <- as.data.frame(cbind(corr_non_cons_DE_HK, non_cons_label))
colnames(corr_non_cons_DE_HK_full) <- c("Pearson's correlation", "DE status")
corr_non_DE_HK <- as.data.frame(corr_non_DE_HK)
non_de_label <- array("Human non-DE", dim=c(nrow(corr_non_DE_HK),1))
corr_non_DE_HK_full <- as.data.frame(cbind(corr_non_DE_HK, non_de_label))
colnames(corr_non_DE_HK_full) <- c("Pearson's correlation", "DE status")
# Make correlation
human_HK <- rbind(corr_cons_DE_HK_full, corr_non_cons_DE_HK_full, corr_non_DE_HK_full)
# Make mean
mean_cons <- mean(t(corr_cons_DE_HK))
mean_cons_label <- array("Conserved DE", dim=c(1,1))
mean_cons_full <- cbind(mean_cons, mean_cons_label)
colnames(mean_cons_full) <- c("Mean", "DE status")
mean_non_cons <- mean(t(corr_non_cons_DE_HK))
mean_non_cons_label <- array("Human only DE", dim=c(1,1))
mean_non_cons_full <- cbind(mean_non_cons, mean_non_cons_label)
colnames(mean_non_cons_full) <- c("Mean", "DE status")
mean_non_de <- mean(t(corr_non_DE_HK))
mean_non_de_label <- array("Human non-DE", dim=c(1,1))
mean_non_de_full <- cbind(mean_non_de, mean_non_de_label)
colnames(mean_non_de_full) <- c("Mean", "DE status")
all_mean <- as.data.frame(rbind(mean_cons_full, mean_non_cons_full, mean_non_de_full), stringsAsFactors = FALSE)
all_mean[,1] <- as.numeric(all_mean[,1])
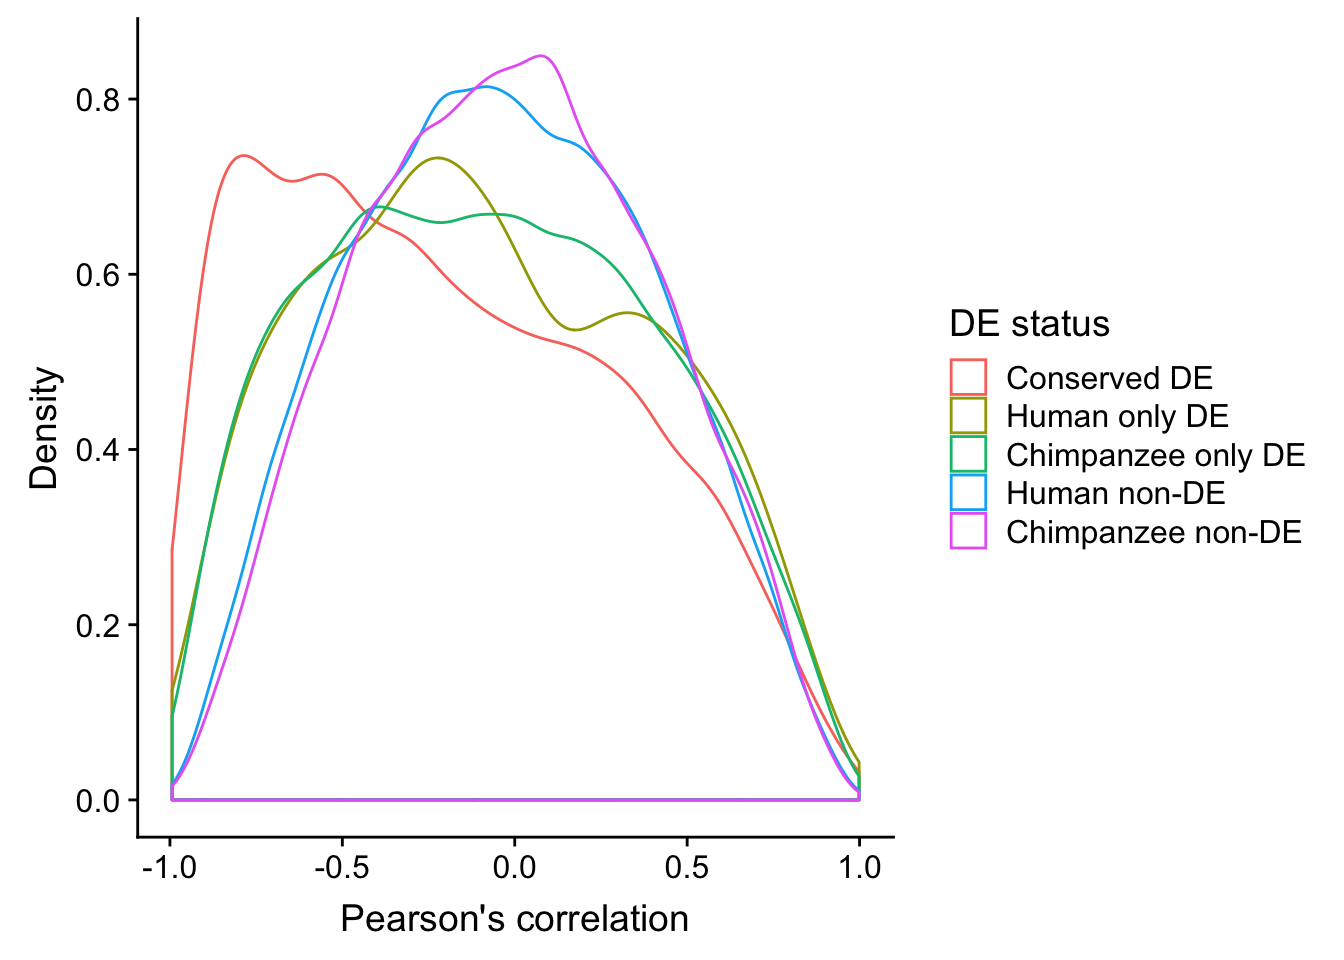
# Plot without mean
ggplot(human_HK, aes(x=`Pearson's correlation`, color=`DE status`)) +
geom_density() + ylab("Density")
# Plot with mean
#ggplot(human_HK, aes(x=`Pearson's correlation`, color=`DE status`)) +
#  geom_density() +  geom_vline(data=all_mean, aes(xintercept=Mean, # color=`DE status`), linetype="dashed")
Generalize conserved DE to a function
cons_de_corr <- function(human_chimp_heart, species_no_DE){

human_chimp_heart <- human_chimp_heart


# Methylation
hc_exprs <- exprs[,2:48]
exprs_methyl <- exprs[,49:79]

# HC heart only


hc_exprs_heart <- hc_exprs[,human_chimp_heart]


methyl <- exprs_methyl[,human_chimp_heart]
rownames(hc_exprs_heart) <- rownames(exprs)
rownames(methyl) <- rownames(exprs)


Y <- hc_exprs_heart
two_species <- samples$Tissue[human_chimp_heart]
X <- droplevels.factor(two_species)
M <- methyl
RIN_subset <- RIN[human_chimp_heart]

## Human heart versus kidney- DE genes


# Run the linear model in limma
  design_1 <- model.matrix(~ X + RIN_subset)
  fit_all <- lmFit(cpm.voom.cyclic[,human_chimp_heart], design_1)
  fit_all <- eBayes(fit_all)

# Get results
  HvC_Heart_fit_all = topTable(fit_all, coef=2, adjust="BH", number=Inf, sort.by="none")
  HvC_Heart_fit_all_5perc <-
HvC_Heart_fit_all[which(HvC_Heart_fit_all$adj.P.Val < FDR_level), ]

 human_chimp_heart1 <-  rownames(methyl) %in% rownames( HvC_Heart_fit_all_5perc)
human_chimp_heart1 <- as.data.frame(human_chimp_heart1)
counts_genes_in <- cbind(methyl, human_chimp_heart1)
counts_genes_in_cutoff <- subset(counts_genes_in, human_chimp_heart1 == "TRUE")
counts_human_chimp_heart_subset <- counts_genes_in_cutoff[,1:7]
M <- counts_human_chimp_heart_subset

human_chimp_heart1 <-  rownames(hc_exprs_heart) %in% rownames( HvC_Heart_fit_all_5perc)
human_chimp_heart1 <- as.data.frame(human_chimp_heart1)
counts_genes_in <- cbind(hc_exprs_heart, human_chimp_heart1)
counts_genes_in_cutoff <- subset(counts_genes_in, human_chimp_heart1 == "TRUE")
counts_human_chimp_heart_subset <- counts_genes_in_cutoff[,1:7]
Y <- counts_human_chimp_heart_subset


## Human heart versus kidney- conserved DE genes


# Species no DE
species_no_DE <- species_no_DE

species_no_DE_exprs <- hc_exprs[,species_no_DE]

species_no_DE_methyl <- exprs_methyl[,species_no_DE]

two_species <- samples$Tissue[species_no_DE]
no_DE_tissue <- droplevels.factor(two_species)

no_DE_RIN <- RIN[species_no_DE]

design <- model.matrix(~ as.factor(no_DE_tissue) + no_DE_RIN)
  fit_species_no_DE <- lmFit(cpm.voom.cyclic[,species_no_DE], design)
  fit_species_no_DE <- eBayes(fit_species_no_DE)

  HvC_Heart_fit_species_no_DE = topTable(fit_species_no_DE, coef=2, adjust="BH", number=Inf,
sort.by="none")

# Species DE
  design_1 <- model.matrix(~ X + RIN_subset)
  fit_all <- lmFit(cpm.voom.cyclic[,human_chimp_heart], design_1)
  fit_all <- eBayes(fit_all)

# Get results
  HvC_Heart_fit_all = topTable(fit_all, coef=2, adjust="BH", number=Inf, sort.by="none")

  HvC_Heart_fit_species_no_DE = cbind(HvC_Heart_fit_species_no_DE, HvC_Heart_fit_all)


      HvC_Heart_fit_all_5perc <- HvC_Heart_fit_species_no_DE[which(HvC_Heart_fit_species_no_DE[,6] <  FDR_level & HvC_Heart_fit_species_no_DE[,13] < FDR_level), ]


   human_chimp_heart1 <-  rownames(methyl) %in% rownames( HvC_Heart_fit_all_5perc)
human_chimp_heart1 <- as.data.frame(human_chimp_heart1)
counts_genes_in <- cbind(methyl, human_chimp_heart1)
counts_genes_in_cutoff <- subset(counts_genes_in, human_chimp_heart1 == "TRUE")
counts_human_chimp_heart_subset <- counts_genes_in_cutoff[,1:7]
M <- counts_human_chimp_heart_subset

human_chimp_heart1 <-  rownames(hc_exprs_heart) %in% rownames( HvC_Heart_fit_all_5perc)
human_chimp_heart1 <- as.data.frame(human_chimp_heart1)
counts_genes_in <- cbind(hc_exprs_heart, human_chimp_heart1)
counts_genes_in_cutoff <- subset(counts_genes_in, human_chimp_heart1 == "TRUE")
counts_human_chimp_heart_subset <- counts_genes_in_cutoff[,1:7]
Y <- counts_human_chimp_heart_subset

# Save

cons_DE_heart_kidney_exp <- Y
cons_DE_heart_kidney_meth <- M

# Find the correlation

corr_cons_DE_HK <- array("NA", dim=c(nrow(Y),1))

for (i in 1:nrow(Y)){
  corr_cons_DE_HK[i,] <- cor(t(cons_DE_heart_kidney_exp[i,]), t(cons_DE_heart_kidney_meth[i,]))
}

corr_cons_DE_HK <- as.numeric(corr_cons_DE_HK)

return(corr_cons_DE_HK)
}

# Heart kidney
hc_heart_kidney <- as.data.frame(cons_de_corr(c(17, 20, 21, 24, 25, 28, 29),c(1, 2, 5, 6, 9, 10, 13, 14)))

colnames(hc_heart_kidney) <- c("Pearson's correlation")

summary(corr_cons_DE_HK)
##  corr_cons_DE_HK
##  Min.   :-0.9927
##  1st Qu.:-0.5724
##  Median :-0.1875
##  Mean   :-0.1631
##  3rd Qu.: 0.2275
##  Max.   : 0.9702
summary(hc_heart_kidney)
##  Pearson's correlation
##  Min.   :-0.9927
##  1st Qu.:-0.5724
##  Median :-0.1875
##  Mean   :-0.1631
##  3rd Qu.: 0.2275
##  Max.   : 0.9702
# Heart liver
hc_heart_liver <-  as.data.frame(cons_de_corr(c(18, 20, 22, 24, 26, 28, 30),c(1, 3, 5, 7, 9, 11, 13, 15)))
colnames(hc_heart_liver) <- c("Pearson's correlation")

summary(hc_heart_liver)
##  Pearson's correlation
##  Min.   :-0.9860
##  1st Qu.:-0.6968
##  Median :-0.3432
##  Mean   :-0.2464
##  3rd Qu.: 0.1677
##  Max.   : 0.9871
# Heart lung
hc_heart_lung <-  as.data.frame(cons_de_corr(c(19, 20, 23, 24, 27, 28, 31),c(1, 4, 5, 8, 9, 12, 13, 16)))
colnames(hc_heart_lung) <- c("Pearson's correlation")

summary(hc_heart_lung)
##  Pearson's correlation
##  Min.   :-0.9894
##  1st Qu.:-0.5537
##  Median :-0.1492
##  Mean   :-0.1388
##  3rd Qu.: 0.2393
##  Max.   : 0.9484
# Kidney liver
hc_kidney_liver <-  as.data.frame(cons_de_corr(c(17, 18, 21, 22, 25, 26, 29, 30),c(2, 3, 6, 7, 10, 11,  14,15)))
colnames(hc_kidney_liver) <- c("Pearson's correlation")

summary(hc_kidney_liver)
##  Pearson's correlation
##  Min.   :-0.9907
##  1st Qu.:-0.6082
##  Median :-0.2840
##  Mean   :-0.2066
##  3rd Qu.: 0.1882
##  Max.   : 0.9711
# Kidney lung
hc_kidney_lung <-  as.data.frame(cons_de_corr(c(17, 19, 21, 23, 25, 27, 29, 31),c(2, 4, 6, 8, 10, 12,  14,16)))
colnames(hc_kidney_lung) <- c("Pearson's correlation")

summary(hc_kidney_lung)
##  Pearson's correlation
##  Min.   :-0.9938
##  1st Qu.:-0.6353
##  Median :-0.2690
##  Mean   :-0.2256
##  3rd Qu.: 0.1354
##  Max.   : 0.9574
# Liver lung
hc_liver_lung <-  as.data.frame(cons_de_corr(c(18, 19, 22, 23, 26, 27, 30, 31),c(3, 4, 7, 8, 11, 12,  15,16)))
colnames(hc_liver_lung) <- c("Pearson's correlation")

summary(hc_liver_lung)
##  Pearson's correlation
##  Min.   :-0.9890
##  1st Qu.:-0.6679
##  Median :-0.3251
##  Mean   :-0.2415
##  3rd Qu.: 0.1578
##  Max.   : 0.9461
hc_cons_de <- rbind(hc_heart_kidney, hc_heart_liver, hc_heart_lung, hc_kidney_liver, hc_kidney_lung, hc_liver_lung)

dim(hc_cons_de)
## [1] 6836 1
#hist(hc_cons_de)

write.table(hc_cons_de, "/Users/laurenblake/Desktop/Regulatory_Evol/ashlar-trial/data/Corr_human_chimp_DE/corr_hc_de.txt")
Generalize species only DE to a function
non_cons_de_corr <- function(human_chimp_heart, species_no_DE){

human_chimp_heart <- human_chimp_heart


# Methylation
hc_exprs <- exprs[,2:48]
exprs_methyl <- exprs[,49:79]

# HC heart only


hc_exprs_heart <- hc_exprs[,human_chimp_heart]


methyl <- exprs_methyl[,human_chimp_heart]
rownames(hc_exprs_heart) <- rownames(exprs)
rownames(methyl) <- rownames(exprs)


Y <- hc_exprs_heart
two_species <- samples$Tissue[human_chimp_heart]
X <- droplevels.factor(two_species)
M <- methyl
RIN_subset <- RIN[human_chimp_heart]

## Human heart versus kidney- DE genes


# Run the linear model in limma
  design_1 <- model.matrix(~ X + RIN_subset)
  fit_all <- lmFit(cpm.voom.cyclic[,human_chimp_heart], design_1)
  fit_all <- eBayes(fit_all)

# Get results
  HvC_Heart_fit_all = topTable(fit_all, coef=2, adjust="BH", number=Inf, sort.by="none")
  HvC_Heart_fit_all_5perc <-
HvC_Heart_fit_all[which(HvC_Heart_fit_all$adj.P.Val < FDR_level), ]

 human_chimp_heart1 <-  rownames(methyl) %in% rownames( HvC_Heart_fit_all_5perc)
human_chimp_heart1 <- as.data.frame(human_chimp_heart1)
counts_genes_in <- cbind(methyl, human_chimp_heart1)
counts_genes_in_cutoff <- subset(counts_genes_in, human_chimp_heart1 == "TRUE")
counts_human_chimp_heart_subset <- counts_genes_in_cutoff[,1:7]
M <- counts_human_chimp_heart_subset

human_chimp_heart1 <-  rownames(hc_exprs_heart) %in% rownames( HvC_Heart_fit_all_5perc)
human_chimp_heart1 <- as.data.frame(human_chimp_heart1)
counts_genes_in <- cbind(hc_exprs_heart, human_chimp_heart1)
counts_genes_in_cutoff <- subset(counts_genes_in, human_chimp_heart1 == "TRUE")
counts_human_chimp_heart_subset <- counts_genes_in_cutoff[,1:7]
Y <- counts_human_chimp_heart_subset


## Human heart versus kidney- conserved DE genes


# Species no DE
species_no_DE <- species_no_DE

species_no_DE_exprs <- hc_exprs[,species_no_DE]

species_no_DE_methyl <- exprs_methyl[,species_no_DE]

two_species <- samples$Tissue[species_no_DE]
no_DE_tissue <- droplevels.factor(two_species)

no_DE_RIN <- RIN[species_no_DE]

design <- model.matrix(~ as.factor(no_DE_tissue) + no_DE_RIN)
  fit_species_no_DE <- lmFit(cpm.voom.cyclic[,species_no_DE], design)
  fit_species_no_DE <- eBayes(fit_species_no_DE)

  HvC_Heart_fit_species_no_DE = topTable(fit_species_no_DE, coef=2, adjust="BH", number=Inf,
sort.by="none")

# Species DE
  design_1 <- model.matrix(~ X + RIN_subset)
  fit_all <- lmFit(cpm.voom.cyclic[,human_chimp_heart], design_1)
  fit_all <- eBayes(fit_all)

# Get results
  HvC_Heart_fit_all = topTable(fit_all, coef=2, adjust="BH", number=Inf, sort.by="none")

  HvC_Heart_fit_species_no_DE = cbind(HvC_Heart_fit_species_no_DE, HvC_Heart_fit_all)


      HvC_Heart_fit_all_5perc <- HvC_Heart_fit_species_no_DE[which(HvC_Heart_fit_species_no_DE[,6] >  FDR_level & HvC_Heart_fit_species_no_DE[,13] < FDR_level), ]


   human_chimp_heart1 <-  rownames(methyl) %in% rownames( HvC_Heart_fit_all_5perc)
human_chimp_heart1 <- as.data.frame(human_chimp_heart1)
counts_genes_in <- cbind(methyl, human_chimp_heart1)
counts_genes_in_cutoff <- subset(counts_genes_in, human_chimp_heart1 == "TRUE")
counts_human_chimp_heart_subset <- counts_genes_in_cutoff[,1:7]
M <- counts_human_chimp_heart_subset

human_chimp_heart1 <-  rownames(hc_exprs_heart) %in% rownames( HvC_Heart_fit_all_5perc)
human_chimp_heart1 <- as.data.frame(human_chimp_heart1)
counts_genes_in <- cbind(hc_exprs_heart, human_chimp_heart1)
counts_genes_in_cutoff <- subset(counts_genes_in, human_chimp_heart1 == "TRUE")
counts_human_chimp_heart_subset <- counts_genes_in_cutoff[,1:7]
Y <- counts_human_chimp_heart_subset

# Save

cons_DE_heart_kidney_exp <- Y
cons_DE_heart_kidney_meth <- M

# Find the correlation

corr_cons_DE_HK <- array("NA", dim=c(nrow(Y),1))

for (i in 1:nrow(Y)){
  corr_cons_DE_HK[i,] <- cor(t(cons_DE_heart_kidney_exp[i,]), t(cons_DE_heart_kidney_meth[i,]))
}

corr_cons_DE_HK <- as.numeric(corr_cons_DE_HK)

return(corr_cons_DE_HK)
}

# Heart kidney
hc_heart_kidney <- as.data.frame(non_cons_de_corr(c(17, 20, 21, 24, 25, 28, 29),c(1, 2, 5, 6, 9, 10, 13, 14)))

colnames(hc_heart_kidney) <- c("Pearson's correlation")

summary(corr_non_cons_DE_HK)
##  corr_non_cons_DE_HK
##  Min.   :-0.96377
##  1st Qu.:-0.42337
##  Median :-0.06886
##  Mean   :-0.04466
##  3rd Qu.: 0.38677
##  Max.   : 0.93749
summary(hc_heart_kidney)
##  Pearson's correlation
##  Min.   :-0.96377
##  1st Qu.:-0.42337
##  Median :-0.06886
##  Mean   :-0.04466
##  3rd Qu.: 0.38677
##  Max.   : 0.93749
# Heart liver
hc_heart_liver <-  as.data.frame(non_cons_de_corr(c(18, 20, 22, 24, 26, 28, 30),c(1, 3, 5, 7, 9, 11, 13, 15)))
colnames(hc_heart_liver) <- c("Pearson's correlation")

summary(hc_heart_liver)
##  Pearson's correlation
##  Min.   :-0.9222
##  1st Qu.:-0.5463
##  Median :-0.1491
##  Mean   :-0.1290
##  3rd Qu.: 0.3049
##  Max.   : 0.8959
# Heart lung
hc_heart_lung <-  as.data.frame(non_cons_de_corr(c(19, 20, 23, 24, 27, 28, 31),c(1, 4, 5, 8, 9, 12, 13, 16)))
colnames(hc_heart_lung) <- c("Pearson's correlation")

summary(hc_heart_lung)
##  Pearson's correlation
##  Min.   :-0.96738
##  1st Qu.:-0.39398
##  Median :-0.06681
##  Mean   :-0.04157
##  3rd Qu.: 0.32511
##  Max.   : 0.89573
# Kidney liver
hc_kidney_liver <-  as.data.frame(non_cons_de_corr(c(17, 18, 21, 22, 25, 26, 29, 30),c(2, 3, 6, 7, 10, 11,  14,15)))
colnames(hc_kidney_liver) <- c("Pearson's correlation")

summary(hc_kidney_liver)
##  Pearson's correlation
##  Min.   :-0.97932
##  1st Qu.:-0.42528
##  Median :-0.10351
##  Mean   :-0.06574
##  3rd Qu.: 0.29806
##  Max.   : 0.87763
# Kidney lung
hc_kidney_lung <-  as.data.frame(non_cons_de_corr(c(17, 19, 21, 23, 25, 27, 29, 31),c(2, 4, 6, 8, 10, 12,  14,16)))
colnames(hc_kidney_lung) <- c("Pearson's correlation")

summary(hc_kidney_lung)
##  Pearson's correlation
##  Min.   :-0.9039
##  1st Qu.:-0.5772
##  Median :-0.2471
##  Mean   :-0.1882
##  3rd Qu.: 0.1030
##  Max.   : 0.9341
# Liver lung
hc_liver_lung <-  as.data.frame(non_cons_de_corr(c(18, 19, 22, 23, 26, 27, 30, 31),c(3, 4, 7, 8, 11, 12,  15,16)))
colnames(hc_liver_lung) <- c("Pearson's correlation")

summary(hc_liver_lung)
##  Pearson's correlation
##  Min.   :-0.9473
##  1st Qu.:-0.4992
##  Median :-0.1780
##  Mean   :-0.1168
##  3rd Qu.: 0.2871
##  Max.   : 0.9296
non_cons_de_corr_human <- rbind(hc_heart_kidney, hc_heart_liver, hc_heart_lung, hc_kidney_liver, hc_kidney_lung, hc_liver_lung)

#hist(non_cons_de_corr_human)

dim(non_cons_de_corr_human)
## [1] 1441 1
write.table(non_cons_de_corr_human, "/Users/laurenblake/Desktop/Regulatory_Evol/ashlar-trial/data/Corr_human_chimp_DE/corr_hc_human_only_de.txt")
Chimp DE only
# Heart kidney
hc_heart_kidney <- as.data.frame(non_cons_de_corr(c(1, 2, 5, 6, 9, 10, 13, 14),c(17, 20, 21, 24, 25, 28, 29)))

colnames(hc_heart_kidney) <- c("Pearson's correlation")

summary(corr_non_cons_DE_HK)
##  corr_non_cons_DE_HK
##  Min.   :-0.96377
##  1st Qu.:-0.42337
##  Median :-0.06886
##  Mean   :-0.04466
##  3rd Qu.: 0.38677
##  Max.   : 0.93749
summary(hc_heart_kidney)
##  Pearson's correlation
##  Min.   :-0.98671
##  1st Qu.:-0.41596
##  Median :-0.06873
##  Mean   :-0.05857
##  3rd Qu.: 0.28471
##  Max.   : 0.95825
# Heart liver
hc_heart_liver <-  as.data.frame(non_cons_de_corr(c(1, 3, 5, 7, 9, 11, 13, 15), c(18, 20, 22, 24, 26, 28, 30)))
colnames(hc_heart_liver) <- c("Pearson's correlation")

summary(hc_heart_liver)
##  Pearson's correlation
##  Min.   :-0.9910
##  1st Qu.:-0.5143
##  Median :-0.1248
##  Mean   :-0.1005
##  3rd Qu.: 0.2996
##  Max.   : 0.9708
# Heart lung
hc_heart_lung <-  as.data.frame(non_cons_de_corr(c(1, 4, 5, 8, 9, 12, 13, 16), c(19, 20, 23, 24, 27, 28, 31)))
colnames(hc_heart_lung) <- c("Pearson's correlation")

summary(hc_heart_lung)
##  Pearson's correlation
##  Min.   :-0.975948
##  1st Qu.:-0.386299
##  Median : 0.001263
##  Mean   :-0.009077
##  3rd Qu.: 0.366385
##  Max.   : 0.952925
# Kidney liver
hc_kidney_liver <-  as.data.frame(non_cons_de_corr(c(2, 3, 6, 7, 10, 11,  14,15), c(17, 18, 21, 22, 25, 26, 29, 30)))
colnames(hc_kidney_liver) <- c("Pearson's correlation")

summary(hc_kidney_liver)
##  Pearson's correlation
##  Min.   :-0.9853
##  1st Qu.:-0.4956
##  Median :-0.1370
##  Mean   :-0.1075
##  3rd Qu.: 0.2726
##  Max.   : 0.9871
# Kidney lung
hc_kidney_lung <-  as.data.frame(non_cons_de_corr(c(2, 4, 6, 8, 10, 12,  14,16), c(17, 19, 21, 23, 25, 27, 29, 31)))
colnames(hc_kidney_lung) <- c("Pearson's correlation")

summary(hc_kidney_lung)
##  Pearson's correlation
##  Min.   :-0.98564
##  1st Qu.:-0.45374
##  Median :-0.09009
##  Mean   :-0.08740
##  3rd Qu.: 0.26654
##  Max.   : 0.98709
# Liver lung
hc_liver_lung <-  as.data.frame(non_cons_de_corr(c(3, 4, 7, 8, 11, 12,  15,16), c(18, 19, 22, 23, 26, 27, 30, 31)))
colnames(hc_liver_lung) <- c("Pearson's correlation")

summary(hc_liver_lung)
##  Pearson's correlation
##  Min.   :-0.9804
##  1st Qu.:-0.5198
##  Median :-0.1549
##  Mean   :-0.1168
##  3rd Qu.: 0.2706
##  Max.   : 0.9615
non_cons_de_corr_chimp <- rbind(hc_heart_kidney, hc_heart_liver, hc_heart_lung, hc_kidney_liver, hc_kidney_lung, hc_liver_lung)

#hist(non_cons_de_corr_chimp)

dim(non_cons_de_corr_chimp)
## [1] 12221 1
write.table(non_cons_de_corr_chimp, "/Users/laurenblake/Desktop/Regulatory_Evol/ashlar-trial/data/Corr_human_chimp_DE/corr_hc_chimp_only_de.txt")
Genearalize non DE to a function
non_de_corr <- function(human_chimp_heart){

# Methylation
hc_exprs <- exprs[,2:48]
exprs_methyl <- exprs[,49:79]

# HC heart only


hc_exprs_heart <- hc_exprs[,human_chimp_heart]


methyl <- exprs_methyl[,human_chimp_heart]
rownames(hc_exprs_heart) <- rownames(exprs)
rownames(methyl) <- rownames(exprs)


Y <- hc_exprs_heart
two_species <- samples$Tissue[human_chimp_heart]
X <- droplevels.factor(two_species)
M <- methyl
RIN_subset <- RIN[human_chimp_heart]


# Run the linear model in limma
  design_1 <- model.matrix(~ X + RIN_subset)
  fit_all <- lmFit(cpm.voom.cyclic[,human_chimp_heart], design_1)
  fit_all <- eBayes(fit_all)

# Get results
  HvC_Heart_fit_all = topTable(fit_all, coef=2, adjust="BH", number=Inf, sort.by="none")
  HvC_Heart_fit_all_5perc <-
HvC_Heart_fit_all[which(HvC_Heart_fit_all$adj.P.Val > FDR_level), ]

 human_chimp_heart1 <-  rownames(methyl) %in% rownames( HvC_Heart_fit_all_5perc)
human_chimp_heart1 <- as.data.frame(human_chimp_heart1)
counts_genes_in <- cbind(methyl, human_chimp_heart1)
counts_genes_in_cutoff <- subset(counts_genes_in, human_chimp_heart1 == "TRUE")
counts_human_chimp_heart_subset <- counts_genes_in_cutoff[,1:7]
M <- counts_human_chimp_heart_subset

human_chimp_heart1 <-  rownames(hc_exprs_heart) %in% rownames( HvC_Heart_fit_all_5perc)
human_chimp_heart1 <- as.data.frame(human_chimp_heart1)
counts_genes_in <- cbind(hc_exprs_heart, human_chimp_heart1)
counts_genes_in_cutoff <- subset(counts_genes_in, human_chimp_heart1 == "TRUE")
counts_human_chimp_heart_subset <- counts_genes_in_cutoff[,1:7]
Y <- counts_human_chimp_heart_subset

non_DE_heart_kidney_exp <- Y
non_DE_heart_kidney_meth <- M

# Find the correlation

corr_non_DE_HK <- array("NA", dim=c(nrow(Y),1))

for (i in 1:nrow(Y)){
  corr_non_DE_HK[i,] <- cor(t(non_DE_heart_kidney_exp[i,]), t(non_DE_heart_kidney_meth[i,]))
}

corr_non_DE_HK <- as.numeric(corr_non_DE_HK)

return(corr_non_DE_HK)
}

# Humans

# Heart kidney
hc_heart_kidney <- as.data.frame(non_de_corr(c(17, 20, 21, 24, 25, 28, 29)))

colnames(hc_heart_kidney) <- c("Pearson's correlation")

summary(corr_non_DE_HK)
##  corr_non_DE_HK
##  Min.   :-0.96869
##  1st Qu.:-0.34937
##  Median :-0.02627
##  Mean   :-0.02398
##  3rd Qu.: 0.30455
##  Max.   : 0.96692
summary(hc_heart_kidney)
##  Pearson's correlation
##  Min.   :-0.96869
##  1st Qu.:-0.34937
##  Median :-0.02627
##  Mean   :-0.02398
##  3rd Qu.: 0.30455
##  Max.   : 0.96692
# Heart liver
hc_heart_liver <-  as.data.frame(non_de_corr(c(18, 20, 22, 24, 26, 28, 30)))
colnames(hc_heart_liver) <- c("Pearson's correlation")

summary(hc_heart_liver)
##  Pearson's correlation
##  Min.   :-0.97038
##  1st Qu.:-0.37083
##  Median :-0.04651
##  Mean   :-0.03843
##  3rd Qu.: 0.28561
##  Max.   : 0.94511
# Heart lung
hc_heart_lung <-  as.data.frame(non_de_corr(c(19, 20, 23, 24, 27, 28, 31)))
colnames(hc_heart_lung) <- c("Pearson's correlation")

summary(hc_heart_lung)
##  Pearson's correlation
##  Min.   :-0.98626
##  1st Qu.:-0.35191
##  Median :-0.03240
##  Mean   :-0.03205
##  3rd Qu.: 0.28266
##  Max.   : 0.97450
# Kidney liver
hc_kidney_liver <-  as.data.frame(non_de_corr(c(17, 18, 21, 22, 25, 26, 29, 30)))
colnames(hc_kidney_liver) <- c("Pearson's correlation")

summary(hc_kidney_liver)
##  Pearson's correlation
##  Min.   :-0.98306
##  1st Qu.:-0.34659
##  Median :-0.04081
##  Mean   :-0.03140
##  3rd Qu.: 0.27483
##  Max.   : 0.98990
# Kidney lung
hc_kidney_lung <-  as.data.frame(non_de_corr(c(17, 19, 21, 23, 25, 27, 29, 31)))
colnames(hc_kidney_lung) <- c("Pearson's correlation")

summary(hc_kidney_lung)
##  Pearson's correlation
##  Min.   :-0.98775
##  1st Qu.:-0.36469
##  Median :-0.04378
##  Mean   :-0.03460
##  3rd Qu.: 0.29392
##  Max.   : 0.97953
# Liver lung
hc_liver_lung <-  as.data.frame(non_de_corr(c(18, 19, 22, 23, 26, 27, 30, 31)))
colnames(hc_liver_lung) <- c("Pearson's correlation")

summary(hc_liver_lung)
##  Pearson's correlation
##  Min.   :-0.96791
##  1st Qu.:-0.37620
##  Median :-0.05377
##  Mean   :-0.04541
##  3rd Qu.: 0.28522
##  Max.   : 0.99868
hc_non_de_human <- rbind(hc_heart_kidney, hc_heart_liver, hc_heart_lung, hc_kidney_liver, hc_kidney_lung, hc_liver_lung)

dim(hc_non_de_human)
## [1] 38073 1
write.table(hc_non_de_human, "/Users/laurenblake/Desktop/Regulatory_Evol/ashlar-trial/data/Corr_human_chimp_DE/corr_hc_human_nonde.txt")


# Chimps

# Heart kidney
hc_heart_kidney <- as.data.frame(non_de_corr(c(1, 2, 5, 6, 9, 10, 13, 14)))

colnames(hc_heart_kidney) <- c("Pearson's correlation")

summary(hc_heart_kidney)
##  Pearson's correlation
##  Min.   :-0.99201
##  1st Qu.:-0.34433
##  Median :-0.02937
##  Mean   :-0.02600
##  3rd Qu.: 0.28308
##  Max.   : 0.96438
# Heart liver
hc_heart_liver <-  as.data.frame(non_de_corr(c(1, 3, 5, 7, 9, 11, 13, 15)))
colnames(hc_heart_liver) <- c("Pearson's correlation")

summary(hc_heart_liver)
##  Pearson's correlation
##  Min.   :-0.96898
##  1st Qu.:-0.33686
##  Median :-0.02711
##  Mean   :-0.02041
##  3rd Qu.: 0.29929
##  Max.   : 0.97543
# Heart lung
hc_heart_lung <-  as.data.frame(non_de_corr(c(1, 4, 5, 8, 9, 12, 13, 16)))
colnames(hc_heart_lung) <- c("Pearson's correlation")

summary(hc_heart_lung)
##  Pearson's correlation
##  Min.   :-0.986008
##  1st Qu.:-0.328012
##  Median :-0.001017
##  Mean   :-0.007878
##  3rd Qu.: 0.314737
##  Max.   : 0.935075
# Kidney liver
hc_kidney_liver <-  as.data.frame(non_de_corr(c(2, 3, 6, 7, 10, 11,  14,15)))
colnames(hc_kidney_liver) <- c("Pearson's correlation")

summary(hc_kidney_liver)
##  Pearson's correlation
##  Min.   :-0.96627
##  1st Qu.:-0.35291
##  Median :-0.04287
##  Mean   :-0.03615
##  3rd Qu.: 0.27727
##  Max.   : 0.95441
# Kidney lung
hc_kidney_lung <-  as.data.frame(non_de_corr(c(2, 4, 6, 8, 10, 12,  14,16)))
colnames(hc_kidney_lung) <- c("Pearson's correlation")

summary(hc_kidney_lung)
##  Pearson's correlation
##  Min.   :-0.97337
##  1st Qu.:-0.32720
##  Median :-0.01949
##  Mean   :-0.01895
##  3rd Qu.: 0.28235
##  Max.   : 0.96105
# Liver lung
hc_liver_lung <-  as.data.frame(non_de_corr(c(3, 4, 7, 8, 11, 12,  15,16)))
colnames(hc_liver_lung) <- c("Pearson's correlation")

summary(hc_liver_lung)
##  Pearson's correlation
##  Min.   :-0.952821
##  1st Qu.:-0.328273
##  Median :-0.007886
##  Mean   :-0.009477
##  3rd Qu.: 0.295086
##  Max.   : 0.974110
hc_non_de_chimp <- rbind(hc_heart_kidney, hc_heart_liver, hc_heart_lung, hc_kidney_liver, hc_kidney_lung, hc_liver_lung)

dim(hc_non_de_chimp)
## [1] 27293 1
#hist(hc_non_de_chimp)
write.table(hc_non_de_chimp, "/Users/laurenblake/Desktop/Regulatory_Evol/ashlar-trial/data/Corr_human_chimp_DE/corr_hc_chimp_nonde.txt")