# Load libraries

library("gplots")
Warning: package 'gplots' was built under R version 3.4.4
Attaching package: 'gplots'
The following object is masked from 'package:stats':

    lowess
library("ggplot2")
library("RColorBrewer")
library("scales")
Warning: package 'scales' was built under R version 3.4.4
library("edgeR")
Loading required package: limma
library("R.utils")
Warning: package 'R.utils' was built under R version 3.4.4
Loading required package: R.oo
Warning: package 'R.oo' was built under R version 3.4.4
Loading required package: R.methodsS3
R.methodsS3 v1.7.1 (2016-02-15) successfully loaded. See ?R.methodsS3 for help.
R.oo v1.22.0 (2018-04-21) successfully loaded. See ?R.oo for help.
Attaching package: 'R.oo'
The following objects are masked from 'package:methods':

    getClasses, getMethods
The following objects are masked from 'package:base':

    attach, detach, gc, load, save
R.utils v2.8.0 successfully loaded. See ?R.utils for help.
Attaching package: 'R.utils'
The following object is masked from 'package:utils':

    timestamp
The following objects are masked from 'package:base':

    cat, commandArgs, getOption, inherits, isOpen, parse, warnings
library("plyr")
library("limma")
library("gridExtra")
library("VennDiagram")
Warning: package 'VennDiagram' was built under R version 3.4.4
Loading required package: grid
Loading required package: futile.logger
source("functions.R")
library(ashr)
Warning: package 'ashr' was built under R version 3.4.4
library(ggplot2)
library("topGO")
Loading required package: BiocGenerics
Loading required package: parallel
Attaching package: 'BiocGenerics'
The following objects are masked from 'package:parallel':

    clusterApply, clusterApplyLB, clusterCall, clusterEvalQ,
    clusterExport, clusterMap, parApply, parCapply, parLapply,
    parLapplyLB, parRapply, parSapply, parSapplyLB
The following object is masked from 'package:gridExtra':

    combine
The following object is masked from 'package:limma':

    plotMA
The following objects are masked from 'package:stats':

    IQR, mad, sd, var, xtabs
The following objects are masked from 'package:base':

    anyDuplicated, append, as.data.frame, cbind, colMeans,
    colnames, colSums, do.call, duplicated, eval, evalq, Filter,
    Find, get, grep, grepl, intersect, is.unsorted, lapply,
    lengths, Map, mapply, match, mget, order, paste, pmax,
    pmax.int, pmin, pmin.int, Position, rank, rbind, Reduce,
    rowMeans, rownames, rowSums, sapply, setdiff, sort, table,
    tapply, union, unique, unsplit, which, which.max, which.min
Loading required package: graph
Attaching package: 'graph'
The following object is masked from 'package:plyr':

    join
Loading required package: Biobase
Welcome to Bioconductor

    Vignettes contain introductory material; view with
    'browseVignettes()'. To cite Bioconductor, see
    'citation("Biobase")', and for packages 'citation("pkgname")'.
Loading required package: GO.db
Loading required package: AnnotationDbi
Loading required package: stats4
Loading required package: IRanges
Loading required package: S4Vectors
Attaching package: 'S4Vectors'
The following object is masked from 'package:plyr':

    rename
The following object is masked from 'package:gplots':

    space
The following object is masked from 'package:base':

    expand.grid
Attaching package: 'IRanges'
The following object is masked from 'package:plyr':

    desc
The following object is masked from 'package:R.oo':

    trim
Loading required package: SparseM
Attaching package: 'SparseM'
The following object is masked from 'package:base':

    backsolve
groupGOTerms: GOBPTerm, GOMFTerm, GOCCTerm environments built.
Attaching package: 'topGO'
The following object is masked from 'package:IRanges':

    members
The following object is masked from 'package:grid':

    depth
#library("biomaRt")
library("clusterProfiler")
Loading required package: DOSE
DOSE v3.4.0  For help: https://guangchuangyu.github.io/DOSE

If you use DOSE in published research, please cite:
Guangchuang Yu, Li-Gen Wang, Guang-Rong Yan, Qing-Yu He. DOSE: an R/Bioconductor package for Disease Ontology Semantic and Enrichment analysis. Bioinformatics 2015, 31(4):608-609
clusterProfiler v3.6.0  For help: https://guangchuangyu.github.io/clusterProfiler

If you use clusterProfiler in published research, please cite:
Guangchuang Yu., Li-Gen Wang, Yanyan Han, Qing-Yu He. clusterProfiler: an R package for comparing biological themes among gene clusters. OMICS: A Journal of Integrative Biology. 2012, 16(5):284-287.
library("org.Hs.eg.db")
# Set directory to save the data

data_dir <- "../data"

# Load colors

colors <- colorRampPalette(c(brewer.pal(9, "Blues")[1],brewer.pal(9, "Blues")[9]))(100)
pal <- c(brewer.pal(9, "Set1"), brewer.pal(8, "Set2"), brewer.pal(12, "Set3"))

# Retrieve RIN score for each sample
RNA_seq_info <- read.csv("../../../Reg_Evo_Primates/data/RNA_seq_info.csv")
RIN <- as.data.frame(RNA_seq_info[,22])
RIN <- as.matrix(RIN)
colnames(RIN) <- c("RIN")

# Retrieve sample information
samples <- read.delim("../../../Reg_Evo_Primates/data/Sample_info_RNAseq_limma.txt")

# Eliminate H1H
samples <- samples[-17,]
dim(samples)
[1] 47 4
# Label species and tissues

species <- samples$Species
length(species)
[1] 47
tissue <- samples$Tissue
length(tissue)
[1] 47
labels <- paste(samples$Species, samples$Tissue, sep=" ")
Test interactions
## Make the contrast matrix and rename columns of the contrast matrix

design <- model.matrix(~ species*tissue + RIN)
colnames(design)[1] <- "Intercept"
colnames(design)[2] <- "Human"
colnames(design)[3] <- "Rhesus"
colnames(design)[4] <- "Kidney"
colnames(design)[5] <- "Liver"
colnames(design)[6] <- "Lung"
colnames(design)[8] <- "H_by_K"
colnames(design)[9] <- "R_by_K"
colnames(design)[10] <- "H_by_Li"
colnames(design)[11] <- "R_by_Li"
colnames(design)[12] <- "H_by_Lu"
colnames(design)[13] <- "R_by_Lu"

# Look at the number of samples in each column
colSums(design)
Intercept     Human    Rhesus    Kidney     Liver      Lung       RIN
     47.0      15.0      16.0      12.0      12.0      12.0     368.2
   H_by_K    R_by_K   H_by_Li   R_by_Li   H_by_Lu   R_by_Lu
      4.0       4.0       4.0       4.0       4.0       4.0
# Load count data

counts_genes_in_cutoff <- read.delim("../../../Reg_Evo_Primates/data/counts_12184.txt")

# TMM

dge_in_cutoff <- DGEList(counts=as.matrix(counts_genes_in_cutoff), genes=rownames(counts_genes_in_cutoff), group = as.character(t(labels)))
dge_in_cutoff <- calcNormFactors(dge_in_cutoff)

cpm_in_cutoff <- cpm(dge_in_cutoff, normalized.lib.sizes=TRUE, log=TRUE)
head(cpm_in_cutoff)
                     C1H      C1K      C1Li     C1Lu      C2H      C2K
ENSG00000000003 4.569101 6.484481  8.260731 5.481561 4.686636 6.076562
ENSG00000000419 5.842023 5.217972  5.937465 5.478545 5.681016 5.100404
ENSG00000000457 4.560130 5.214732  5.902494 4.972557 4.834031 5.289413
ENSG00000000460 1.506846 1.869887  2.080244 2.308985 1.660573 1.968249
ENSG00000000938 5.611783 3.819613  5.091152 7.550720 2.533135 4.178135
ENSG00000000971 6.877100 4.451824 11.368082 6.100181 6.135730 4.887383
                     C2Li     C2Lu      C3H      C3K      C3Li     C3Lu
ENSG00000000003  8.029471 4.564496 4.915377 6.406310  7.784365 5.875983
ENSG00000000419  5.813444 5.199855 5.675979 5.179418  6.413682 5.596709
ENSG00000000457  6.545270 4.985922 4.618657 5.204247  6.498053 5.168988
ENSG00000000460  2.324903 2.023533 1.580465 1.461635  2.344190 2.124699
ENSG00000000938  5.388459 8.083442 4.965147 4.223500  5.204433 7.160345
ENSG00000000971 11.387090 6.246512 5.606820 4.941061 11.420166 5.990777
                     C4H      C4K      C4Li     C4Lu      H1K      H1Li
ENSG00000000003 4.235754 6.503717  8.453727 5.430223 6.864660  6.576082
ENSG00000000419 5.785414 5.257938  5.881536 5.321782 5.588152  6.082997
ENSG00000000457 4.645293 5.023223  6.597499 5.263806 4.285007  4.953825
ENSG00000000460 1.456629 1.826787  2.206829 2.476664 2.766766  4.989335
ENSG00000000938 3.638952 3.621239  4.580376 7.717763 4.059344  4.479943
ENSG00000000971 6.845219 5.957838 11.330910 6.421417 6.585546 11.216641
                    H1Lu      H2H      H2K     H2Li     H2Lu         H3H
ENSG00000000003 5.099004 3.681088 7.205567 6.638944 4.181104  3.54360583
ENSG00000000419 5.810855 5.606326 5.461678 5.838444 5.313450  5.75090978
ENSG00000000457 4.502116 3.406682 4.158467 4.450840 4.201852  4.44063190
ENSG00000000460 3.318021 1.892216 1.978501 2.657920 2.553081 -0.07576077
ENSG00000000938 7.878166 5.560041 3.740312 5.990299 6.968892  4.09684184
ENSG00000000971 7.561408 6.363288 4.736443 9.409472 7.310814  6.22507411
                     H3K      H3Li     H3Lu      H4H      H4K      H4Li
ENSG00000000003 7.091569  7.735945 5.290097 4.284175 6.371782  6.590115
ENSG00000000419 5.854940  6.216818 5.009845 6.244527 5.608088  5.834153
ENSG00000000457 4.722790  4.993719 3.999170 3.312369 4.087480  5.176119
ENSG00000000460 2.990603  3.237751 2.457261 1.629959 1.983141  3.137731
ENSG00000000938 2.643134  5.741066 6.912746 4.918491 3.820852  6.899117
ENSG00000000971 5.313255 10.346500 7.124250 6.927089 6.032612 10.197598
                    H4Lu      R1H      R1K       R1Li     R1Lu      R2H
ENSG00000000003 4.463456 4.356369 6.932932  8.3343252 5.915547 4.625348
ENSG00000000419 5.350423 5.464082 5.391834  5.8259430 4.887057 5.295517
ENSG00000000457 4.173647 4.285211 5.024853  5.1435415 4.837373 4.311664
ENSG00000000460 2.604439 1.284359 1.555258 -0.1735364 2.480549 1.415808
ENSG00000000938 8.249002 1.837210 2.564210  3.8041639 6.515323 2.327061
ENSG00000000971 8.277236 4.027912 6.576019 12.1322643 7.445976 5.571685
                     R2K      R2Li     R2Lu      R3H      R3K      R3Li
ENSG00000000003 7.134183  8.640291 5.654663 4.469039 7.166047  8.202424
ENSG00000000419 5.043831  5.723120 4.881450 5.462958 5.367362  5.990303
ENSG00000000457 5.154832  5.511121 5.265617 4.241449 5.139792  5.359535
ENSG00000000460 1.320003  1.496941 2.394895 1.656614 1.874414  1.413727
ENSG00000000938 2.681748  3.672247 6.583375 2.870792 2.267214  3.636318
ENSG00000000971 6.778700 11.778253 7.231996 5.150488 6.054215 12.087241
                    R3Lu      R4H      R4K      R4Li     R4Lu
ENSG00000000003 5.453490 4.892515 7.094406  7.705335 5.361237
ENSG00000000419 4.956114 5.427374 5.215706  5.464168 5.041757
ENSG00000000457 5.165431 4.509684 5.144266  5.318210 4.828352
ENSG00000000460 2.577251 1.088179 1.509418  1.534185 2.847559
ENSG00000000938 6.845883 2.474777 2.310571  4.509304 6.834845
ENSG00000000971 7.258258 6.408881 6.469038 11.695479 7.298202
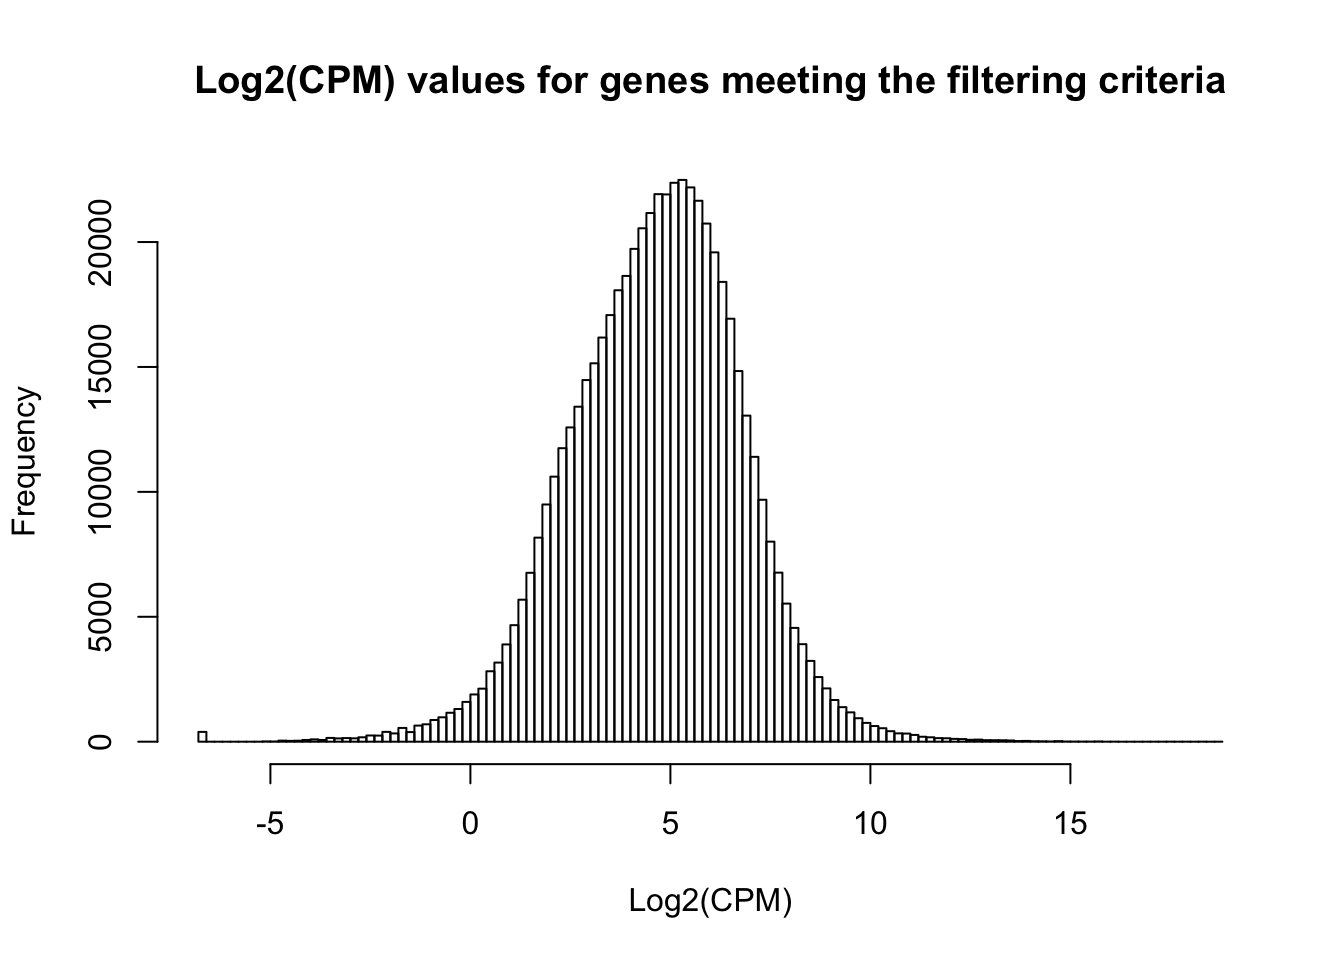
hist(cpm_in_cutoff, xlab = "Log2(CPM)", main = "Log2(CPM) values for genes meeting the filtering criteria", breaks = 100 )
# Voom with individual as a random variable
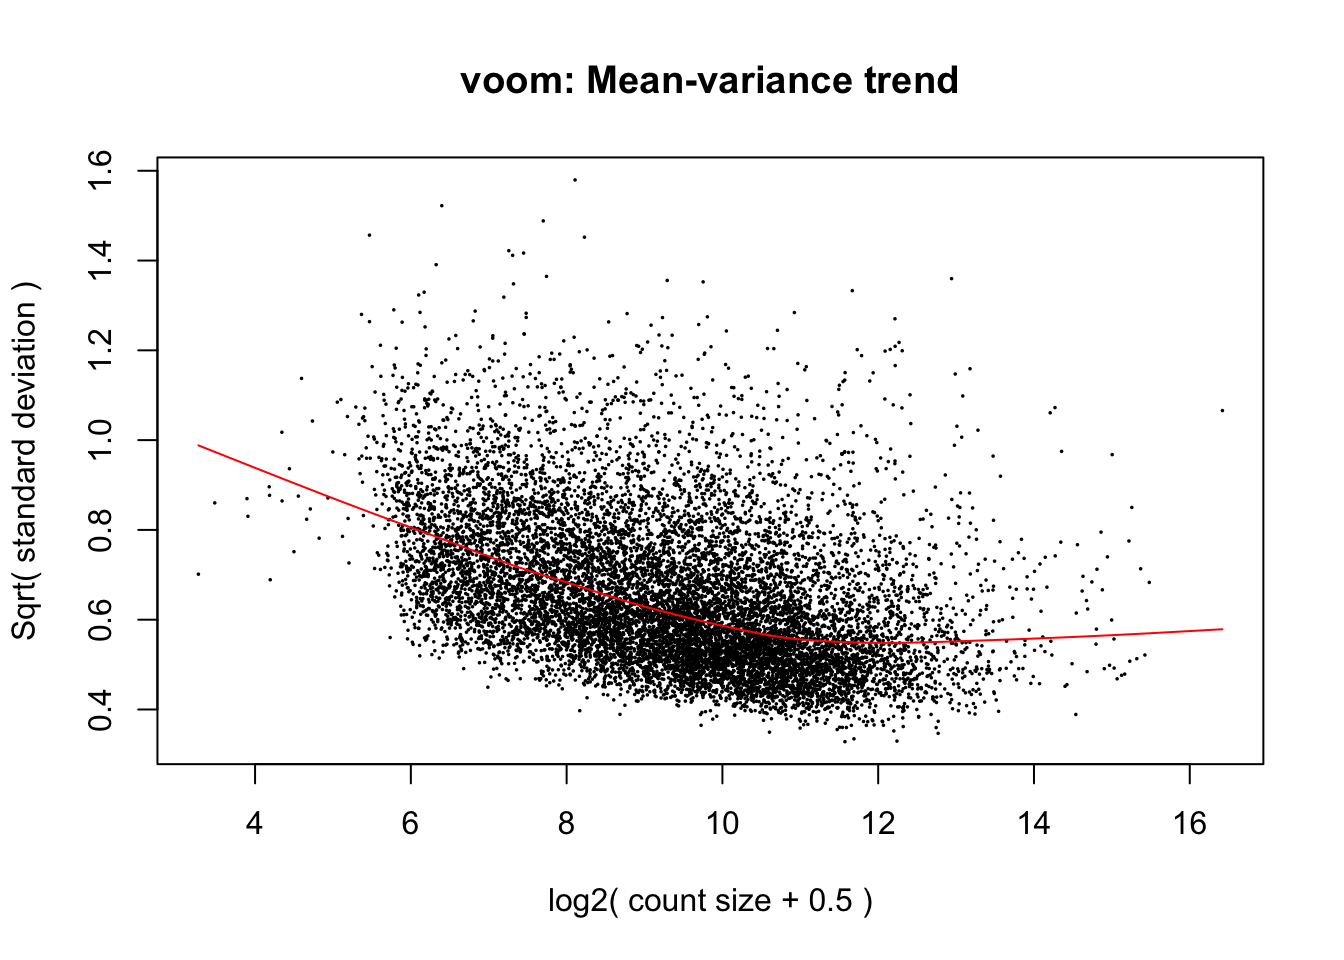
cpm.voom.cyclic <- voom(dge_in_cutoff, design, normalize.method="cyclicloess", plot=T)
#corfit <- duplicateCorrelation(cpm.voom.cyclic, design, block=samples$Individual)
corfit.consensus <- 0.2197275
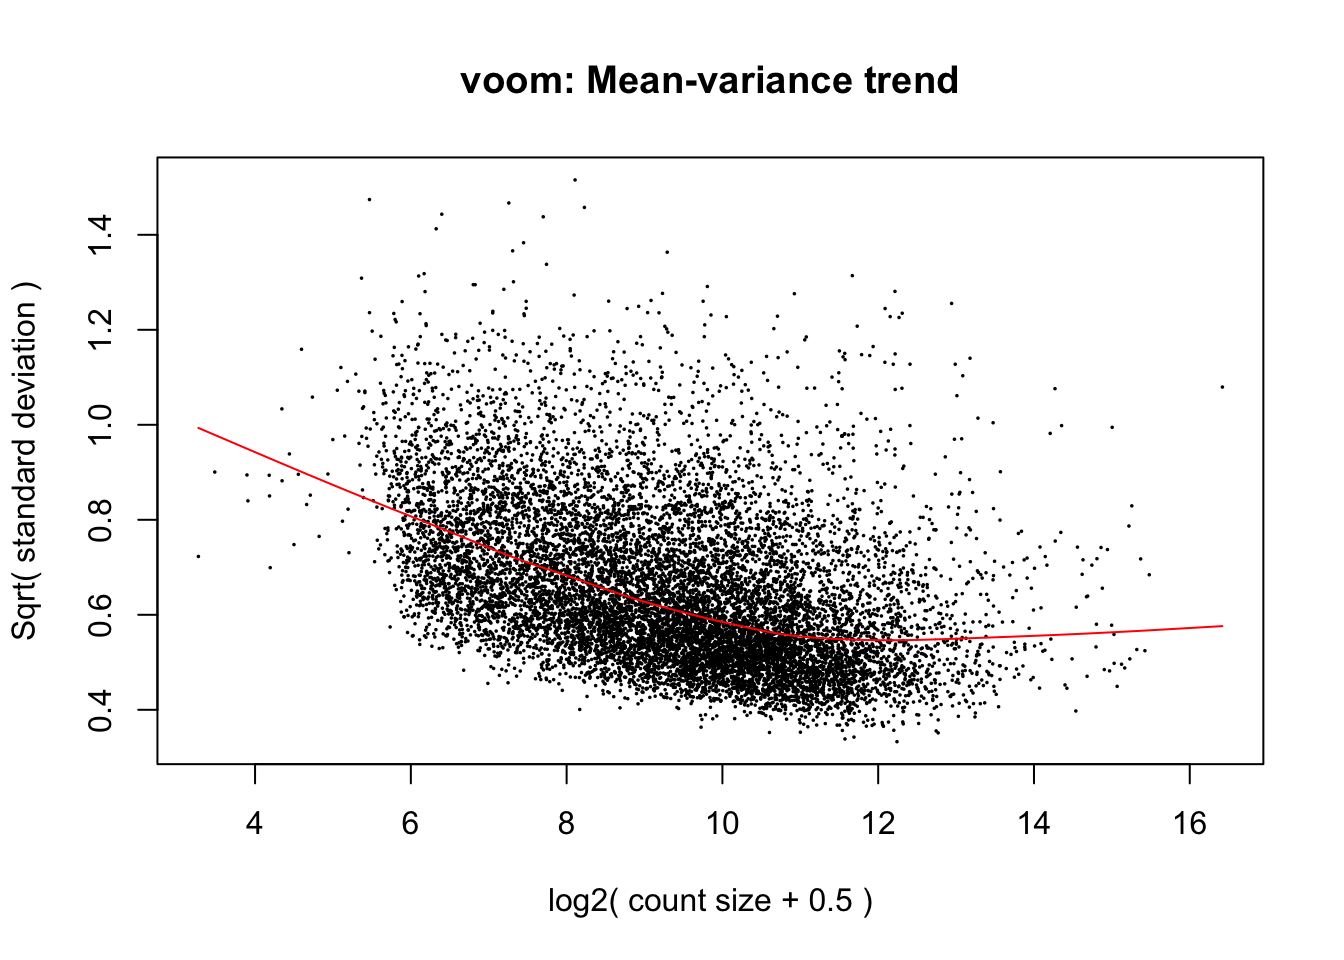
# Final voom on filtered data
cpm.voom.cyclic <- voom(dge_in_cutoff, design, normalize.method="cyclicloess", plot=TRUE, block=samples$Individual, correlation=corfit.consensus)
Fit the linear model
fit.cyclic.norm <- lmFit(cpm.voom.cyclic, design, plot = TRUE, block=samples$Individual, correlation=corfit.consensus)
fit.cyclic.norm <- eBayes(fit.cyclic.norm)
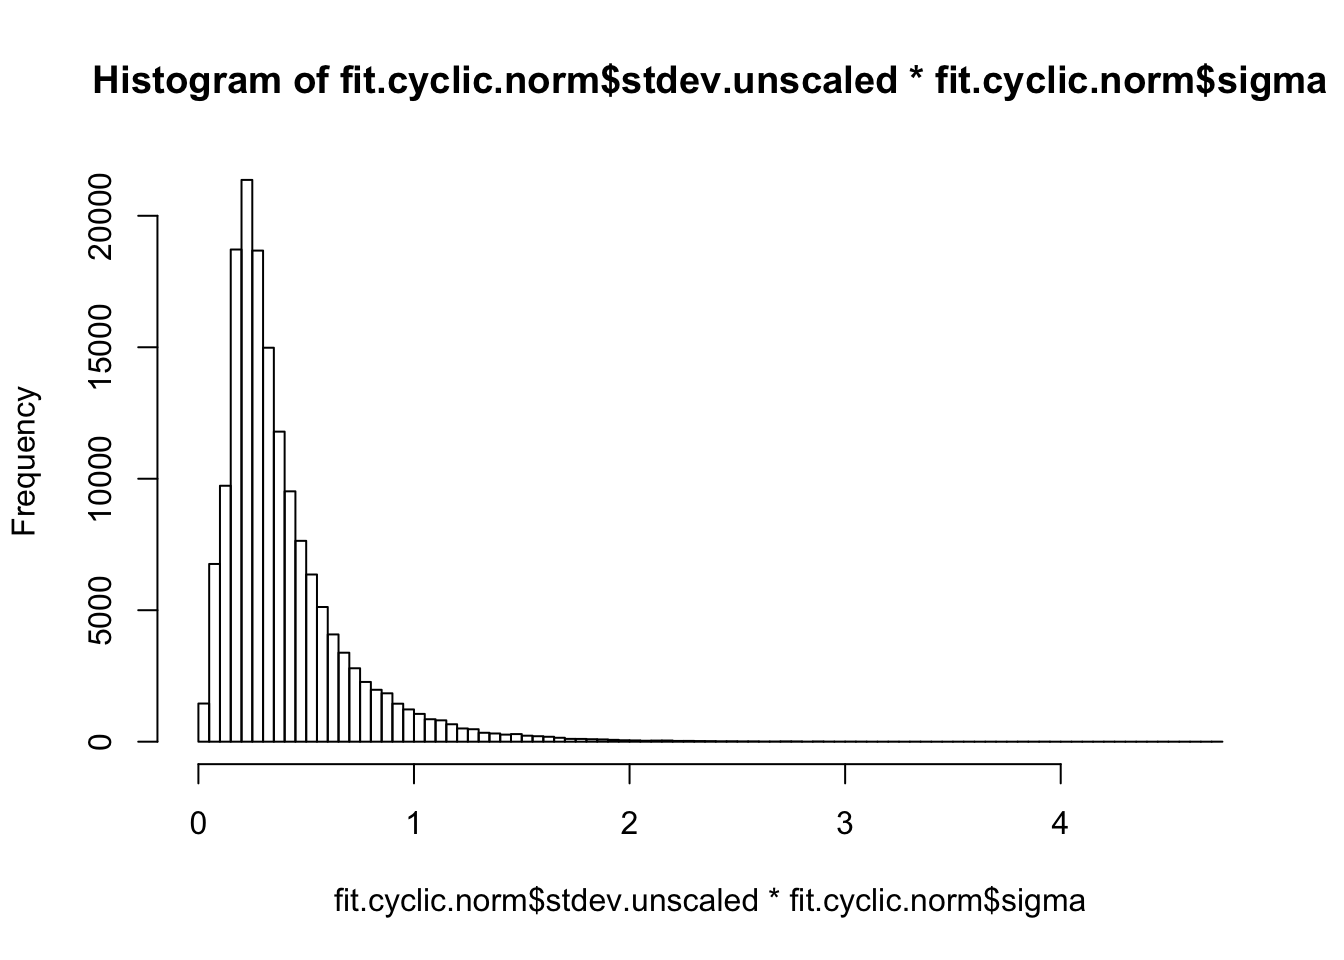
## - Potential caveat: variances could be different between human, chimp and rhesus (see Gordon Smyth email, 7 June 2013).
## We look at the standard error for each condition
hist(fit.cyclic.norm$stdev.unscaled * fit.cyclic.norm$sigma, breaks=100)
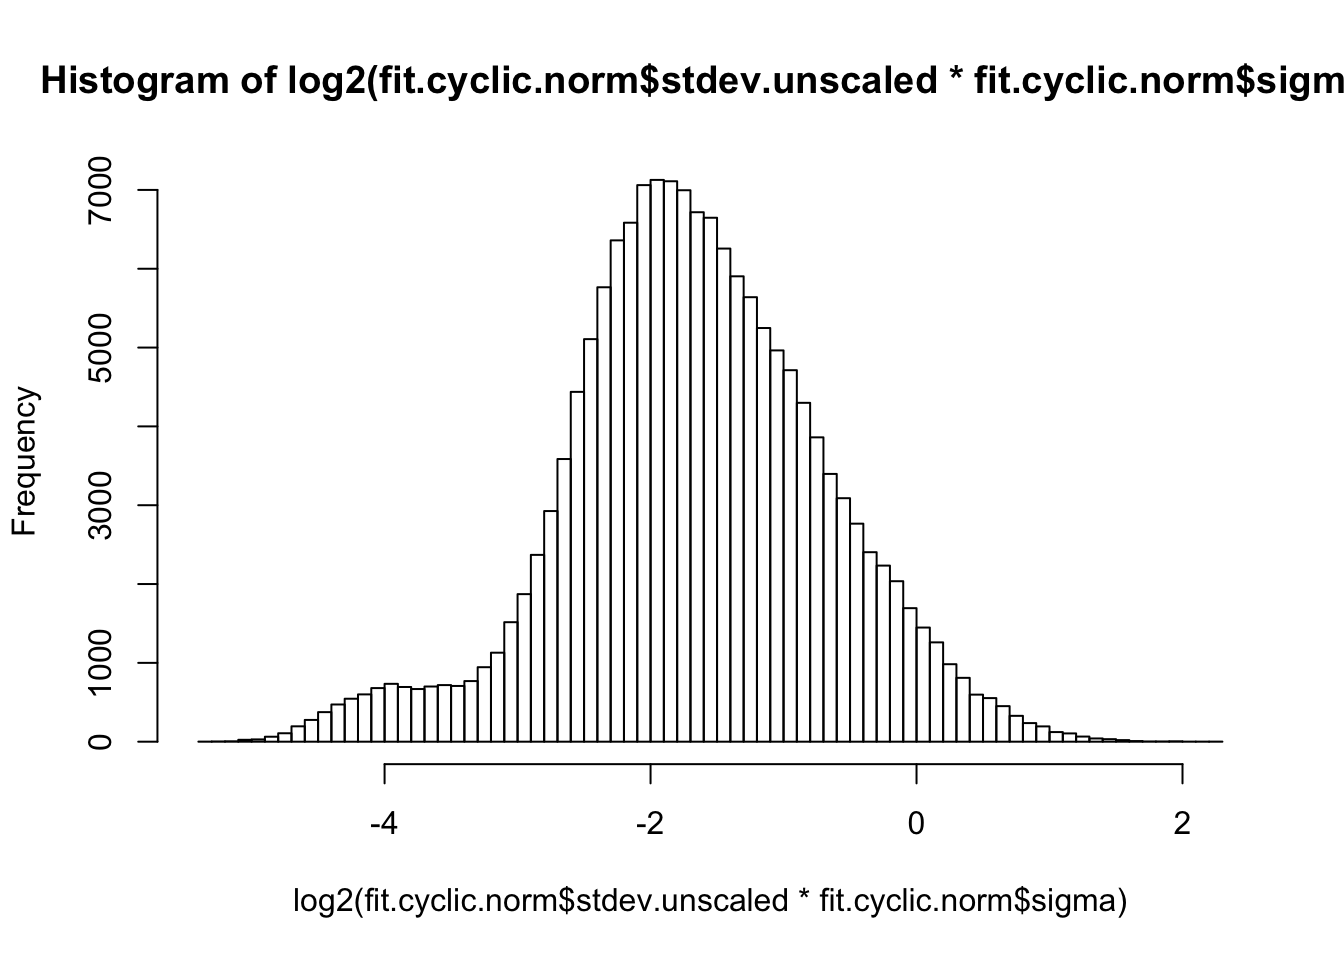
hist(log2(fit.cyclic.norm$stdev.unscaled * fit.cyclic.norm$sigma), breaks=100)
boxplot(log2(fit.cyclic.norm$stdev.unscaled * fit.cyclic.norm$sigma))
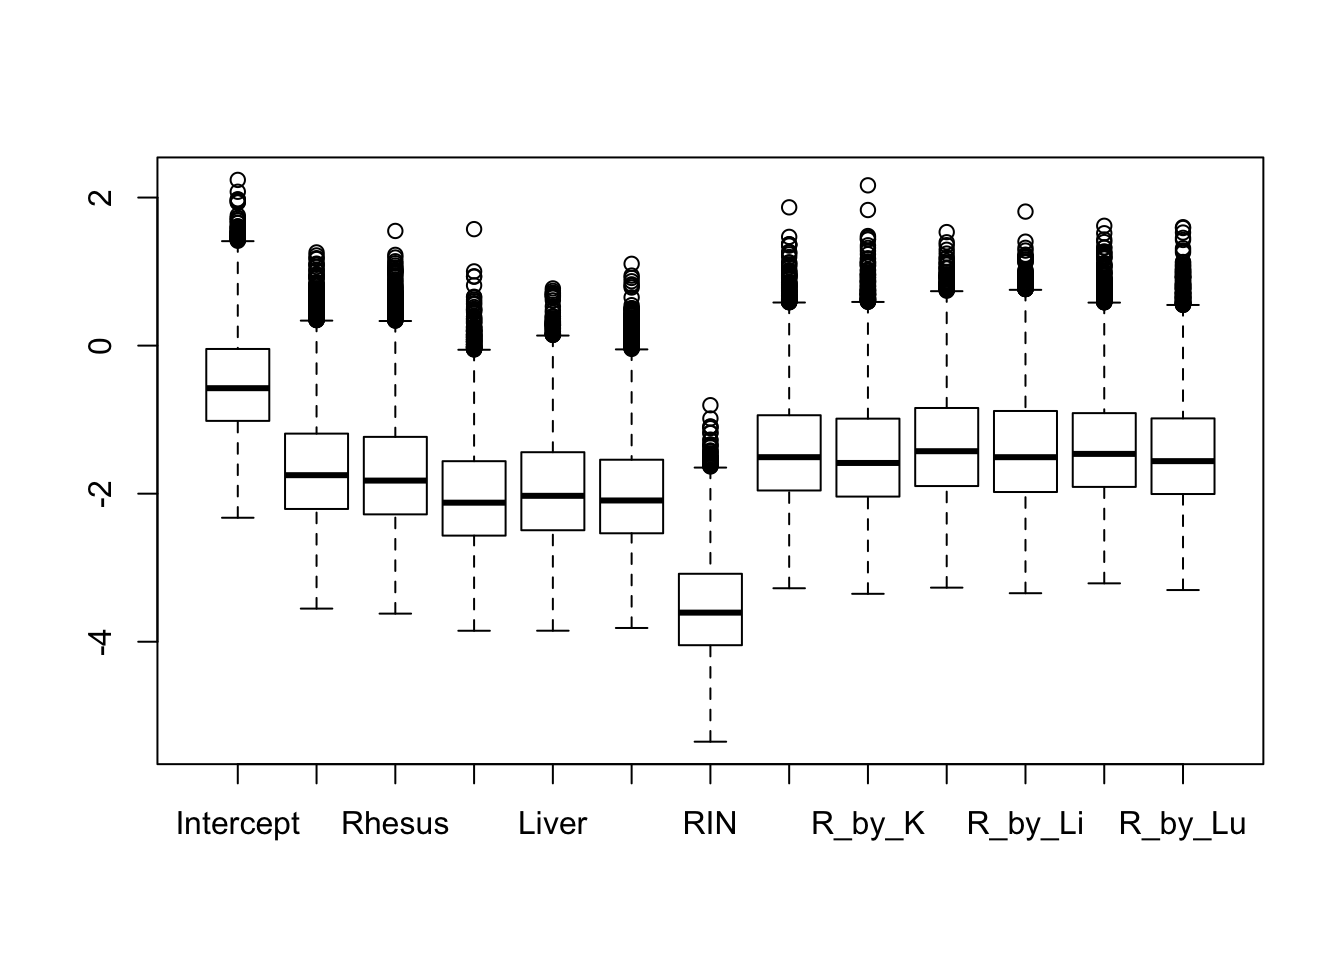
## This seems to be pretty comparable between conditions. The human heart is higher, probably because of H1H missing and H3H with a bit strange behavior
stderror <- log2(fit.cyclic.norm$stdev.unscaled * fit.cyclic.norm$sigma)
boxplot(list(stderror[,1:4], stderror[,5:8], stderror[,9:12]))
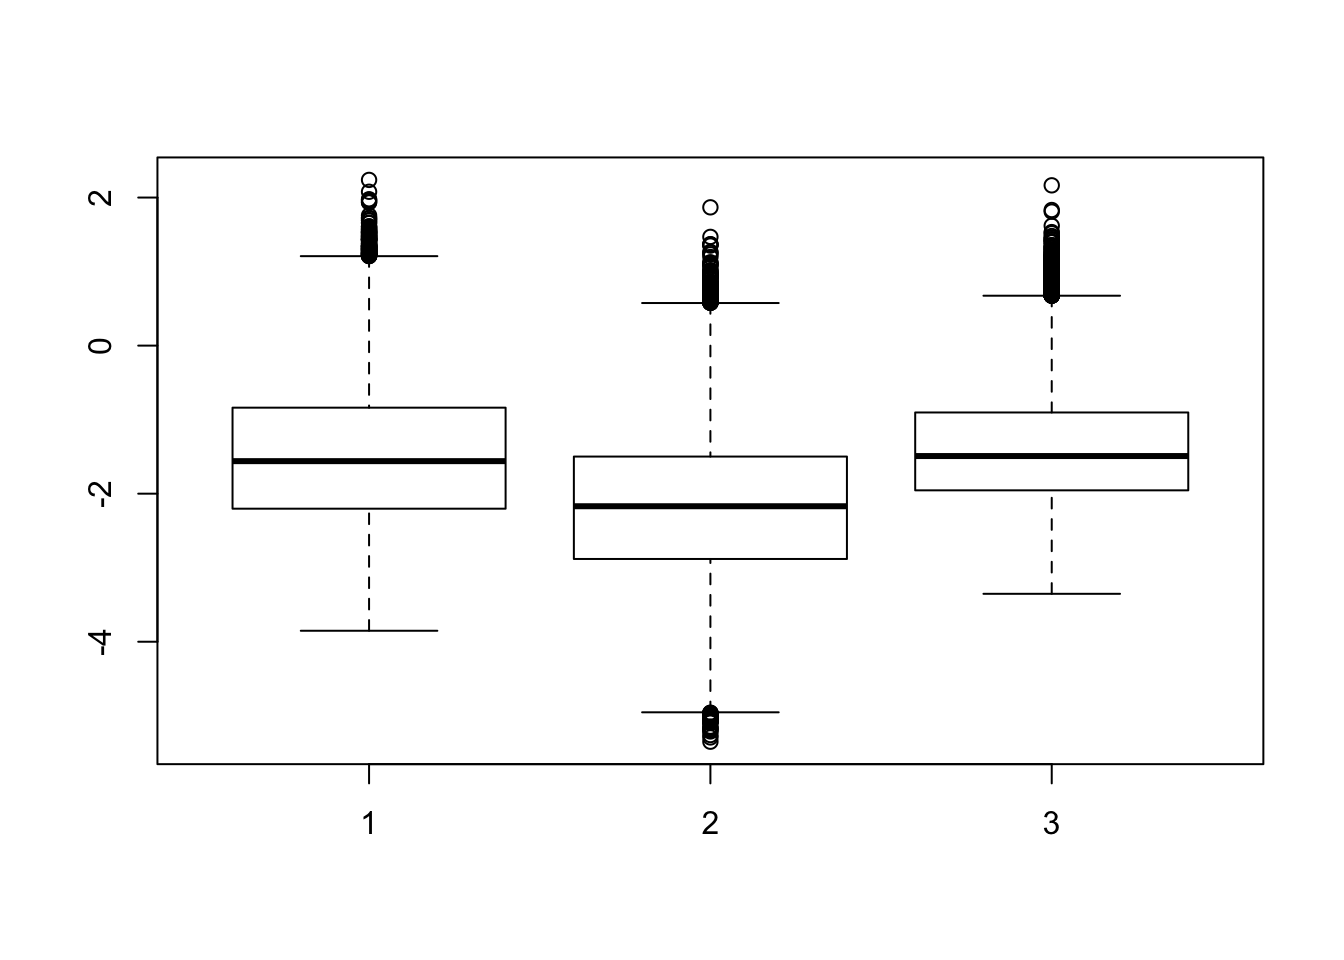
## A bit higher for human, and a bit lower for rhesus
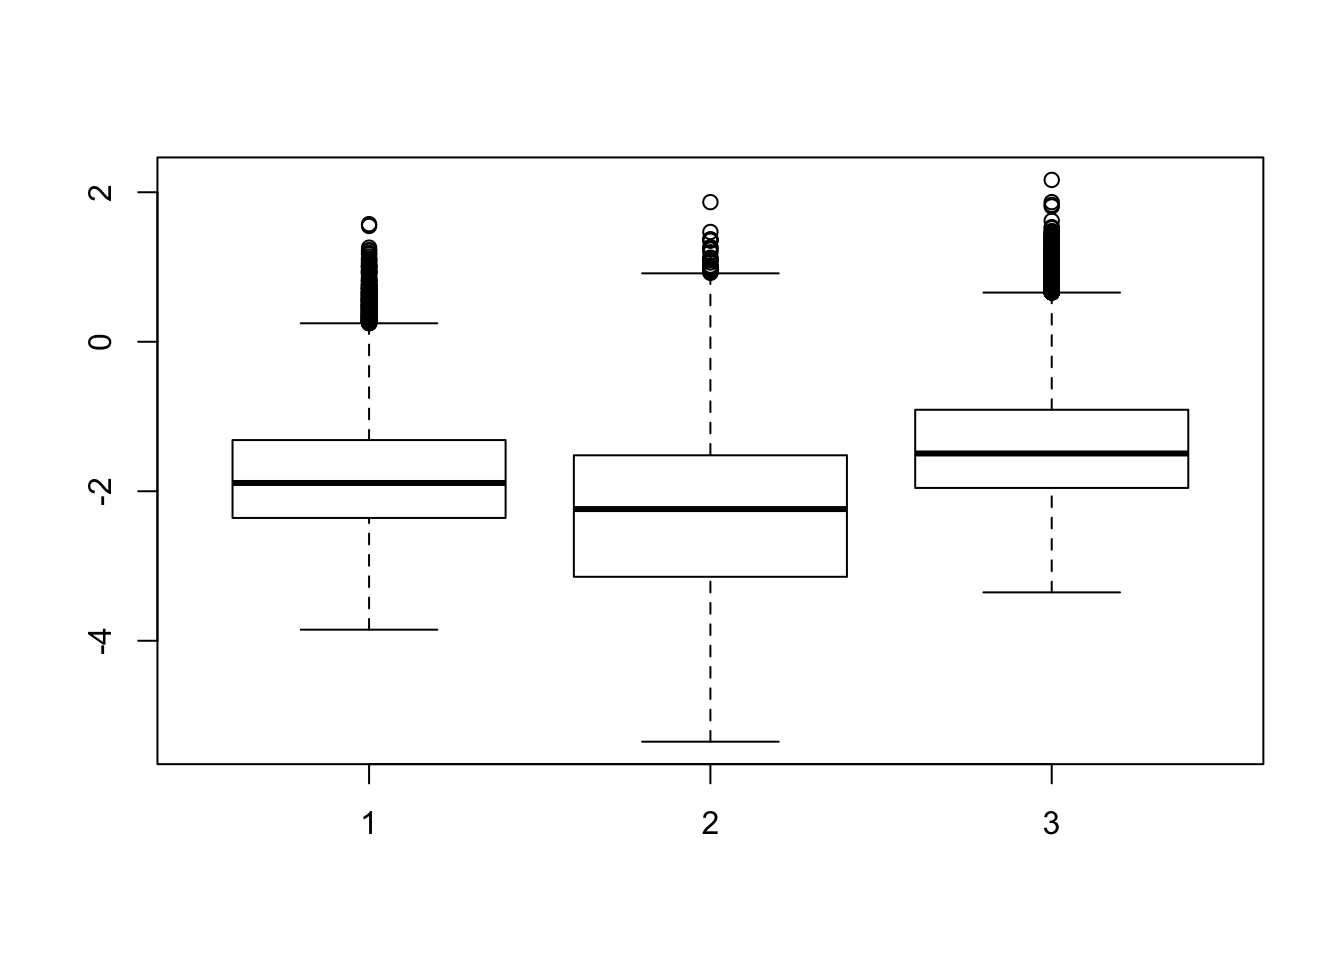
boxplot(list(stderror[,2:4], stderror[,6:8], stderror[,8:12])) ## excluding heart samples
# In the contrast matrix, we have many comparisons for species and tissues individually
# Note: baseline is chimp heart
cm1 <- makeContrasts(H_K_inter_CH = H_by_K,
R_K_inter_CH = R_by_K,
H_Li_inter_CH = H_by_Li,
R_Li_inter_CH = R_by_Li,
H_Lu_inter_CH = H_by_Lu,
R_Lu_inter_CH = R_by_Lu,
levels = design)
# Implement contrasts
contrasts_each_species <- contrasts.fit(fit.cyclic.norm, cm1)
fit1 <- eBayes(contrasts_each_species)
top3 <- list(H_K_inter =topTable(fit1, coef=1, adjust="BH", number=Inf, sort.by="none"),
R_K_inter =topTable(fit1, coef=2, adjust="BH", number=Inf, sort.by="none"),
H_Li_inter =topTable(fit1, coef=3, adjust="BH", number=Inf, sort.by="none"),
R_Li_inter =topTable(fit1, coef=4, adjust="BH", number=Inf, sort.by="none"),
H_Lu_inter =topTable(fit1, coef=5, adjust="BH", number=Inf, sort.by="none"),
R_Lu_inter =topTable(fit1, coef=6, adjust="BH", number=Inf, sort.by="none") )
# Set FDR level at 1%
FDR_level <- 0.01
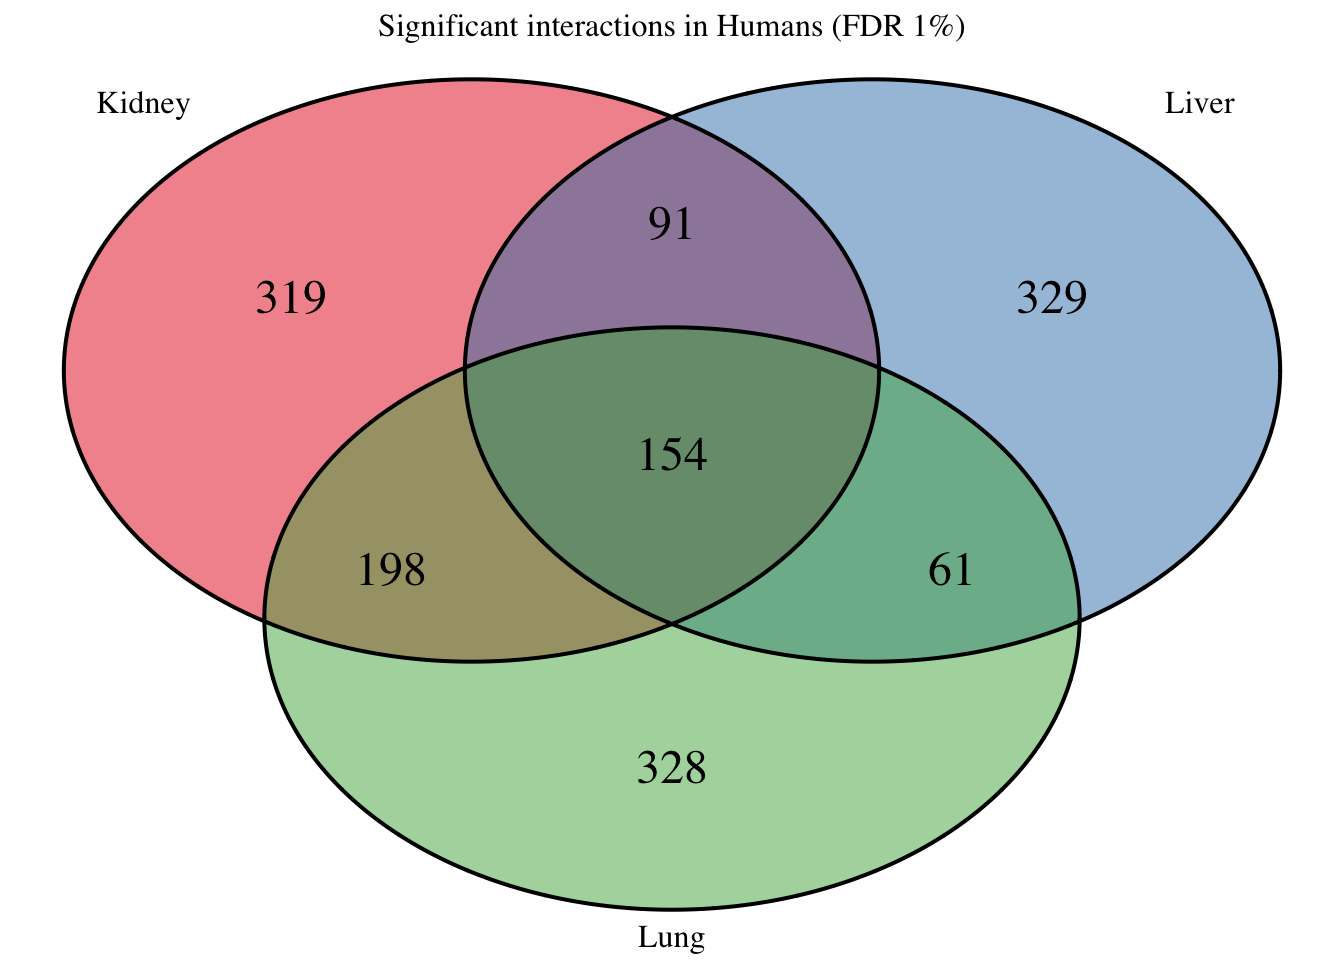
## Significant interactions in Humans (baseline = chimp hearts)
mylist <- list()
mylist[["Kidney"]] <- row.names(top3[[names(top3)[1]]])[top3[[names(top3)[1]]]$adj.P.Val < FDR_level]
mylist[["Liver"]] <- row.names(top3[[names(top3)[3]]])[top3[[names(top3)[3]]]$adj.P.Val < FDR_level]
mylist[["Lung"]] <- row.names(top3[[names(top3)[5]]])[top3[[names(top3)[5]]]$adj.P.Val < FDR_level]
# Make
#dev.off()
Four_comp <- venn.diagram(mylist, filename= NULL, main="Significant interactions in Humans (FDR 1%)", cex=1.5 , fill = pal[1:3], lty=1, height=2000, width=3000)
grid.draw(Four_comp)
## Significant interactions in Rhesus (baseline = chimp hearts)

mylist <- list()
mylist[["Kidney"]] <- row.names(top3[[names(top3)[2]]])[top3[[names(top3)[2]]]$adj.P.Val < FDR_level]
mylist[["Liver"]] <-  row.names(top3[[names(top3)[4]]])[top3[[names(top3)[4]]]$adj.P.Val < FDR_level]
mylist[["Lung"]] <- row.names(top3[[names(top3)[6]]])[top3[[names(top3)[6]]]$adj.P.Val < FDR_level]


# Make
dev.off()
null device
          1
Four_comp <- venn.diagram(mylist, filename= NULL, main="Significant interactions in Rhesus (FDR 1%)", cex=1.5 , fill = pal[1:3], lty=1, height=2000, width=3000)
grid.draw(Four_comp)
# Perform multiple testing correction with adaptive shrinkage (ASH)
 #
 # x - object MArrayLM from eBayes output
 # coef - coefficient tested by eBayes

run_ash <- function(x, coef){
  #stopifnot(class(x) == "MArrayLM", coef %in% colnames(x$coefficients),
  #             length(unique(x$df.total) == 1))
  result <- ash(betahat = x$coefficients[, coef], sebetahat = x$stdev.unscaled[, coef] * sqrt(x$s2.post), df = x$df.total[1])
  return(result)
}

get_results <- function(x, number = nrow(x$coefficients), sort.by = "none",
                        ...) {
  # x - object MArrayLM from eBayes output
  # ... - additional arguments passed to topTable
  stopifnot(class(x) == "MArrayLM")
  results <- topTable(x, number = number, sort.by = sort.by, ...)
  return(results)
}


# Prepare the data for the ASH
tests <- colnames(fit1$coefficients)
results <- vector(length = length(tests), mode = "list")
names(results) <- tests

# Get lfsr, lfdr, s value, q value, and a beta_est value.
for (test in tests) {
  # Extract limma results
  results[[test]] <- get_results(fit1, coef = test)
  # Add mutliple testing correction with ASH
  output_ash <- run_ash(fit1, coef = test)
  results[[test]] <- cbind(results[[test]], sebetahat = output_ash$data$s, lfsr = output_ash$result$lfsr,
                           lfdr = output_ash$result$lfdr, qvalue = output_ash$result$qvalue,
                           svalue = output_ash$result$svalue, beta_est = output_ash$result$PosteriorMean, se_est =
                             output_ash$result$PosteriorSD)
}

# Save results from analysis with limma and ash.
#saveRDS(results, file.path(data_dir, #"results-limma-voom-ash-interactions.rds"))
GO Enrichment for revisions
FDR_level <- 0.05

human_kidney_inter <- top3$H_K_inter
human_liver_inter <- top3$H_Li_inter
human_lung_inter <- top3$H_Lu_inter

rhesus_kidney_inter <- top3$R_K_inter
rhesus_liver_inter <- top3$R_Li_inter
rhesus_lung_inter <- top3$R_Lu_inter

# Find human_kidney specific
human_kidney_only <- human_kidney_inter[which(human_kidney_inter$adj.P.Val < FDR_level & human_liver_inter$adj.P.Val > FDR_level & human_lung_inter$adj.P.Val > FDR_level & rhesus_kidney_inter$adj.P.Val > FDR_level & rhesus_liver_inter$adj.P.Val > FDR_level & rhesus_lung_inter$adj.P.Val > FDR_level), 1]

human_kidney_inter_only <- human_kidney_inter$genes %in% human_kidney_only
Human liver
# Find human_kidney specific
human_liver_only <- human_liver_inter[which(human_kidney_inter$adj.P.Val > FDR_level & human_liver_inter$adj.P.Val < FDR_level & human_lung_inter$adj.P.Val > FDR_level & rhesus_kidney_inter$adj.P.Val > FDR_level & rhesus_liver_inter$adj.P.Val > FDR_level & rhesus_lung_inter$adj.P.Val > FDR_level), 1]

human_liver_inter_only <- human_liver_inter$genes %in% human_liver_only

# Revisions- run GO
# Merge ENSG with true/false

test_gene <- as.numeric(as.vector(human_liver_inter_only))
names(test_gene) <- human_liver_inter$genes


# Run topGO
go_data <- new("topGOdata",
                   ontology = "BP",
                   allGenes = test_gene,
                    geneSel = function(allScore){
    return(allScore > 0)
},
                   nodeSize = 5,
                   annotationFun = annFUN.org,
                   mapping = "org.Hs.eg.db",
                   ID = "ensembl")
Building most specific GOs .....
( 10269 GO terms found. )
Build GO DAG topology ..........
( 14352 GO terms and 33417 relations. )
Annotating nodes ...............
( 10194 genes annotated to the GO terms. )
# Perform enrichment test
go_test <- runTest(go_data, algorithm = "weight01", statistic = "fisher")
             -- Weight01 Algorithm --

         the algorithm is scoring 3382 nontrivial nodes
         parameters:
             test statistic: fisher
Level 16: 8 nodes to be scored (0 eliminated genes)
Level 15: 16 nodes to be scored (0 eliminated genes)
Level 14: 45 nodes to be scored (139 eliminated genes)
Level 13: 92 nodes to be scored (333 eliminated genes)
Level 12: 134 nodes to be scored (991 eliminated genes)
Level 11: 234 nodes to be scored (2674 eliminated genes)
Level 10: 334 nodes to be scored (3782 eliminated genes)
Level 9: 421 nodes to be scored (5340 eliminated genes)
Level 8: 469 nodes to be scored (6621 eliminated genes)
Level 7: 537 nodes to be scored (7870 eliminated genes)
Level 6: 477 nodes to be scored (8820 eliminated genes)
Level 5: 331 nodes to be scored (9344 eliminated genes)
Level 4: 180 nodes to be scored (9691 eliminated genes)
Level 3: 83 nodes to be scored (9882 eliminated genes)
Level 2: 20 nodes to be scored (9976 eliminated genes)
Level 1: 1 nodes to be scored (10067 eliminated genes)
go_table <- GenTable(go_data, weightFisher = go_test,
                         orderBy = "weightFisher", ranksOf = "weightFisher",
                         topNodes = sum(score(go_test) < .01))

go_table
        GO.ID                                        Term Annotated
1  GO:0019388                 galactose catabolic process         7
2  GO:0007281                       germ cell development       116
3  GO:0005978               glycogen biosynthetic process        30
4  GO:0000185               activation of MAPKKK activity        15
5  GO:0090382                        phagosome maturation        30
6  GO:0031659 positive regulation of cyclin-dependent ...         5
7  GO:0051896    regulation of protein kinase B signaling       130
8  GO:0072655 establishment of protein localization to...       142
9  GO:0002480 antigen processing and presentation of e...         6
10 GO:0002138          retinoic acid biosynthetic process         6
11 GO:0019919 peptidyl-arginine methylation, to asymme...         6
12 GO:0060050 positive regulation of protein glycosyla...         7
13 GO:0035646            endosome to melanosome transport         7
   Significant Expected weightFisher
1            3     0.15      0.00029
2            7     2.41      0.00081
3            4     0.62      0.00216
4            3     0.31      0.00335
5            4     0.62      0.00407
6            2     0.10      0.00413
7            5     2.70      0.00609
8            5     2.95      0.00610
9            2     0.12      0.00611
10           2     0.12      0.00611
11           2     0.12      0.00611
12           2     0.15      0.00844
13           2     0.15      0.00844
# Get names of liver genes
sig.genes <- sigGenes(go_data)
goresults <- sapply(go_table$GO.ID, function(x)
    {
      genes<-genesInTerm(go_data, x)
      genes[[1]][genes[[1]] %in% sig.genes]
    })

goresults["GO:0005978"]
$`GO:0005978`
[1] "ENSG00000079739" "ENSG00000114480" "ENSG00000132326" "ENSG00000142208"
# Gene to ID conversion document

gene_id <- read.table("../../../Reg_Evo_Primates/data/ENSG_GENE_HG19.csv", stringsAsFactors = FALSE, header=TRUE, sep = ",")

human_liver_only_data <- as.data.frame(c("ENSG00000079739", "ENSG00000114480", "ENSG00000132326", "ENSG00000142208"))
colnames(human_liver_only_data) <- c("ensg")

# Get gene names of the background
comb_liver <- merge(human_liver_only_data, gene_id, by = c("ensg"))

# glycogen biosynthetic proces

comb_liver
             ensg Gene
1 ENSG00000079739 PGM1
2 ENSG00000114480 GBE1
3 ENSG00000132326 PER2
4 ENSG00000142208 AKT1
Human lung
# Find human_kidney specific
human_lung_only <- human_lung_inter[which(human_lung_inter$adj.P.Val < FDR_level & human_liver_inter$adj.P.Val > FDR_level & human_kidney_inter$adj.P.Val > FDR_level & rhesus_kidney_inter$adj.P.Val > FDR_level & rhesus_liver_inter$adj.P.Val > FDR_level & rhesus_lung_inter$adj.P.Val > FDR_level), 1]

human_lung_inter_only <- human_lung_inter$genes %in% human_lung_only

# Revisions- run GO
# Merge ENSG with true/false

test_gene <- as.numeric(as.vector(human_lung_inter_only))
names(test_gene) <- human_lung_inter$genes


# Run topGO
go_data <- new("topGOdata",
                   ontology = "BP",
                   allGenes = test_gene,
                    geneSel = function(allScore){
    return(allScore > 0)
},
                   nodeSize = 5,
                   annotationFun = annFUN.org,
                   mapping = "org.Hs.eg.db",
                   ID = "ensembl")
Building most specific GOs .....
( 10269 GO terms found. )
Build GO DAG topology ..........
( 14352 GO terms and 33417 relations. )
Annotating nodes ...............
( 10194 genes annotated to the GO terms. )
# Perform enrichment test
go_test <- runTest(go_data, algorithm = "weight01", statistic = "fisher")
             -- Weight01 Algorithm --

         the algorithm is scoring 4276 nontrivial nodes
         parameters:
             test statistic: fisher
Level 19: 1 nodes to be scored (0 eliminated genes)
Level 18: 3 nodes to be scored (0 eliminated genes)
Level 17: 7 nodes to be scored (17 eliminated genes)
Level 16: 7 nodes to be scored (28 eliminated genes)
Level 15: 28 nodes to be scored (54 eliminated genes)
Level 14: 70 nodes to be scored (90 eliminated genes)
Level 13: 123 nodes to be scored (472 eliminated genes)
Level 12: 203 nodes to be scored (1323 eliminated genes)
Level 11: 325 nodes to be scored (2905 eliminated genes)
Level 10: 461 nodes to be scored (4120 eliminated genes)
Level 9: 561 nodes to be scored (5501 eliminated genes)
Level 8: 596 nodes to be scored (6960 eliminated genes)
Level 7: 635 nodes to be scored (8013 eliminated genes)
Level 6: 566 nodes to be scored (8914 eliminated genes)
Level 5: 370 nodes to be scored (9398 eliminated genes)
Level 4: 210 nodes to be scored (9707 eliminated genes)
Level 3: 89 nodes to be scored (9896 eliminated genes)
Level 2: 20 nodes to be scored (9976 eliminated genes)
Level 1: 1 nodes to be scored (10068 eliminated genes)
go_table <- GenTable(go_data, weightFisher = go_test,
                         orderBy = "weightFisher", ranksOf = "weightFisher",
                         topNodes = sum(score(go_test) < .01))

go_table
        GO.ID                                        Term Annotated
1  GO:0006919 activation of cysteine-type endopeptidas...        62
2  GO:0032736 positive regulation of interleukin-13 pr...         9
3  GO:0031053                    primary miRNA processing         9
4  GO:0002726 positive regulation of T cell cytokine p...        10
5  GO:0006325                      chromatin organization       522
6  GO:0032753 positive regulation of interleukin-4 pro...        11
7  GO:0007183               SMAD protein complex assembly        11
8  GO:0001657                    ureteric bud development        61
9  GO:0034380 high-density lipoprotein particle assemb...        13
10 GO:0030878                   thyroid gland development        13
11 GO:0009615                           response to virus       206
12 GO:0035019    somatic stem cell population maintenance        43
13 GO:0044782                         cilium organization       262
14 GO:0051098                       regulation of binding       256
15 GO:0003161       cardiac conduction system development         5
16 GO:0051534 negative regulation of NFAT protein impo...         5
17 GO:0038092                     nodal signaling pathway         5
18 GO:0035745         T-helper 2 cell cytokine production         5
19 GO:0048340             paraxial mesoderm morphogenesis         5
20 GO:0045494              photoreceptor cell maintenance        16
21 GO:2000810 regulation of bicellular tight junction ...        16
22 GO:0045599 negative regulation of fat cell differen...        30
23 GO:0022008                                neurogenesis       922
   Significant Expected weightFisher
1            8     1.74      0.00072
2            3     0.25      0.00162
3            3     0.25      0.00162
4            3     0.28      0.00227
5           23    14.65      0.00287
6            3     0.31      0.00305
7            3     0.31      0.00305
8            5     1.71      0.00482
9            3     0.36      0.00507
10           3     0.36      0.00507
11          11     5.78      0.00598
12           5     1.21      0.00675
13          12     7.35      0.00727
14          11     7.18      0.00731
15           2     0.14      0.00742
16           2     0.14      0.00742
17           2     0.14      0.00742
18           2     0.14      0.00742
19           2     0.14      0.00742
20           3     0.45      0.00933
21           3     0.45      0.00933
22           4     0.84      0.00936
23          27    25.87      0.00946
sig.genes <- sigGenes(go_data)

goresults["GO:0048340"]
$<NA>
NULL
goresults["GO:0032736"]
$<NA>
NULL
goresults["GO:0032753"]
$<NA>
NULL
# Gene to ID conversion document

#gene_id <- read.table("../../../Reg_Evo_Primates/data/ENSG_GENE_HG19.csv", stringsAsFactors = FALSE, header=TRUE, sep = ",")

#human_lung_only_data <- as.data.frame(c("ENSG00000105698", "ENSG00000131165"))
#colnames(human_liver_only_data) <- c("ensg")

# Get gene names of the background
#comb_lung <- merge(human_lung_only_data, gene_id, by = c("ensg"))

#positive regulation of lipoprotein lipas...

#comb_lung
Human kidney
# Find human_kidney specific
human_kidney_only <- human_kidney_inter[which(human_kidney_inter$adj.P.Val < FDR_level & human_liver_inter$adj.P.Val > FDR_level & human_lung_inter$adj.P.Val > FDR_level & rhesus_kidney_inter$adj.P.Val > FDR_level & rhesus_liver_inter$adj.P.Val > FDR_level & rhesus_lung_inter$adj.P.Val > FDR_level), 1]

human_kidney_inter_only <- human_kidney_inter$genes %in% human_kidney_only

# Revisions- run GO
# Merge ENSG with true/false

test_gene <- as.numeric(as.vector(human_kidney_inter_only))
names(test_gene) <- human_kidney_inter$genes


# Run topGO
go_data <- new("topGOdata",
                   ontology = "BP",
                   allGenes = test_gene,
                    geneSel = function(allScore){
    return(allScore > 0)
},
                   nodeSize = 5,
                   annotationFun = annFUN.org,
                   mapping = "org.Hs.eg.db",
                   ID = "ensembl")
Building most specific GOs .....
( 10269 GO terms found. )
Build GO DAG topology ..........
( 14352 GO terms and 33417 relations. )
Annotating nodes ...............
( 10194 genes annotated to the GO terms. )
# Perform enrichment test
go_test <- runTest(go_data, algorithm = "weight01", statistic = "fisher")
             -- Weight01 Algorithm --

         the algorithm is scoring 3511 nontrivial nodes
         parameters:
             test statistic: fisher
Level 19: 1 nodes to be scored (0 eliminated genes)
Level 18: 1 nodes to be scored (0 eliminated genes)
Level 17: 1 nodes to be scored (17 eliminated genes)
Level 16: 5 nodes to be scored (21 eliminated genes)
Level 15: 27 nodes to be scored (21 eliminated genes)
Level 14: 49 nodes to be scored (80 eliminated genes)
Level 13: 86 nodes to be scored (448 eliminated genes)
Level 12: 141 nodes to be scored (1110 eliminated genes)
Level 11: 226 nodes to be scored (2671 eliminated genes)
Level 10: 344 nodes to be scored (3832 eliminated genes)
Level 9: 435 nodes to be scored (5359 eliminated genes)
Level 8: 483 nodes to be scored (6858 eliminated genes)
Level 7: 559 nodes to be scored (7896 eliminated genes)
Level 6: 505 nodes to be scored (8843 eliminated genes)
Level 5: 349 nodes to be scored (9391 eliminated genes)
Level 4: 192 nodes to be scored (9696 eliminated genes)
Level 3: 87 nodes to be scored (9877 eliminated genes)
Level 2: 19 nodes to be scored (9973 eliminated genes)
Level 1: 1 nodes to be scored (10068 eliminated genes)
go_table <- GenTable(go_data, weightFisher = go_test,
                         orderBy = "weightFisher", ranksOf = "weightFisher",
                         topNodes = sum(score(go_test) < .01))

go_table
        GO.ID                                        Term Annotated
1  GO:0051451                          myoblast migration         8
2  GO:0045833 negative regulation of lipid metabolic p...        57
3  GO:0001975                     response to amphetamine        12
4  GO:0098719    sodium ion import across plasma membrane         5
5  GO:0043697                      cell dedifferentiation         5
6  GO:0019323                   pentose catabolic process         5
7  GO:0030091                              protein repair         5
8  GO:2000035            regulation of stem cell division         6
9  GO:0032494                   response to peptidoglycan         6
10 GO:1900125 regulation of hyaluronan biosynthetic pr...         6
11 GO:0031115 negative regulation of microtubule polym...         6
12 GO:0060088 auditory receptor cell stereocilium orga...         7
13 GO:2000402 negative regulation of lymphocyte migrat...         7
14 GO:1901223 negative regulation of NIK/NF-kappaB sig...         7
15 GO:0051272 positive regulation of cellular componen...       325
16 GO:0007141                              male meiosis I         8
17 GO:0071447          cellular response to hydroperoxide         8
18 GO:0090280 positive regulation of calcium ion impor...         8
   Significant Expected weightFisher
1            3     0.15      0.00037
2            5     1.10      0.00108
3            3     0.23      0.00137
4            2     0.10      0.00358
5            2     0.10      0.00358
6            2     0.10      0.00358
7            2     0.10      0.00358
8            2     0.12      0.00530
9            2     0.12      0.00530
10           2     0.12      0.00530
11           2     0.12      0.00530
12           2     0.14      0.00732
13           2     0.14      0.00732
14           2     0.14      0.00732
15          10     6.28      0.00945
16           2     0.15      0.00964
17           2     0.15      0.00964
18           2     0.15      0.00964
# Get names of kidney genes
sig.genes <- sigGenes(go_data)
goresults <- sapply(go_table$GO.ID, function(x)
    {
      genes<-genesInTerm(go_data, x)
      genes[[1]][genes[[1]] %in% sig.genes]
    })

goresults["GO:0098719"]
$`GO:0098719`
[1] "ENSG00000066230" "ENSG00000130529"
# Gene to ID conversion document

#gene_id <- read.table("../../../Reg_Evo_Primates/data/ENSG_GENE_HG19.csv", stringsAsFactors = FALSE, header=TRUE, sep = ",")

#human_kidney_only_data <- as.data.frame(c("ENSG00000138031", "ENSG00000142875", "ENSG00000173175"))
#colnames(human_kidney_only_data) <- c("ensg")

# Get gene names of the background
#comb_kidney <- merge(human_kidney_only_data, gene_id, by = c("ensg"))

# renal water homeostasis

#comb_kidney