genotypes
Lauren Blake
2018-08-14
Last updated: 2018-08-28
workflowr checks: (Click a bullet for more information)-
✖ R Markdown file: uncommitted changes
The R Markdown is untracked by Git. To know which version of the R Markdown file created these results, you’ll want to first commit it to the Git repo. If you’re still working on the analysis, you can ignore this warning. When you’re finished, you can runwflow_publishto commit the R Markdown file and build the HTML. -
✔ Environment: empty
Great job! The global environment was empty. Objects defined in the global environment can affect the analysis in your R Markdown file in unknown ways. For reproduciblity it’s best to always run the code in an empty environment.
-
✔ Seed:
set.seed(12345)The command
set.seed(12345)was run prior to running the code in the R Markdown file. Setting a seed ensures that any results that rely on randomness, e.g. subsampling or permutations, are reproducible. -
✔ Session information: recorded
Great job! Recording the operating system, R version, and package versions is critical for reproducibility.
-
Great! You are using Git for version control. Tracking code development and connecting the code version to the results is critical for reproducibility. The version displayed above was the version of the Git repository at the time these results were generated.✔ Repository version: 241c630
Note that you need to be careful to ensure that all relevant files for the analysis have been committed to Git prior to generating the results (you can usewflow_publishorwflow_git_commit). workflowr only checks the R Markdown file, but you know if there are other scripts or data files that it depends on. Below is the status of the Git repository when the results were generated:
Note that any generated files, e.g. HTML, png, CSS, etc., are not included in this status report because it is ok for generated content to have uncommitted changes.Ignored files: Ignored: .DS_Store Ignored: analysis/.DS_Store Ignored: analysis/figure/ Ignored: data/.DS_Store Ignored: data/aux_info/ Ignored: data/hg_38/ Ignored: data/libParams/ Ignored: output/.DS_Store Untracked files: Untracked: _workflowr.yml Untracked: analysis/Collection_dates.Rmd Untracked: analysis/Converting_IDs.Rmd Untracked: analysis/Global_variation.Rmd Untracked: analysis/Preliminary_clinical_covariate.Rmd Untracked: analysis/VennDiagram2018-07-24_06-55-46.log Untracked: analysis/VennDiagram2018-07-24_06-56-13.log Untracked: analysis/VennDiagram2018-07-24_06-56-50.log Untracked: analysis/VennDiagram2018-07-24_06-58-41.log Untracked: analysis/VennDiagram2018-07-24_07-00-07.log Untracked: analysis/VennDiagram2018-07-24_07-00-42.log Untracked: analysis/VennDiagram2018-07-24_07-01-08.log Untracked: analysis/VennDiagram2018-08-17_15-13-24.log Untracked: analysis/VennDiagram2018-08-17_15-13-30.log Untracked: analysis/VennDiagram2018-08-17_15-15-06.log Untracked: analysis/VennDiagram2018-08-17_15-16-01.log Untracked: analysis/VennDiagram2018-08-17_15-17-51.log Untracked: analysis/VennDiagram2018-08-17_15-18-42.log Untracked: analysis/VennDiagram2018-08-17_15-19-21.log Untracked: analysis/VennDiagram2018-08-20_09-07-57.log Untracked: analysis/VennDiagram2018-08-20_09-08-37.log Untracked: analysis/VennDiagram2018-08-26_19-54-03.log Untracked: analysis/VennDiagram2018-08-26_20-47-08.log Untracked: analysis/VennDiagram2018-08-26_20-49-49.log Untracked: analysis/VennDiagram2018-08-27_00-04-36.log Untracked: analysis/VennDiagram2018-08-27_00-09-27.log Untracked: analysis/VennDiagram2018-08-27_00-13-57.log Untracked: analysis/VennDiagram2018-08-27_00-16-32.log Untracked: analysis/VennDiagram2018-08-27_10-00-25.log Untracked: analysis/VennDiagram2018-08-28_06-03-13.log Untracked: analysis/VennDiagram2018-08-28_06-03-14.log Untracked: analysis/VennDiagram2018-08-28_06-05-50.log Untracked: analysis/VennDiagram2018-08-28_06-06-58.log Untracked: analysis/VennDiagram2018-08-28_06-10-12.log Untracked: analysis/VennDiagram2018-08-28_06-10-13.log Untracked: analysis/VennDiagram2018-08-28_06-18-29.log Untracked: analysis/background_dds_david.csv Untracked: analysis/correlations_bet_covariates.Rmd Untracked: analysis/correlations_over_time.Rmd Untracked: analysis/genocode_annotation_info.Rmd Untracked: analysis/genotypes.Rmd Untracked: analysis/import_transcript_level_estimates.Rmd Untracked: analysis/test_dds_david.csv Untracked: analysis/tximport.Rmd Untracked: analysis/unnormalized_data.Rmd Untracked: analysis/variables_by_time.Rmd Untracked: analysis/voom_limma.Rmd Untracked: analysis/voom_limma_weight_change.Rmd Untracked: data/BAN2 Dates_T1_T2.xlsx Untracked: data/BAN_DATES.csv Untracked: data/BAN_DATES.xlsx Untracked: data/BAN_DATES_txt.csv Untracked: data/Ban_geno.csv Untracked: data/Ban_geno.xlsx Untracked: data/Blood_dates.txt Untracked: data/DAVID_background.txt Untracked: data/DAVID_list_T1T2.txt Untracked: data/DAVID_list_T1T2_weight.txt Untracked: data/DAVID_list_T2T3.txt Untracked: data/DAVID_list_T2T3_weight.txt Untracked: data/DAVID_results/ Untracked: data/DAVID_top100_list_T1T2.txt Untracked: data/DAVID_top100_list_T1T2_weight.txt Untracked: data/DAVID_top100_list_T2T3.txt Untracked: data/DAVID_top100_list_T2T3_weight.txt Untracked: data/Eigengenes/ Untracked: data/FemaleWeightRestoration-01-dataInput.RData Untracked: data/FemaleWeightRestoration-resid-01-dataInput.RData Untracked: data/FemaleWeightRestoration-resid-T1T2-01-dataInput.RData Untracked: data/HTSF_IDs.sav Untracked: data/Homo_sapiens.GRCh38.v22_table.txt Untracked: data/Labels.csv Untracked: data/Labels.xlsx Untracked: data/RIN.xlsx Untracked: data/RIN_over_time.csv Untracked: data/RIN_over_time.xlsx Untracked: data/T0_consolid.csv Untracked: data/T0_consolid.xlsx Untracked: data/age_t1.txt Untracked: data/birthday_age.csv Untracked: data/birthday_age.xlsx Untracked: data/clinical_sample_info_geno.csv Untracked: data/cmd_info.json Untracked: data/counts_hg38_gc.RData Untracked: data/counts_hg38_gc_dds.RData Untracked: data/counts_hg38_gc_txsalmon.RData Untracked: data/covar_lm.csv Untracked: data/covar_lm_missing.csv Untracked: data/eigengenes_T1_T2_cov_adj_exp_5_modules.txt Untracked: data/eigengenes_T1_T2_module_background.txt Untracked: data/eigengenes_adj_exp_7_modules.txt Untracked: data/eigengenes_cov_adj_exp_14_modules.txt Untracked: data/eigengenes_module_background.txt Untracked: data/eigengenes_unadj_exp_10_modules.txt Untracked: data/eigengenes_unadj_exp_6_modules.txt Untracked: data/eigengenes_unadj_exp_9_modules.txt Untracked: data/files_list.txt Untracked: data/final_covariates.csv Untracked: data/gene_exp_values_2202.txt Untracked: data/gene_exp_values_2209.txt Untracked: data/gene_exp_values_2218.txt Untracked: data/gene_exp_values_2220.txt Untracked: data/gene_exp_values_2226.txt Untracked: data/gene_exp_values_2228.txt Untracked: data/gene_expression_filtered_T1T5.csv Untracked: data/gene_names_58387.txt Untracked: data/gene_to_tran.txt Untracked: data/lm_covar_fixed_random.csv Untracked: data/lm_covar_fixed_random_geno.csv Untracked: data/logs/ Untracked: data/module_T1T2_cov_adj_blue.txt Untracked: data/module_T1T2_cov_adj_brown.txt Untracked: data/module_T1T2_cov_adj_turquoise.txt Untracked: data/module_T1T2_cov_adj_yellow.txt Untracked: data/module_adj_cov_merged_blue.txt Untracked: data/module_adj_cov_merged_brown.txt Untracked: data/module_adj_cov_merged_cyan.txt Untracked: data/module_adj_cov_merged_green.txt Untracked: data/module_adj_cov_merged_greenyellow.txt Untracked: data/module_adj_cov_merged_magenta.txt Untracked: data/module_adj_cov_merged_red.txt Untracked: data/module_adj_cov_merged_salmon.txt Untracked: data/module_adj_cov_merged_tan.txt Untracked: data/module_adj_cov_merged_yellow.txt Untracked: data/module_black.txt Untracked: data/module_blue.txt Untracked: data/module_brown.txt Untracked: data/module_cov_adj_black.txt Untracked: data/module_cov_adj_blue.txt Untracked: data/module_cov_adj_brown.txt Untracked: data/module_cov_adj_cyan.txt Untracked: data/module_cov_adj_green.txt Untracked: data/module_cov_adj_greenyellow.txt Untracked: data/module_cov_adj_magenta.txt Untracked: data/module_cov_adj_pink.txt Untracked: data/module_cov_adj_purple.txt Untracked: data/module_cov_adj_red.txt Untracked: data/module_cov_adj_salmon.txt Untracked: data/module_cov_adj_tan.txt Untracked: data/module_cov_adj_turquoise.txt Untracked: data/module_cov_adj_yellow.txt Untracked: data/module_cyan.txt Untracked: data/module_green.txt Untracked: data/module_greenyellow.txt Untracked: data/module_magenta.txt Untracked: data/module_merged_black.txt Untracked: data/module_merged_blue.txt Untracked: data/module_merged_brown.txt Untracked: data/module_merged_cyan.txt Untracked: data/module_merged_green.txt Untracked: data/module_merged_greenyellow.txt Untracked: data/module_merged_magenta.txt Untracked: data/module_merged_pink.txt Untracked: data/module_merged_purple.txt Untracked: data/module_merged_red.txt Untracked: data/module_merged_salmon.txt Untracked: data/module_merged_tan.txt Untracked: data/module_merged_turquoise.txt Untracked: data/module_merged_yellow.txt Untracked: data/module_pink.txt Untracked: data/module_purple.txt Untracked: data/module_red.txt Untracked: data/module_salmon.txt Untracked: data/module_tan.txt Untracked: data/module_turquoise.txt Untracked: data/module_yellow.txt Untracked: data/notimecovariates.csv Untracked: data/only_individuals_biomarkers_weight_restoration_study.xlsx Untracked: data/pcs_genes.csv Untracked: data/pcs_genes.txt Untracked: data/rest1t2_BI_hg37.rds Untracked: data/rest1t2_BI_hg38.rds Untracked: data/rest1t2_hg37.rds Untracked: data/rest1t2_psych_meds_BMI_hg37.rds Untracked: data/rest1t2_psych_meds_hg37.rds Untracked: data/rest2t3_BI_hg37.rds Untracked: data/rest2t3_BI_hg38.rds Untracked: data/rest2t3_hg37.rds Untracked: data/rest2t3_psych_meds_BMI_hg37.rds Untracked: data/rest2t3_psych_meds_hg37.rds Untracked: data/salmon_gene_matrix_bak_reorder_time.txt Untracked: data/technical_sample_info.csv Untracked: data/tx_to_gene.txt Untracked: data/tx_to_gene_37.txt Untracked: data/usa2.pcawithref.menv.mds_cov Untracked: data/~$Labels.xlsx Untracked: data/~$T0_consolid.xlsx Untracked: docs/VennDiagram2018-07-24_06-55-46.log Untracked: docs/VennDiagram2018-07-24_06-56-13.log Untracked: docs/VennDiagram2018-07-24_06-56-50.log Untracked: docs/VennDiagram2018-07-24_06-58-41.log Untracked: docs/VennDiagram2018-07-24_07-00-07.log Untracked: docs/VennDiagram2018-07-24_07-00-42.log Untracked: docs/VennDiagram2018-07-24_07-01-08.log Untracked: docs/figure/ Unstaged changes: Modified: analysis/_site.yml Modified: analysis/about.Rmd Deleted: analysis/chunks.R Modified: analysis/index.Rmd Modified: analysis/license.Rmd
Introduction
The goal of this script is to analyze the genotypes of the individuals in the
# Load library

library(ggplot2)
Warning: package 'ggplot2' was built under R version 3.4.4library(cowplot)Warning: package 'cowplot' was built under R version 3.4.4
Attaching package: 'cowplot'The following object is masked from 'package:ggplot2':
ggsave# Load the PC genotype data
usa2.pcawithref.menv <- read.table("../data/usa2.pcawithref.menv.mds_cov", stringsAsFactors = FALSE, header = TRUE)
# Reformat cells
test <- t(unlist(strsplit(as.character(usa2.pcawithref.menv[1,]), " ")))
reformat_array <- array(NA, dim = c(nrow(usa2.pcawithref.menv),28))
for (i in 1:nrow(usa2.pcawithref.menv)){
reformat_array[i,] <- t(unlist(strsplit(as.character(usa2.pcawithref.menv[i,]), " ")))
}
colnames(reformat_array) <- c("FID", "IID", "SOL", "C1", "C2", "C3", "C4", "C5", "C6", "C7", "C8", "C9", "C10", "C11", "C12", "C13", "C14", "C15", "C16", "C17", "C18", "C19", "C20", "st1", "st2", "st3", "st4", "st5")
reformat_array <- as.data.frame(reformat_array, stringsAsFactors = FALSE)
# BAN to genotype ids
Ban_geno <- read.csv("../data/Ban_geno.csv")
Ban_geno <- Ban_geno[,1:3]
link <- merge(reformat_array, Ban_geno, by.x = c("IID"), by.y = c("External_code"))Genotype PCs
# Initial plot
plot(link$C1, link$C2)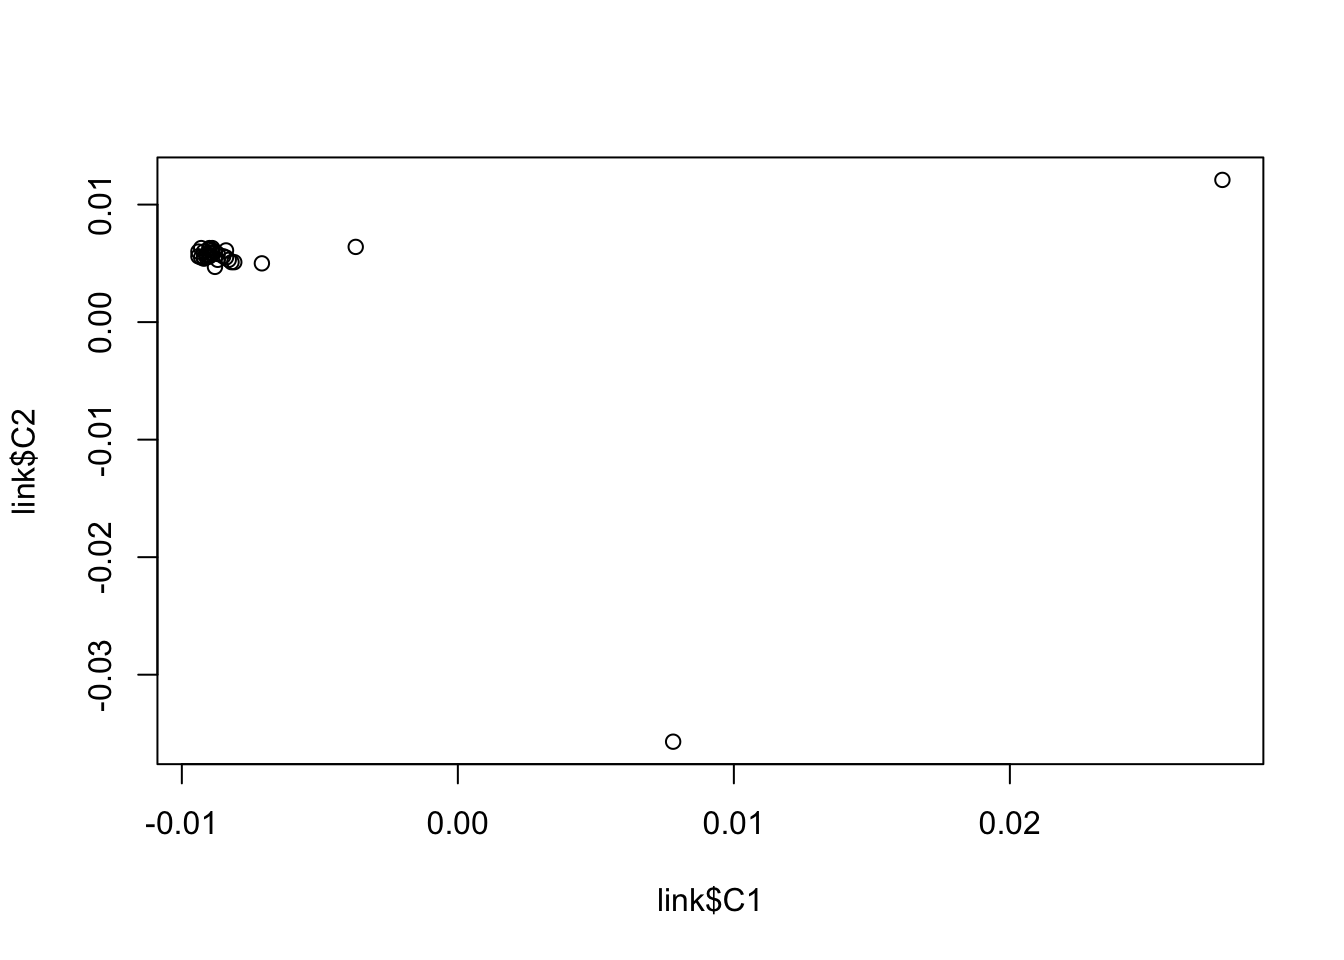
# Reorder by BAN_ID

order_link <- link[order(link$BAN_ID),]

# Integrate with race/ethnicity

clinical_info <- read.csv("../data/clinical_sample_info_geno.csv")

race_eth <- cbind(clinical_info$BAN_ID, clinical_info$Race, clinical_info$Ethnicity)

dedup <- race_eth[!duplicated(race_eth),]
colnames(dedup) <- c("BAN_ID", "Race", "Ethnicity")

# Combine PCs and Race/Ethnicity

pcs_race <- merge(order_link, dedup, by = c("BAN_ID"))

# Plot Race
summary(pcs_race$Race)
Min. 1st Qu. Median Mean 3rd Qu. Max.
2.000 2.000 2.000 2.121 2.000 5.000 pcs_race$C1 <- as.numeric(pcs_race$C1)
pcs_race$C2 <- as.numeric(pcs_race$C2)
pcs_race$Race <- as.factor(pcs_race$Race)
race_plot <- ggplot(pcs_race, aes(C1, C2, color = Race)) + geom_point(aes(color = pcs_race$Race)) + xlab("PC1") + ylab("PC2") + scale_color_discrete(name = c("Race"), labels = c("White", "Black", "Asian"))
plot_grid(race_plot)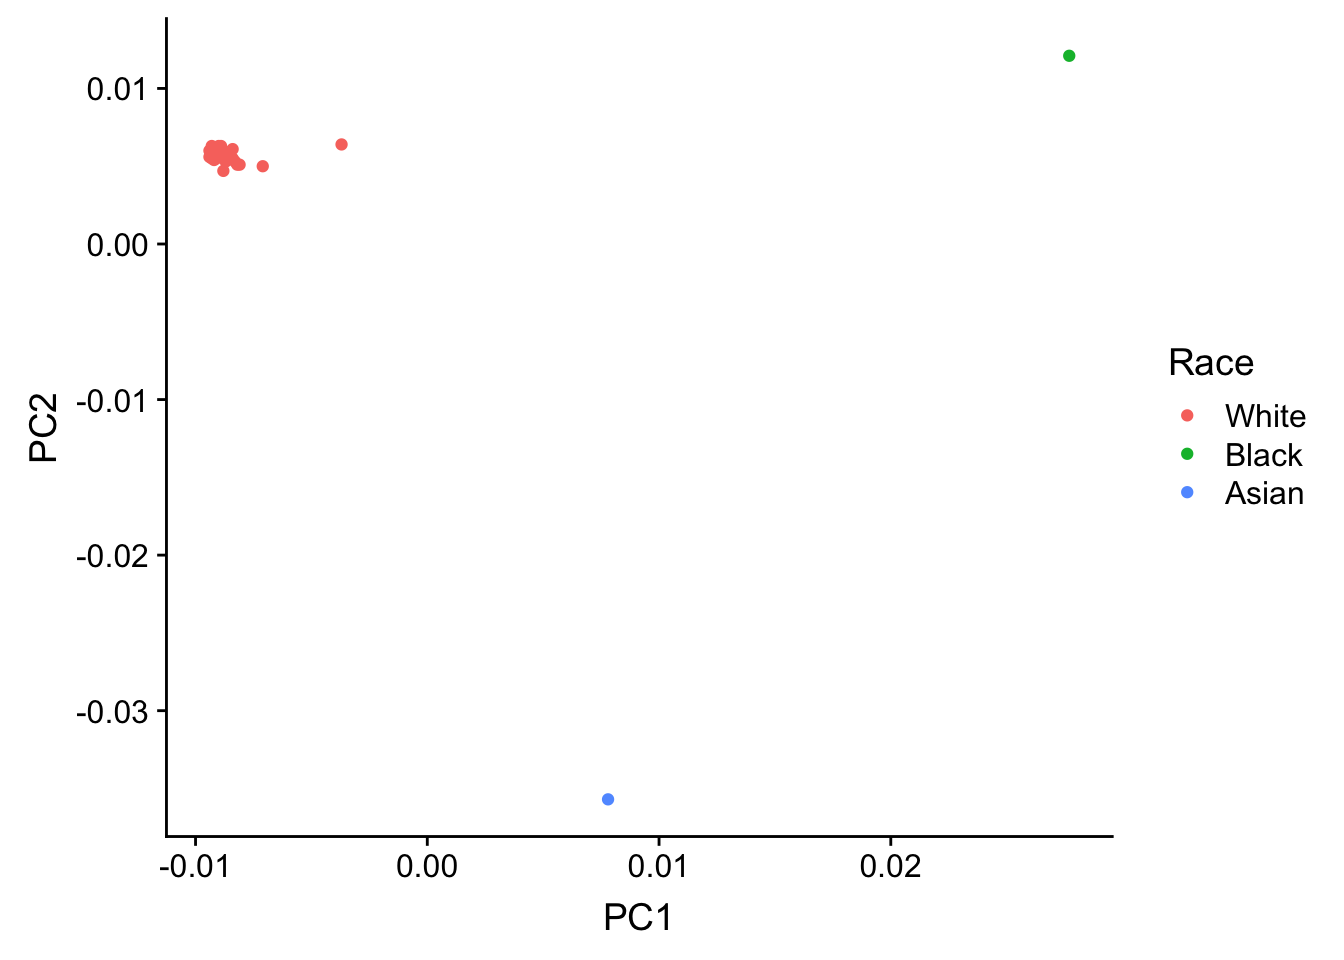
#save_plot("/Users/laurenblake/Dropbox/Lauren Blake/Figures/PCA_genotype_33.png", race_plot,
#          base_aspect_ratio = 1)

# Plot Ethnicity

summary(pcs_race$Ethnicity)
Min. 1st Qu. Median Mean 3rd Qu. Max.
1.000 2.000 2.000 1.939 2.000 2.000 race_ethnicity <- ggplot(pcs_race, aes(as.numeric(C1), as.numeric(C2))) + geom_point(color = as.factor(pcs_race$Ethnicity))
plot_grid(race_ethnicity)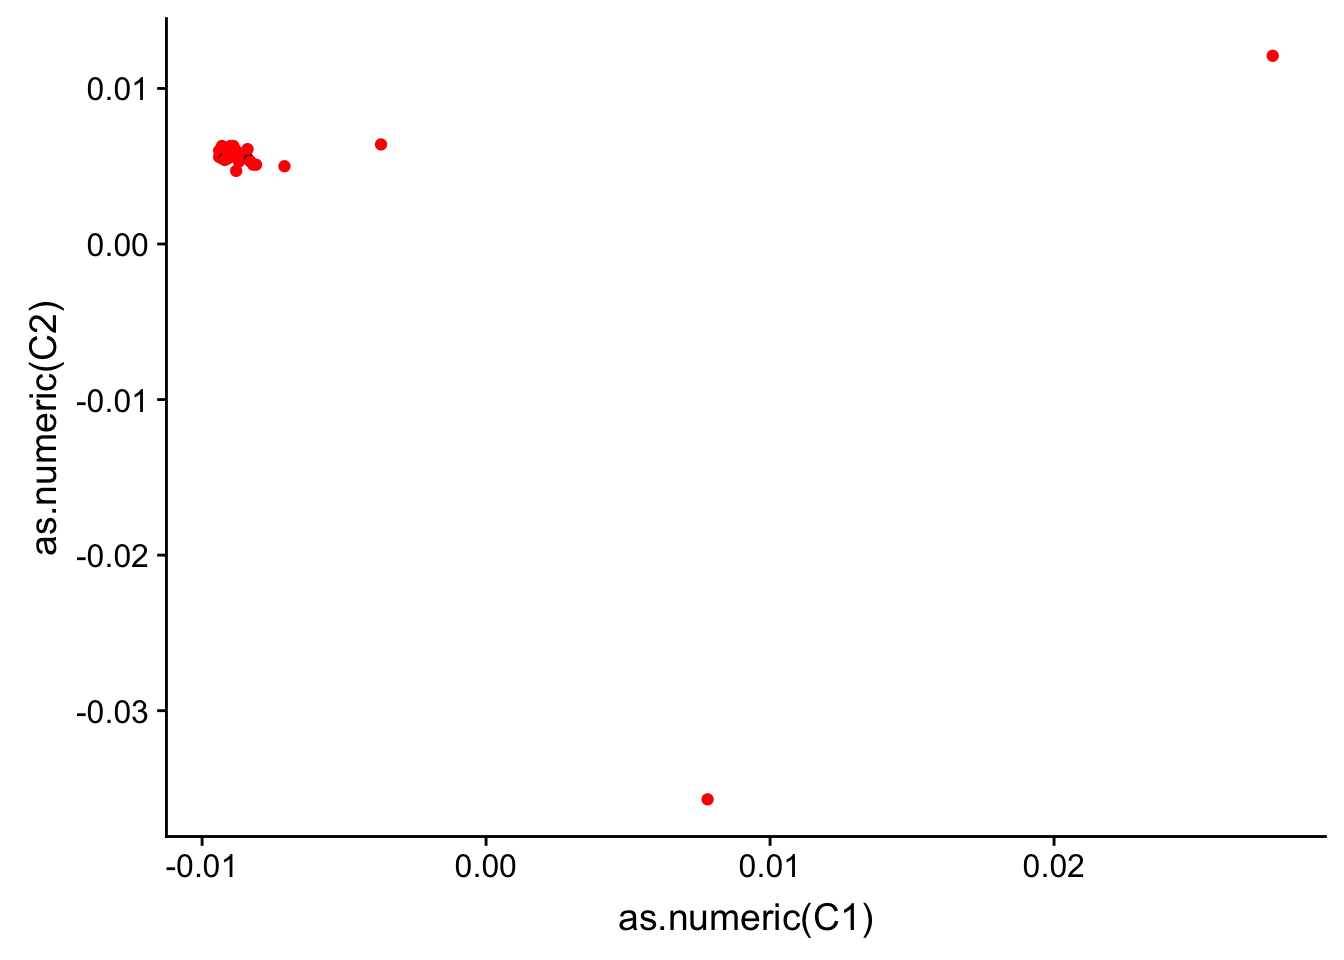
Do genotype PCs correlate with gene expression PCs?
# Load individuals

inds <- read.csv("../data/lm_covar_fixed_random.csv")


# Load gene expression data from all 156 samples

normalized_data <- read.csv("../data/gene_expression_filtered_T1T5.csv")

# Run PCA on the normalized data

pca_genes <- prcomp(t(normalized_data[,2:157]), scale = TRUE, center = TRUE)

matrixpca <- pca_genes$x
PC1 <- matrixpca[,1]
PC2 <- matrixpca[,2]
pc3 <- matrixpca[,3]
pc4 <- matrixpca[,4]
pc5 <- matrixpca[,5]

matrixpca <- as.data.frame(matrixpca)

ggplot(matrixpca, aes(PC1, PC2)) + geom_point(color = as.factor(inds$Race))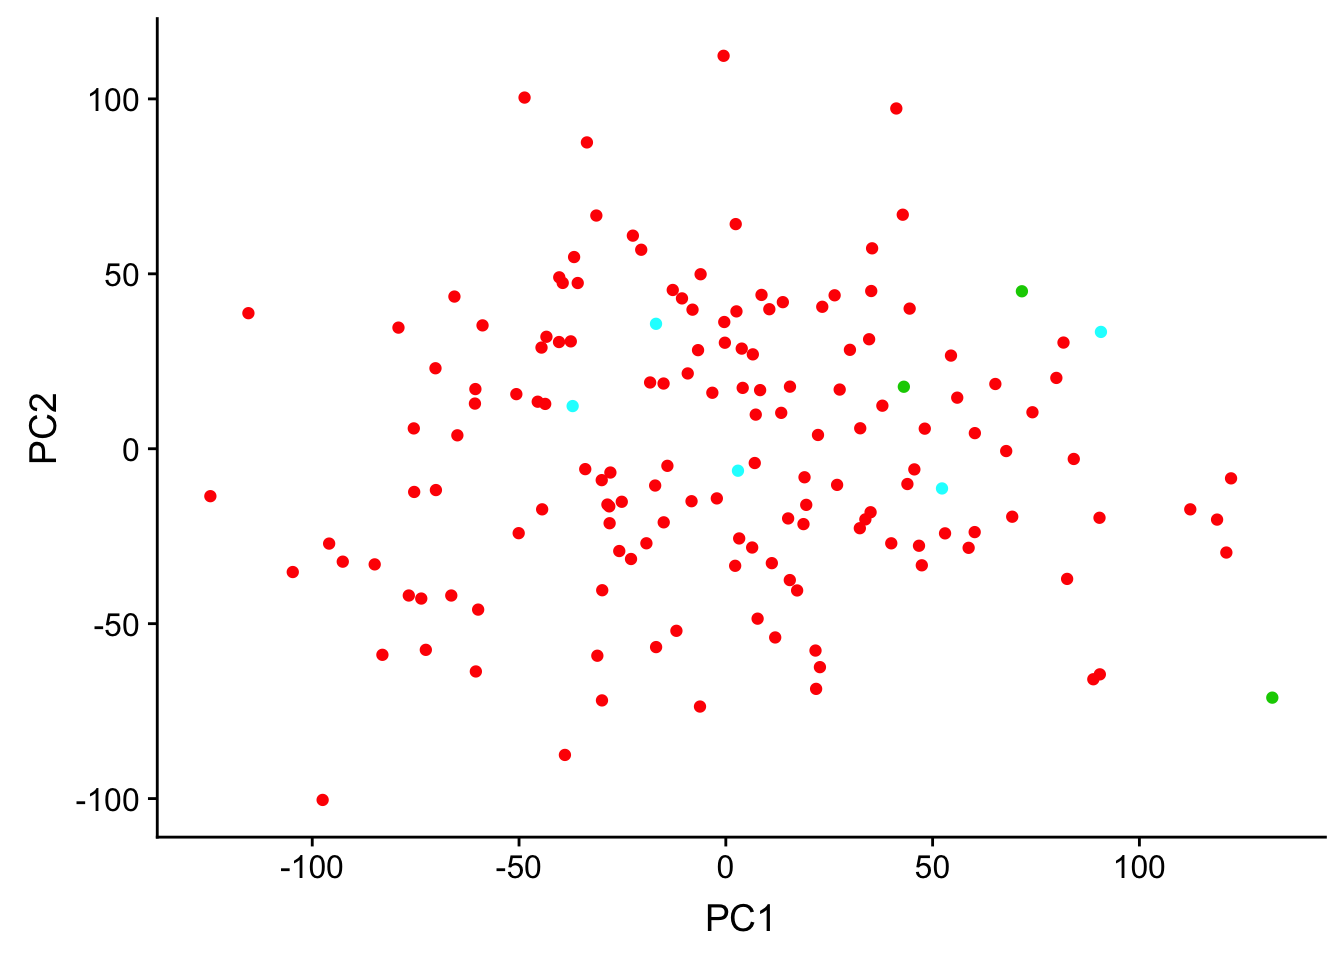
# Merge

pcs_gene <- merge(inds, pcs_race, by.x = c("Individual"), by.y = c("BAN_ID"), all.x = TRUE)

#write.csv(pcs_gene, file = "../data/pcs_genes.csv")

# Genotype PCs and gene expression PCs

# Genotype PCs- inds PC1, PC2, pc3, pc4, pc5

geno_pcs <- cbind(pcs_gene$C1, pcs_gene$C2, pcs_gene$C3, pcs_gene$C4, pcs_gene$C5)

# Gene expression PCs PC1, PC2, pc3, pc4, pc5

exp_pcs <- matrixpca

# Look at the correlation between genotype and gene expression PCs

PC_pvalues <- matrix(data = NA, nrow = 5, ncol = 5)
PC_r2 <- matrix(data = NA, nrow = 5, ncol = 5)

j=1
for (i in 1:5){
  for (j in 1:5){

  checkPC1 <- lm(exp_pcs[,j] ~ geno_pcs[,i])

#Get the summary statistics from it
  summary(checkPC1)

#Get the p-value of the F-statistic
  summary(checkPC1)$fstatistic

  fstat <- as.data.frame(summary(checkPC1)$fstatistic)
  p_fstat <- 1-pf(fstat[1,], fstat[2,], fstat[3,])

#Fraction of the variance explained by the model
  r2_value <- summary(checkPC1)$r.squared

#Put the summary statistics into the matrix w

  PC_pvalues[j, i] <- p_fstat
  PC_r2[j, i] <- sqrt(r2_value)

  }

}

PC_pvalues
[,1] [,2] [,3] [,4] [,5]
[1,] 0.7284291 0.8718604 0.9758057 0.6688093 0.44217602
[2,] 0.5334731 0.3182166 0.6805427 0.7026873 0.54787400
[3,] 0.7640570 0.7281449 0.7094446 0.9547397 0.68724443
[4,] 0.6279917 0.3637570 0.1395446 0.3894734 0.12304434
[5,] 0.2668212 0.2760426 0.0537522 0.1497131 0.04555031PC_r2 [,1] [,2] [,3] [,4] [,5]
[1,] 0.3747362 0.3395651 0.3122323 0.4380801 0.5642826
[2,] 0.4101985 0.4481101 0.4107386 0.4317606 0.5477315
[3,] 0.3672563 0.3747938 0.4052225 0.3558263 0.5246404
[4,] 0.3937424 0.4396422 0.5145687 0.4855540 0.6259618
[5,] 0.4583122 0.4564179 0.5492556 0.5352130 0.6569248#
summary(lm(exp_pcs$PC1 ~ as.factor(inds$Individual)))
Call:
lm(formula = exp_pcs$PC1 ~ as.factor(inds$Individual))

Residuals:
     Min       1Q   Median       3Q      Max
-105.572  -25.606    0.263   29.322   82.106

Coefficients:
                               Estimate Std. Error t value Pr(>|t|)
(Intercept)                    -19.3616    28.7645  -0.673   0.5024
as.factor(inds$Individual)2202  13.3167    36.3846   0.366   0.7151
as.factor(inds$Individual)2203  89.9787    45.4807   1.978   0.0506 .
as.factor(inds$Individual)2204  22.3070    40.6792   0.548   0.5847
as.factor(inds$Individual)2205  92.5553    45.4807   2.035   0.0445 *
as.factor(inds$Individual)2206 101.6186    40.6792   2.498   0.0141 *
as.factor(inds$Individual)2207  64.4914    40.6792   1.585   0.1160
as.factor(inds$Individual)2208  19.5135    40.6792   0.480   0.6325
as.factor(inds$Individual)2209   1.0985    36.3846   0.030   0.9760
as.factor(inds$Individual)2210  39.7511    40.6792   0.977   0.3308
as.factor(inds$Individual)2212  67.0229    45.4807   1.474   0.1437
as.factor(inds$Individual)2215   0.0947    40.6792   0.002   0.9981
as.factor(inds$Individual)2216  49.5588    40.6792   1.218   0.2260
as.factor(inds$Individual)2218   8.7791    36.3846   0.241   0.8098
as.factor(inds$Individual)2219  30.9841    40.6792   0.762   0.4480
as.factor(inds$Individual)2220 -13.4357    36.3846  -0.369   0.7127
as.factor(inds$Individual)2221   1.7413    40.6792   0.043   0.9659
as.factor(inds$Individual)2222  46.4545    45.4807   1.021   0.3095
as.factor(inds$Individual)2224  28.9250    40.6792   0.711   0.4787
as.factor(inds$Individual)2226  -8.7533    36.3846  -0.241   0.8104
as.factor(inds$Individual)2228   2.4691    36.3846   0.068   0.9460
as.factor(inds$Individual)2229 -20.3303    45.4807  -0.447   0.6558
as.factor(inds$Individual)2232 -29.3737    40.6792  -0.722   0.4719
as.factor(inds$Individual)2233  31.1382    40.6792   0.765   0.4458
as.factor(inds$Individual)2234  34.1855    40.6792   0.840   0.4027
as.factor(inds$Individual)2235  64.7807    40.6792   1.592   0.1144
as.factor(inds$Individual)2236  33.9494    45.4807   0.746   0.4571
as.factor(inds$Individual)2239  42.2090    40.6792   1.038   0.3019
as.factor(inds$Individual)2240  21.1739    45.4807   0.466   0.6425
as.factor(inds$Individual)2242  -8.9251    40.6792  -0.219   0.8268
as.factor(inds$Individual)2243 -39.8009    40.6792  -0.978   0.3302
as.factor(inds$Individual)2245  22.4821    45.4807   0.494   0.6222
as.factor(inds$Individual)2247   5.2058    45.4807   0.114   0.9091
as.factor(inds$Individual)2248  31.6231    40.6792   0.777   0.4388
as.factor(inds$Individual)2249 -23.7633    45.4807  -0.522   0.6025
as.factor(inds$Individual)2250 -18.4777    45.4807  -0.406   0.6854
as.factor(inds$Individual)2251   4.4844    45.4807   0.099   0.9217
as.factor(inds$Individual)2252 -48.3774    45.4807  -1.064   0.2900
as.factor(inds$Individual)2253  46.4340    45.4807   1.021   0.3097
as.factor(inds$Individual)2254  58.5507    40.6792   1.439   0.1531
as.factor(inds$Individual)2255  62.8194    45.4807   1.381   0.1703
as.factor(inds$Individual)2256  -3.9874    40.6792  -0.098   0.9221
as.factor(inds$Individual)2257 -34.4837    45.4807  -0.758   0.4501
as.factor(inds$Individual)2258  24.9128    40.6792   0.612   0.5416
as.factor(inds$Individual)2260  18.8908    40.6792   0.464   0.6434
as.factor(inds$Individual)2261  46.9656    45.4807   1.033   0.3042
as.factor(inds$Individual)2262   4.7721    45.4807   0.105   0.9166
as.factor(inds$Individual)2266  23.1074    40.6792   0.568   0.5713
as.factor(inds$Individual)2267  13.4927    45.4807   0.297   0.7673
as.factor(inds$Individual)2268  38.2483    40.6792   0.940   0.3493
as.factor(inds$Individual)2269  -7.0156    45.4807  -0.154   0.8777
as.factor(inds$Individual)2270 -38.0309    45.4807  -0.836   0.4050
as.factor(inds$Individual)2271  16.0481    40.6792   0.395   0.6940
as.factor(inds$Individual)2272   4.4790    40.6792   0.110   0.9125
as.factor(inds$Individual)2274  91.0681    40.6792   2.239   0.0274 *
---
Signif. codes:  0 '***' 0.001 '**' 0.01 '*' 0.05 '.' 0.1 ' ' 1

Residual standard error: 49.82 on 101 degrees of freedom
Multiple R-squared:  0.4016,    Adjusted R-squared:  0.08168
F-statistic: 1.255 on 54 and 101 DF,  p-value: 0.1624
summary(lm(exp_pcs$PC1 ~ as.factor(inds$Race)))
Call:
lm(formula = exp_pcs$PC1 ~ as.factor(inds$Race))

Residuals:
     Min       1Q   Median       3Q      Max
-122.346  -35.217    0.932   34.715  124.450

Coefficients:
                      Estimate Std. Error t value Pr(>|t|)
(Intercept)             -2.289      4.183  -0.547  0.58503
as.factor(inds$Race)3   84.546     29.676   2.849  0.00499 **
as.factor(inds$Race)5   20.687     23.139   0.894  0.37269
---
Signif. codes:  0 '***' 0.001 '**' 0.01 '*' 0.05 '.' 0.1 ' ' 1

Residual standard error: 50.89 on 153 degrees of freedom
Multiple R-squared:  0.05434,   Adjusted R-squared:  0.04198
F-statistic: 4.396 on 2 and 153 DF,  p-value: 0.01392
summary(lm(exp_pcs$PC2 ~ as.factor(inds$Race)))
Call:
lm(formula = exp_pcs$PC2 ~ as.factor(inds$Race))

Residuals:
     Min       1Q   Median       3Q      Max
-100.011  -26.679   -4.111   29.069  112.690

Coefficients:
                      Estimate Std. Error t value Pr(>|t|)
(Intercept)            -0.3734     3.2498  -0.115    0.909
as.factor(inds$Race)3  -2.4307    23.0562  -0.105    0.916
as.factor(inds$Race)5  13.1076    17.9771   0.729    0.467

Residual standard error: 39.54 on 153 degrees of freedom
Multiple R-squared:  0.003563,  Adjusted R-squared:  -0.009463
F-statistic: 0.2735 on 2 and 153 DF,  p-value: 0.7611
summary(lm(exp_pcs$PC1 ~ geno_pcs[,1]))
Call:
lm(formula = exp_pcs$PC1 ~ geno_pcs[, 1])

Residuals:
     Min       1Q   Median       3Q      Max
-132.705  -35.717    5.717   38.461  100.425

Coefficients:
                     Estimate Std. Error t value Pr(>|t|)
(Intercept)             4.626     38.640   0.120    0.905
geno_pcs[, 1]-0.0071   -4.667     54.646  -0.085    0.932
geno_pcs[, 1]-0.0081  -24.651     54.646  -0.451    0.653
geno_pcs[, 1]-0.0082   45.110     54.646   0.825    0.412
geno_pcs[, 1]-0.0083  -62.019     54.646  -1.135    0.260
geno_pcs[, 1]-0.0084  -15.831     44.618  -0.355    0.724
geno_pcs[, 1]-0.0085  -23.988     49.884  -0.481    0.632
geno_pcs[, 1]-0.0087  -18.743     47.324  -0.396    0.693
geno_pcs[, 1]-0.0088   -3.293     44.618  -0.074    0.941
geno_pcs[, 1]-0.0089  -14.351     43.201  -0.332    0.741
geno_pcs[, 1]-0.009     3.443     40.623   0.085    0.933
geno_pcs[, 1]-0.0091   20.686     43.201   0.479    0.633
geno_pcs[, 1]-0.0092  -12.740     43.201  -0.295    0.769
geno_pcs[, 1]-0.0093   -5.280     43.201  -0.122    0.903
geno_pcs[, 1]-0.0094   22.865     45.720   0.500    0.618
geno_pcs[, 1]0.0078     6.759     49.884   0.135    0.893
geno_pcs[, 1]0.0277    54.431     49.884   1.091    0.279

Residual standard error: 54.65 on 74 degrees of freedom
  (65 observations deleted due to missingness)
Multiple R-squared:  0.1404,    Adjusted R-squared:  -0.04543
F-statistic: 0.7556 on 16 and 74 DF,  p-value: 0.7284
summary(lm(exp_pcs$PC2 ~ geno_pcs[,1]))
Call:
lm(formula = exp_pcs$PC2 ~ geno_pcs[, 1])

Residuals:
     Min       1Q   Median       3Q      Max
-107.090  -21.031    1.545   25.131   60.190

Coefficients:
                     Estimate Std. Error t value Pr(>|t|)
(Intercept)          -18.7717    25.5348  -0.735   0.4646
geno_pcs[, 1]-0.0071  60.2004    36.1117   1.667   0.0997 .
geno_pcs[, 1]-0.0081  25.6306    36.1117   0.710   0.4801
geno_pcs[, 1]-0.0082  32.8006    36.1117   0.908   0.3667
geno_pcs[, 1]-0.0083 -17.9777    36.1117  -0.498   0.6201
geno_pcs[, 1]-0.0084  10.7153    29.4850   0.363   0.7173
geno_pcs[, 1]-0.0085   4.5755    32.9653   0.139   0.8900
geno_pcs[, 1]-0.0087  36.0867    31.2736   1.154   0.2523
geno_pcs[, 1]-0.0088  26.2883    29.4850   0.892   0.3755
geno_pcs[, 1]-0.0089  26.4590    28.5488   0.927   0.3570
geno_pcs[, 1]-0.009   17.6991    26.8451   0.659   0.5117
geno_pcs[, 1]-0.0091  14.9706    28.5488   0.524   0.6016
geno_pcs[, 1]-0.0092  25.4771    28.5488   0.892   0.3751
geno_pcs[, 1]-0.0093  -0.3447    28.5488  -0.012   0.9904
geno_pcs[, 1]-0.0094  19.9330    30.2132   0.660   0.5115
geno_pcs[, 1]0.0078   30.0521    32.9653   0.912   0.3649
geno_pcs[, 1]0.0277  -24.4411    32.9653  -0.741   0.4608
---
Signif. codes:  0 '***' 0.001 '**' 0.01 '*' 0.05 '.' 0.1 ' ' 1

Residual standard error: 36.11 on 74 degrees of freedom
  (65 observations deleted due to missingness)
Multiple R-squared:  0.1683,    Adjusted R-squared:  -0.01157
F-statistic: 0.9357 on 16 and 74 DF,  p-value: 0.5335
summary(lm(geno_pcs[,1] ~ as.factor(inds$Race)))
Call:
lm(formula = geno_pcs[, 1] ~ as.factor(inds$Race))

Residuals:
      Min        1Q    Median        3Q       Max
-0.012367 -0.001801 -0.001701 -0.001101  0.034999

Coefficients:
                        Estimate Std. Error t value Pr(>|t|)
(Intercept)           -0.0072988  0.0007568  -9.644 1.94e-15 ***
as.factor(inds$Race)3  0.0102655  0.0040990   2.504   0.0141 *
as.factor(inds$Race)5 -0.0014678  0.0040990  -0.358   0.7211
---
Signif. codes:  0 '***' 0.001 '**' 0.01 '*' 0.05 '.' 0.1 ' ' 1

Residual standard error: 0.006978 on 88 degrees of freedom
  (65 observations deleted due to missingness)
Multiple R-squared:  0.06848,   Adjusted R-squared:  0.04731
F-statistic: 3.234 on 2 and 88 DF,  p-value: 0.04411
summary(lm(geno_pcs[,2] ~ as.factor(inds$Race)))
Call:
lm(formula = geno_pcs[, 2] ~ as.factor(inds$Race))

Residuals:
      Min        1Q    Median        3Q       Max
-0.040096  0.001004  0.001204  0.001654  0.007704

Coefficients:
                       Estimate Std. Error t value Pr(>|t|)
(Intercept)           0.0043965  0.0008272   5.315 7.98e-07 ***
as.factor(inds$Race)3 0.0036369  0.0044801   0.812    0.419
as.factor(inds$Race)5 0.0015702  0.0044801   0.350    0.727
---
Signif. codes:  0 '***' 0.001 '**' 0.01 '*' 0.05 '.' 0.1 ' ' 1

Residual standard error: 0.007626 on 88 degrees of freedom
  (65 observations deleted due to missingness)
Multiple R-squared:  0.0086,    Adjusted R-squared:  -0.01393
F-statistic: 0.3817 on 2 and 88 DF,  p-value: 0.6839
summary(lm(geno_pcs[,3] ~ as.factor(inds$Race)))
Call:
lm(formula = geno_pcs[, 3] ~ as.factor(inds$Race))

Residuals:
       Min         1Q     Median         3Q        Max
-0.0099165 -0.0003249  0.0000000  0.0006835  0.0055835

Coefficients:
                        Estimate Std. Error t value Pr(>|t|)
(Intercept)           -0.0041835  0.0002342 -17.861   <2e-16 ***
as.factor(inds$Race)3  0.0002169  0.0012686   0.171    0.865
as.factor(inds$Race)5  0.0003835  0.0012686   0.302    0.763
---
Signif. codes:  0 '***' 0.001 '**' 0.01 '*' 0.05 '.' 0.1 ' ' 1

Residual standard error: 0.002159 on 88 degrees of freedom
  (65 observations deleted due to missingness)
Multiple R-squared:  0.001331,  Adjusted R-squared:  -0.02137
F-statistic: 0.05862 on 2 and 88 DF,  p-value: 0.9431
summary(lm(geno_pcs[,4] ~ as.factor(inds$Race)))
Call:
lm(formula = geno_pcs[, 4] ~ as.factor(inds$Race))

Residuals:
       Min         1Q     Median         3Q        Max
-0.0054424 -0.0003545  0.0001576  0.0006576  0.0025576

Coefficients:
                        Estimate Std. Error t value Pr(>|t|)
(Intercept)           -0.0031576  0.0001347 -23.440   <2e-16 ***
as.factor(inds$Race)3  0.0016243  0.0007296   2.226   0.0285 *
as.factor(inds$Race)5 -0.0009757  0.0007296  -1.337   0.1846
---
Signif. codes:  0 '***' 0.001 '**' 0.01 '*' 0.05 '.' 0.1 ' ' 1

Residual standard error: 0.001242 on 88 degrees of freedom
  (65 observations deleted due to missingness)
Multiple R-squared:  0.07325,   Adjusted R-squared:  0.05219
F-statistic: 3.478 on 2 and 88 DF,  p-value: 0.03518
summary(lm(geno_pcs[,5] ~ as.factor(inds$Race)))
Call:
lm(formula = geno_pcs[, 5] ~ as.factor(inds$Race))

Residuals:
       Min         1Q     Median         3Q        Max
-0.0091176 -0.0047176 -0.0016176  0.0007245  0.0278824

Coefficients:
                        Estimate Std. Error t value Pr(>|t|)
(Intercept)           -0.0044824  0.0008647  -5.184 1.37e-06 ***
as.factor(inds$Race)3 -0.0001843  0.0046831  -0.039    0.969
as.factor(inds$Race)5 -0.0039843  0.0046831  -0.851    0.397
---
Signif. codes:  0 '***' 0.001 '**' 0.01 '*' 0.05 '.' 0.1 ' ' 1

Residual standard error: 0.007972 on 88 degrees of freedom
  (65 observations deleted due to missingness)
Multiple R-squared:  0.008159,  Adjusted R-squared:  -0.01438
F-statistic: 0.362 on 2 and 88 DF,  p-value: 0.6973
Session information
sessionInfo()R version 3.4.3 (2017-11-30)
Platform: x86_64-apple-darwin15.6.0 (64-bit)
Running under: OS X El Capitan 10.11.6
Matrix products: default
BLAS: /Library/Frameworks/R.framework/Versions/3.4/Resources/lib/libRblas.0.dylib
LAPACK: /Library/Frameworks/R.framework/Versions/3.4/Resources/lib/libRlapack.dylib
locale:
[1] en_US.UTF-8/en_US.UTF-8/en_US.UTF-8/C/en_US.UTF-8/en_US.UTF-8
attached base packages:
[1] stats graphics grDevices utils datasets methods base
other attached packages:
[1] cowplot_0.9.3 ggplot2_3.0.0
loaded via a namespace (and not attached):
[1] Rcpp_0.12.18 compiler_3.4.3 pillar_1.3.0
[4] git2r_0.23.0 plyr_1.8.4 workflowr_1.1.1
[7] bindr_0.1.1 R.methodsS3_1.7.1 R.utils_2.6.0
[10] tools_3.4.3 digest_0.6.16 evaluate_0.11
[13] tibble_1.4.2 gtable_0.2.0 pkgconfig_2.0.2
[16] rlang_0.2.2 yaml_2.2.0 bindrcpp_0.2.2
[19] withr_2.1.2 stringr_1.3.1 dplyr_0.7.6
[22] knitr_1.20 rprojroot_1.3-2 grid_3.4.3
[25] tidyselect_0.2.4 glue_1.3.0 R6_2.2.2
[28] rmarkdown_1.10 purrr_0.2.5 magrittr_1.5
[31] whisker_0.3-2 backports_1.1.2 scales_1.0.0
[34] htmltools_0.3.6 assertthat_0.2.0 colorspace_1.3-2
[37] labeling_0.3 stringi_1.2.4 lazyeval_0.2.1
[40] munsell_0.5.0 crayon_1.3.4 R.oo_1.22.0
This reproducible R Markdown analysis was created with workflowr 1.1.1