Normalization_plots_RNAseq
Lauren Blake
June 2, 2016
The goal of this script is to visualize different normalizations that can be applied to the RNA-seq data.
The RNA-seq data that we are using here are counts from orthologous genes. This was created by taking the sum of counts from the ortholgous exons. For more information about how the orthologous exons were determined, see http://giladlab.uchicago.edu/orthoExon/.
#Load the libraries

library("gplots")
## Warning: package 'gplots' was built under R version 3.1.3##
## Attaching package: 'gplots'
##
## The following object is masked from 'package:stats':
##
## lowesslibrary("ggplot2")## Warning: package 'ggplot2' was built under R version 3.1.3library("RColorBrewer")
library("scales")
library("edgeR")## Loading required package: limma## Warning: package 'limma' was built under R version 3.1.3# Load colors
colors <- colorRampPalette(c(brewer.pal(9, "Blues")[1],brewer.pal(9, "Blues")[9]))(100)
pal <- c(brewer.pal(9, "Set1"), brewer.pal(8, "Set2"), brewer.pal(12, "Set3"))
#Load the data
#Raw counts
counts_genes <- read.delim("~/Reg_Evo_Primates/ashlar-trial/data/counts_genes.txt")
head(counts_genes)## C1H C1K C1Li C1Lu C2H C2K C2Li C2Lu C3H C3K C3Li
## ENSG00000000003 645 3217 6687 1436 539 2178 5590 1102 769 2966 3349
## ENSG00000000005 145 12 8 3 33 13 5 11 10 34 1
## ENSG00000000419 1559 1337 1336 1433 1074 1107 1203 1712 1303 1267 1295
## ENSG00000000457 641 1334 1304 1009 597 1262 1998 1476 626 1289 1373
## ENSG00000000460 77 131 92 159 66 126 107 189 76 96 77
## ENSG00000000938 1329 507 743 6027 121 584 896 12637 796 653 560
## C3Lu C4H C4K C4Li C4Lu H1H H1K H1Li H1Lu H2H H2K H2Li
## ENSG00000000003 1835 475 2590 4794 1505 2301 4252 2100 956 225 2365 2024
## ENSG00000000005 2 363 10 1 6 0 1099 0 6 1 22 0
## ENSG00000000419 1512 1391 1092 806 1396 1490 1755 1492 1566 855 706 1162
## ENSG00000000457 1124 631 928 1324 1341 818 711 682 632 186 286 444
## ENSG00000000460 136 69 101 63 194 732 248 699 278 65 63 128
## ENSG00000000938 4470 314 351 327 7349 461 608 491 6564 828 214 1291
## H2Lu H3H H3K H3Li H3Lu H4H H4K H4Li H4Lu R1H R1K R1Li
## ENSG00000000003 690 124 4810 2918 1427 467 3002 1775 1104 270 2669 4046
## ENSG00000000005 0 0 37 0 0 3 28 0 2 0 0 1
## ENSG00000000419 1513 573 2041 1018 1175 1818 1768 1051 2042 582 917 711
## ENSG00000000457 700 231 931 436 583 238 616 666 903 257 711 443
## ENSG00000000460 223 10 280 129 200 74 143 162 304 32 64 11
## ENSG00000000938 4767 182 220 732 4395 725 512 2199 15230 47 129 175
## R1Lu R2H R2K R2Li R2Lu R3H R3K R3Li R3Lu R4H R4K R4Li
## ENSG00000000003 1928 399 3727 7517 2005 500 4005 5547 2088 519 4719 6289
## ENSG00000000005 4 2 5 8 1 1 1 2 3 3 8 1
## ENSG00000000419 945 635 875 995 1173 996 1151 1197 1479 752 1283 1330
## ENSG00000000457 913 321 945 859 1531 427 983 773 1710 398 1221 1202
## ENSG00000000460 178 43 66 53 209 71 102 50 284 37 98 87
## ENSG00000000938 2922 81 170 240 3817 165 134 234 5482 97 171 686
## R4Lu
## ENSG00000000003 1978
## ENSG00000000005 0
## ENSG00000000419 1585
## ENSG00000000457 1367
## ENSG00000000460 346
## ENSG00000000938 5494 #Sample information
samples <- read.csv("~/Reg_Evo_Primates/ashlar-trial/data/Sample_info_RNAseq.csv")
head(samples)## Sample.ID Sample.name Species Tissue
## 1 C1H chimp 4x0519 heart chimpanzee heart
## 2 C1K chimp 4x0519 kidney chimpanzee kidney
## 3 C1Li chimp 4x0519 liver chimpanzee liver
## 4 C1Lu chimp 4x0519 lung chimpanzee lung
## 5 C2H chimp YN07-387 heart chimpanzee heart
## 6 C2K chimp YN07-387 kidney chimpanzee kidneylabels <- paste(samples$Species, samples$Tissue, sep=" ")Hierarchical clustering and PCA on raw data
#PCA function (original code from Julien Roux)
#Load in the plot_scores function
plot_scores <- function(pca, scores, n, m, cols, points=F, pchs =20, legend=F){
  xmin <- min(scores[,n]) - (max(scores[,n]) - min(scores[,n]))*0.05
  if (legend == T){ ## let some room (35%) for a legend
    xmax <- max(scores[,n]) + (max(scores[,n]) - min(scores[,n]))*0.50
  }
  else {
    xmax <- max(scores[,n]) + (max(scores[,n]) - min(scores[,n]))*0.05
  }
  ymin <- min(scores[,m]) - (max(scores[,m]) - min(scores[,m]))*0.05
  ymax <- max(scores[,m]) + (max(scores[,m]) - min(scores[,m]))*0.05
  plot(scores[,n], scores[,m], xlab=paste("PC", n, ": ", round(summary(pca)$importance[2,n],3)*100, "% variance explained", sep=""), ylab=paste("PC", m, ": ", round(summary(pca)$importance[2,m],3)*100, "% variance explained", sep=""), xlim=c(xmin, xmax), ylim=c(ymin, ymax), type="n")
  if (points == F){
    text(scores[,n],scores[,m], rownames(scores), col=cols, cex=1)
  }
  else {
    points(scores[,n],scores[,m], col=cols, pch=pchs, cex=1.3)
  }
}
# Clustering (original code from Julien Roux)
cors <- cor(counts_genes, method="spearman", use="pairwise.complete.obs")
heatmap.2( cors, scale="none", col = colors, margins = c(12, 12), trace='none', denscol="white", labCol=labels, ColSideColors=pal[as.integer(as.factor(samples$Species))], RowSideColors=pal[as.integer(as.factor(samples$Tissue))+9], cexCol = 0.2 + 1/log10(15), cexRow = 0.2 + 1/log10(15))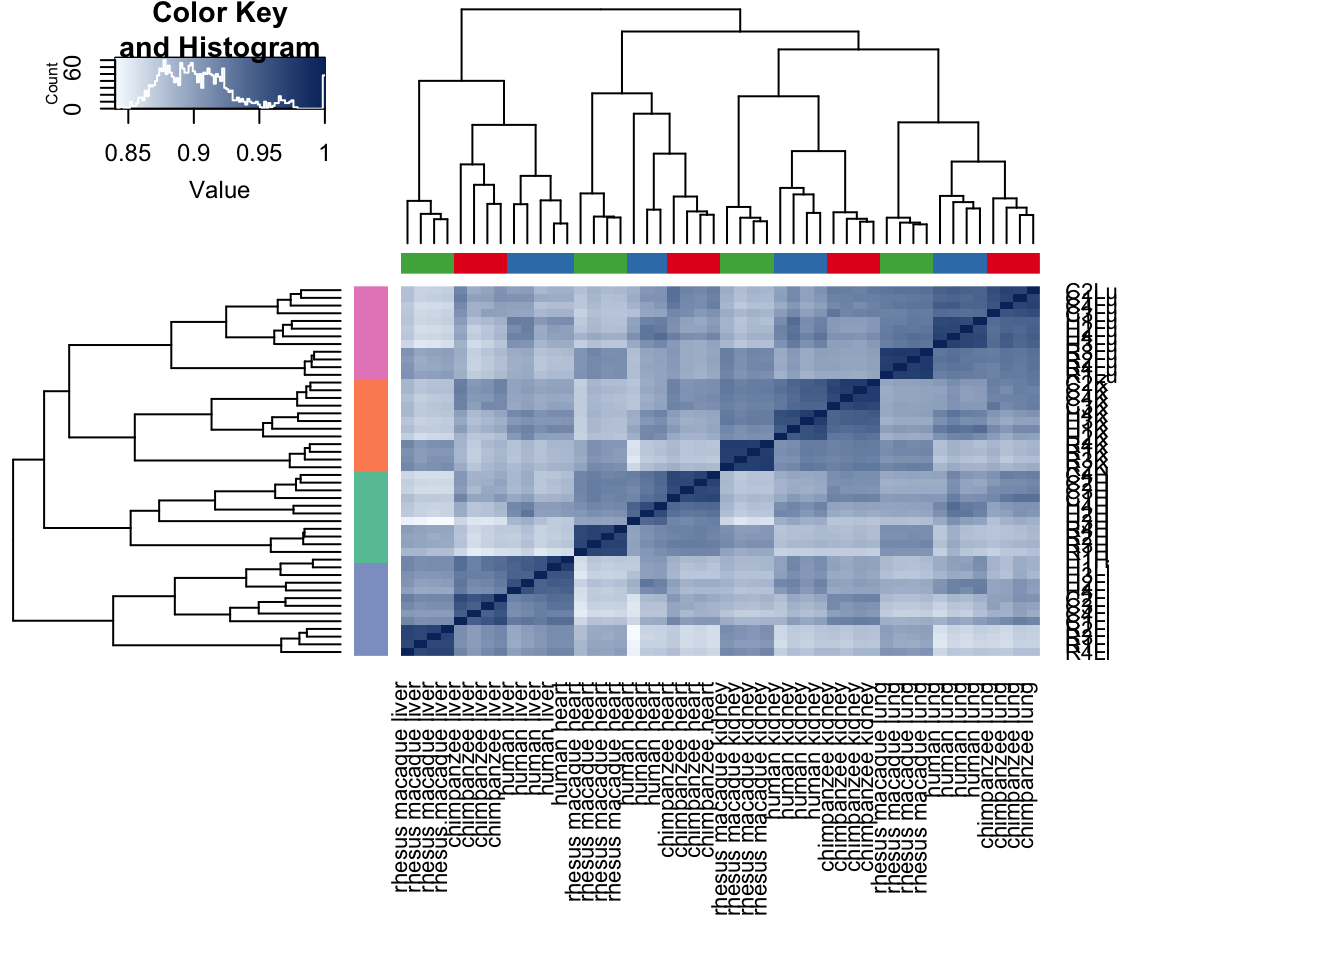
# Check that there's no "NAs" in the data
select <- counts_genes
summary(apply(select, 1, var) == 0)
## Mode FALSE TRUE NA's
## logical 28253 1777 0# Perform PCA
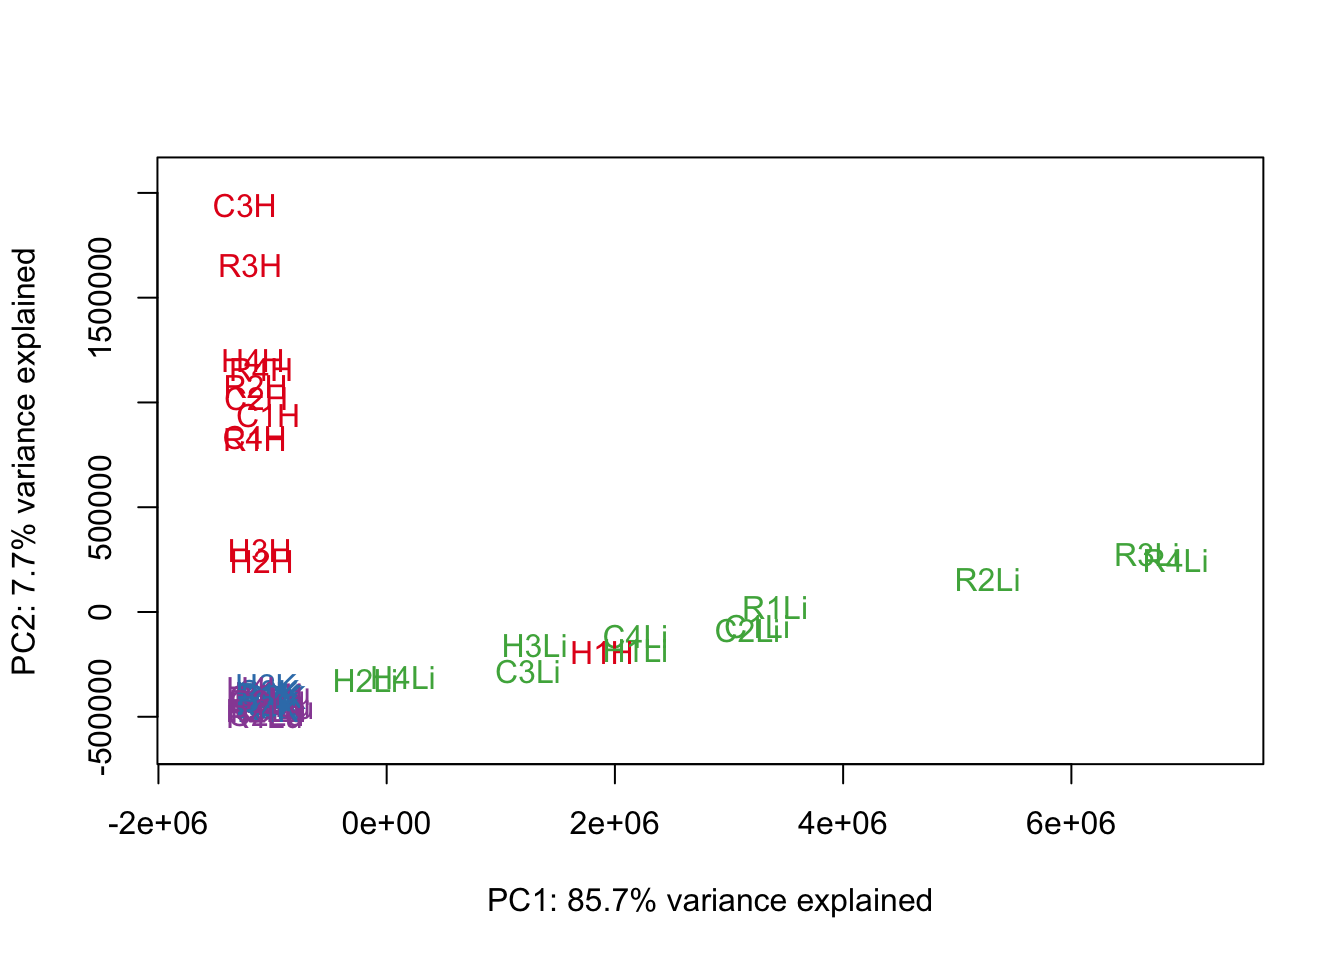
pca_genes <- prcomp(t(counts_genes), scale = F)
scores <- pca_genes$x
#Make PCA plots with the factors colored by tissue
### PCs 1 and 2 Raw Data
for (n in 1:1){
col.v <- pal[as.integer(samples$Tissue)]
plot_scores(pca_genes, scores, n, n+1, col.v)
}
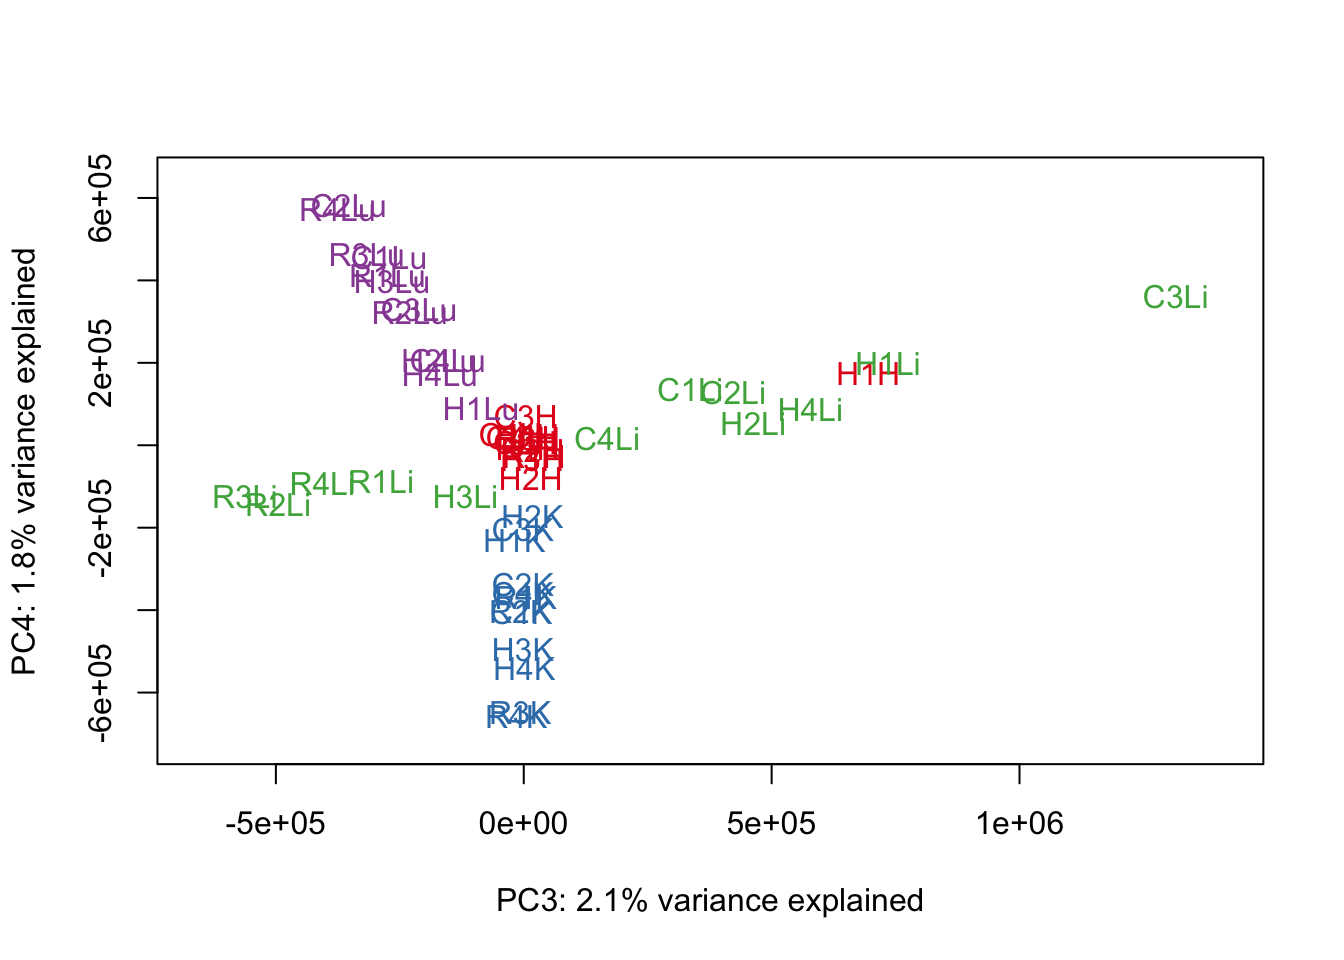
### PCs 3 and 4 Raw Data

for (n in 3:3){
  col.v <- pal[as.integer(samples$Tissue)]
  plot_scores(pca_genes, scores, n, n+1, col.v)
}
Density plot for the raw data
Let’s see what the density plot looks like when we only use one sample and the raw counts.
density_plot_C1H <- ggplot(counts_genes, aes(x = C1H)) + geom_density()

density_plot_C1H + labs(title = "Density plot of raw gene counts of C1H") + labs(x = "Raw counts for each gene")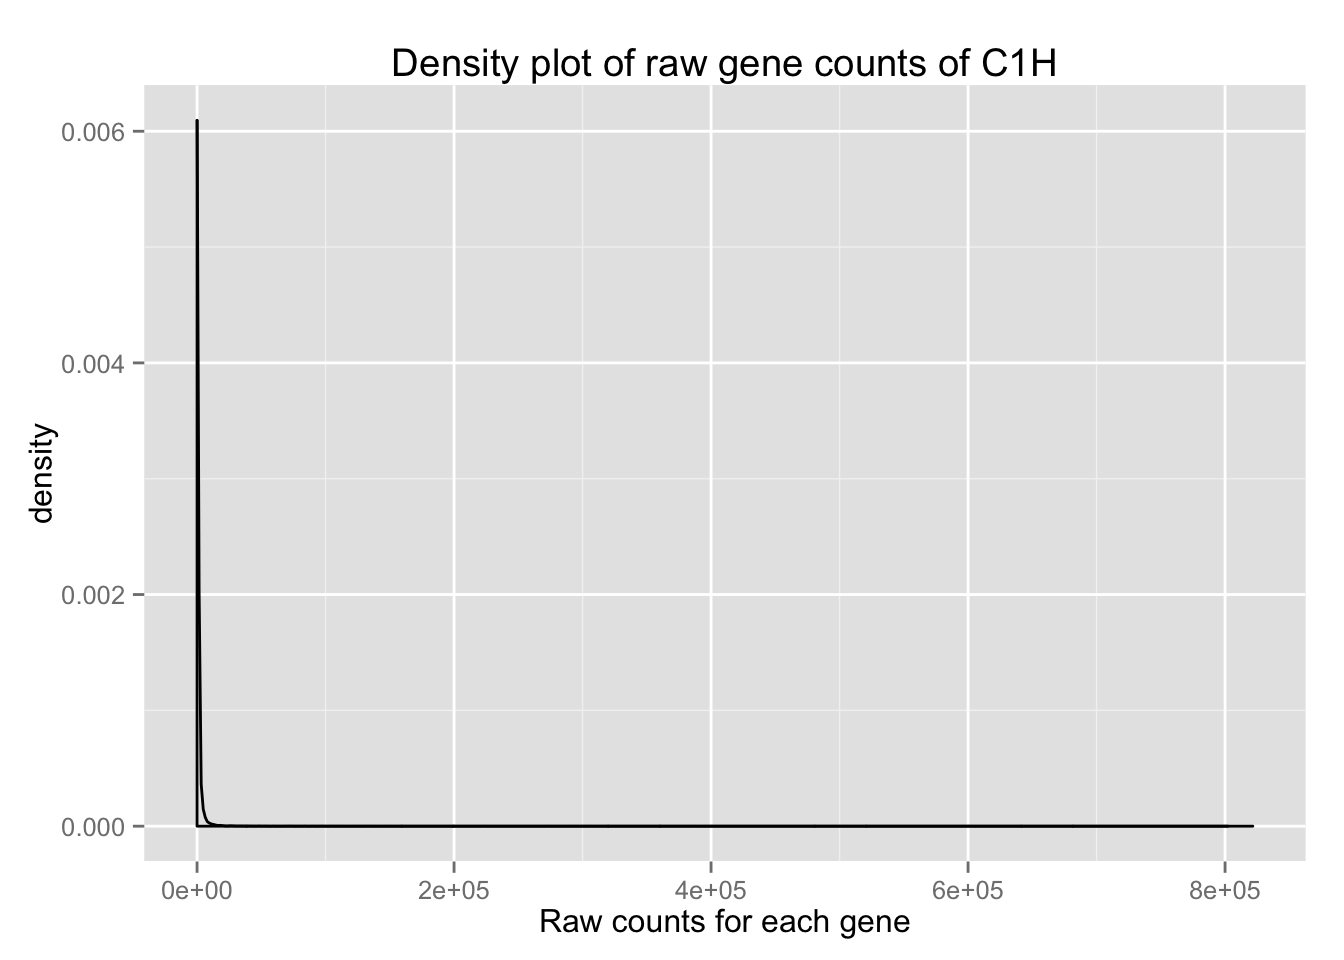
We need to first transform this raw data so we can better assess the densities. We will look the counts using log2.
Log2(raw counts)
log_counts_genes <- as.data.frame(log2(counts_genes))
head(log_counts_genes)
## C1H C1K C1Li C1Lu C2H
## ENSG00000000003 9.333155 11.651500 12.707143 10.487840 9.074141
## ENSG00000000005 7.179909 3.584963 3.000000 1.584963 5.044394
## ENSG00000000419 10.606405 10.384784 10.383704 10.484823 10.068778
## ENSG00000000457 9.324181 10.381543 10.348728 9.978710 9.221587
## ENSG00000000460 6.266787 7.033423 6.523562 7.312883 6.044394
## ENSG00000000938 10.376125 8.985842 9.537218 12.557224 6.918863
## C2K C2Li C2Lu C3H C3K
## ENSG00000000003 11.088788 12.448633 10.105909 9.586840 11.534303
## ENSG00000000005 3.700440 2.321928 3.459432 3.321928 5.087463
## ENSG00000000419 10.112440 10.232421 10.741467 10.347621 10.307201
## ENSG00000000457 10.301496 10.964341 10.527477 9.290019 10.332037
## ENSG00000000460 6.977280 6.741467 7.562242 6.247928 6.584963
## ENSG00000000938 9.189825 9.807355 13.625366 9.636625 9.350939
## C3Li C3Lu C4H C4K C4Li
## ENSG00000000003 11.709515 10.841564 8.891784 11.338736 12.227014
## ENSG00000000005 0.000000 1.000000 8.503826 3.321928 0.000000
## ENSG00000000419 10.338736 10.562242 10.441907 10.092757 9.654636
## ENSG00000000457 10.423116 10.134426 9.301496 9.857981 10.370687
## ENSG00000000460 6.266787 7.087463 6.108524 6.658211 5.977280
## ENSG00000000938 9.129283 12.126059 8.294621 8.455327 8.353147
## C4Lu H1H H1K H1Li H1Lu H2H
## ENSG00000000003 10.555548 11.168045 12.053926 11.036174 9.900867 7.813781
## ENSG00000000005 2.584963 -Inf 10.101976 -Inf 2.584963 0.000000
## ENSG00000000419 10.447083 10.541097 10.777255 10.543032 10.612868 9.739781
## ENSG00000000457 10.389094 9.675957 9.473706 9.413628 9.303781 7.539159
## ENSG00000000460 7.599913 9.515700 7.954196 9.449149 8.118941 6.022368
## ENSG00000000938 12.843332 8.848623 9.247928 8.939579 12.680360 9.693487
## H2K H2Li H2Lu H3H H3K H3Li
## ENSG00000000003 11.207624 10.982994 9.430453 6.954196 12.231821 11.510764
## ENSG00000000005 4.459432 -Inf -Inf -Inf 5.209453 -Inf
## ENSG00000000419 9.463524 10.182394 10.563196 9.162391 10.995060 9.991522
## ENSG00000000457 8.159871 8.794416 9.451211 7.851749 9.862637 8.768184
## ENSG00000000460 5.977280 7.000000 7.800900 3.321928 8.129283 7.011227
## ENSG00000000938 7.741467 10.334273 12.218866 7.507795 7.781360 9.515700
## H3Lu H4H H4K H4Li H4Lu R1H
## ENSG00000000003 10.478770 8.867279 11.551708 10.793603 10.108524 8.076816
## ENSG00000000005 -Inf 1.584963 4.807355 -Inf 1.000000 -Inf
## ENSG00000000419 10.198445 10.828136 10.787903 10.037547 10.995767 9.184875
## ENSG00000000457 9.187352 7.894818 9.266787 9.379378 9.818582 8.005625
## ENSG00000000460 7.643856 6.209453 7.159871 7.339850 8.247928 5.000000
## ENSG00000000938 12.101647 9.501837 9.000000 11.102632 13.894628 5.554589
## R1K R1Li R1Lu R2H R2K R2Li
## ENSG00000000003 11.382084 11.982281 10.912889 8.640245 11.863799 12.875941
## ENSG00000000005 -Inf 0.000000 2.000000 1.000000 2.321928 3.000000
## ENSG00000000419 9.840778 9.473706 9.884171 9.310613 9.773139 9.958553
## ENSG00000000457 9.473706 8.791163 9.834471 8.326429 9.884171 9.746514
## ENSG00000000460 6.000000 3.459432 7.475733 5.426265 6.044394 5.727920
## ENSG00000000938 7.011227 7.451211 11.512740 6.339850 7.409391 7.906891
## R2Lu R3H R3K R3Li R3Lu R4H
## ENSG00000000003 10.969387 8.965784 11.967587 12.437492 11.027906 9.019591
## ENSG00000000005 0.000000 0.000000 0.000000 1.000000 1.584963 1.584963
## ENSG00000000419 10.195987 9.960002 10.168672 10.225207 10.530406 9.554589
## ENSG00000000457 10.580259 8.738092 9.941048 9.594325 10.739781 8.636625
## ENSG00000000460 7.707359 6.149747 6.672425 5.643856 8.149747 5.209453
## ENSG00000000938 11.898223 7.366322 7.066089 7.870365 12.420487 6.599913
## R4K R4Li R4Lu
## ENSG00000000003 12.204265 12.618615 10.949827
## ENSG00000000005 3.000000 0.000000 -Inf
## ENSG00000000419 10.325305 10.377211 10.630267
## ENSG00000000457 10.253847 10.231221 10.416798
## ENSG00000000460 6.614710 6.442943 8.434628
## ENSG00000000938 7.417853 9.422065 12.423641density_plot_C1H <- ggplot(log_counts_genes, aes(x = C1H)) + geom_density()
density_plot_C1H + labs(title = "Density plot of log2 counts of C1H") + labs(x = "Log2 counts for each gene") + geom_vline(xintercept = 1) ## Warning in loop_apply(n, do.ply): Removed 8718 rows containing non-finite
## values (stat_density).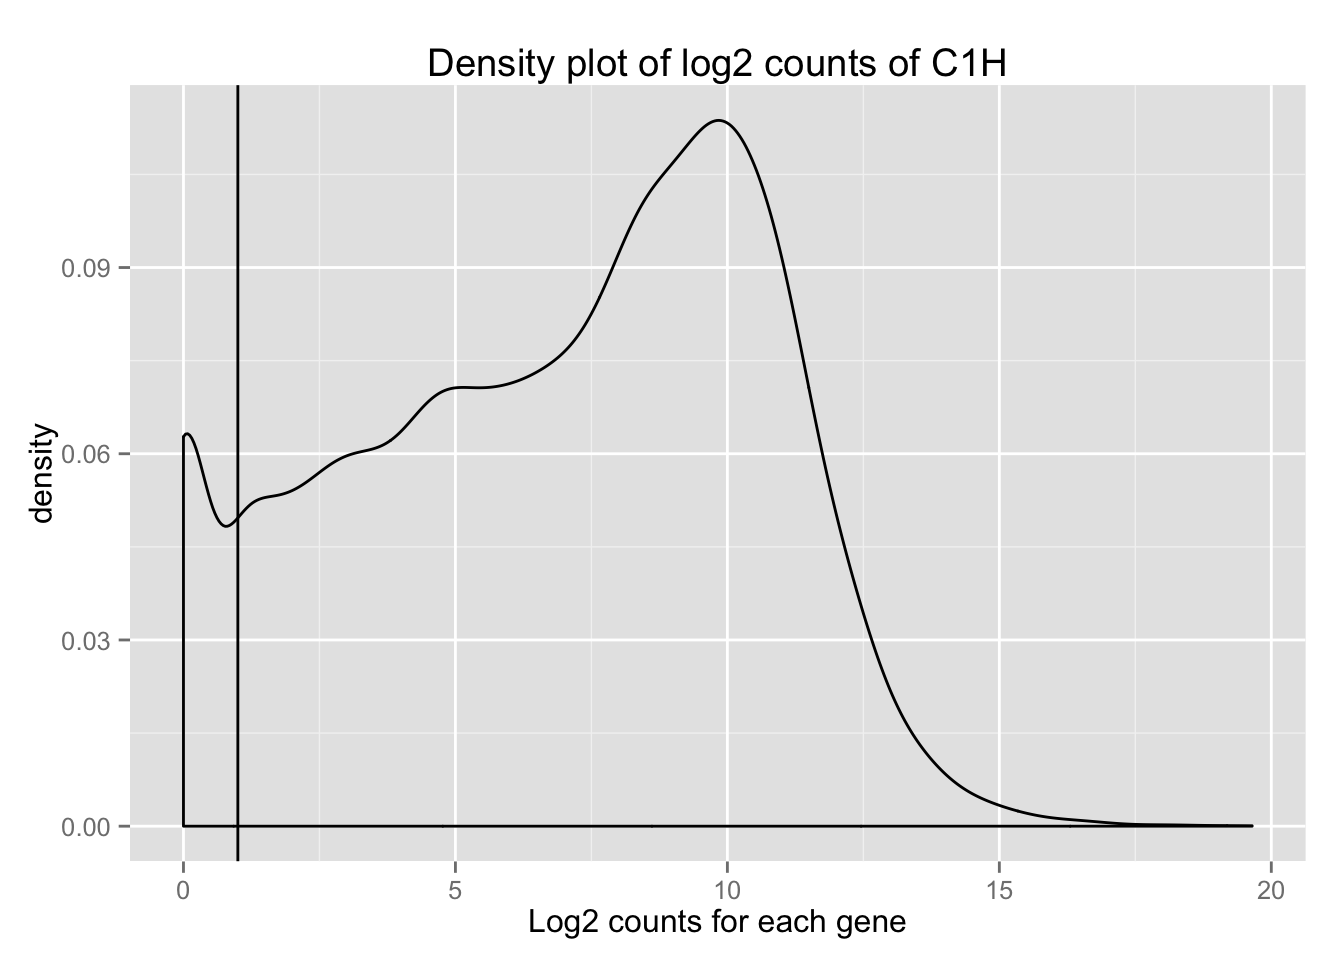
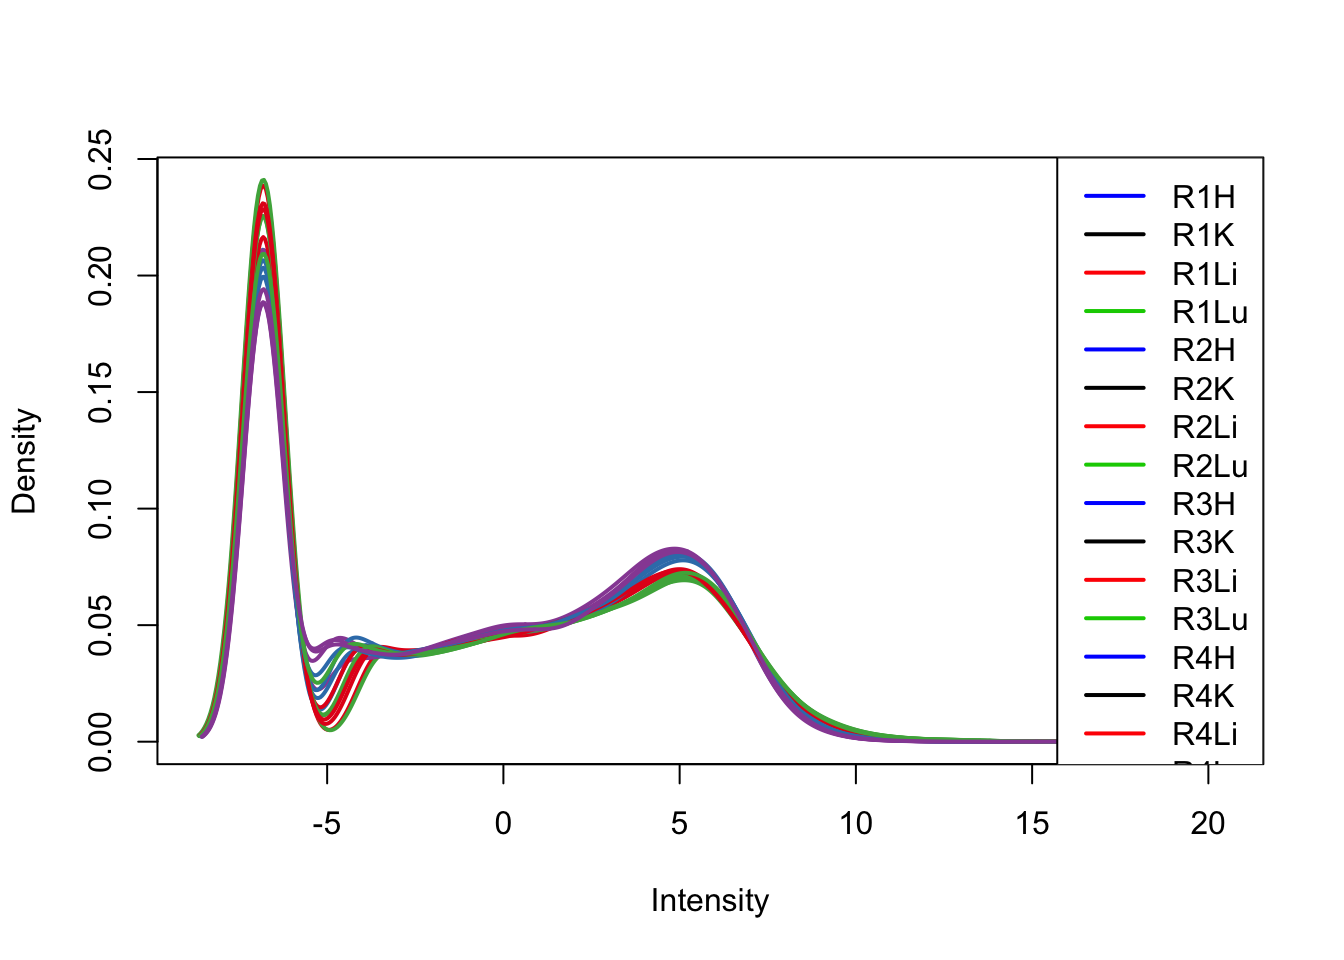
plotDensities(log_counts_genes, col=pal[as.numeric(samples$Species)], legend="topright")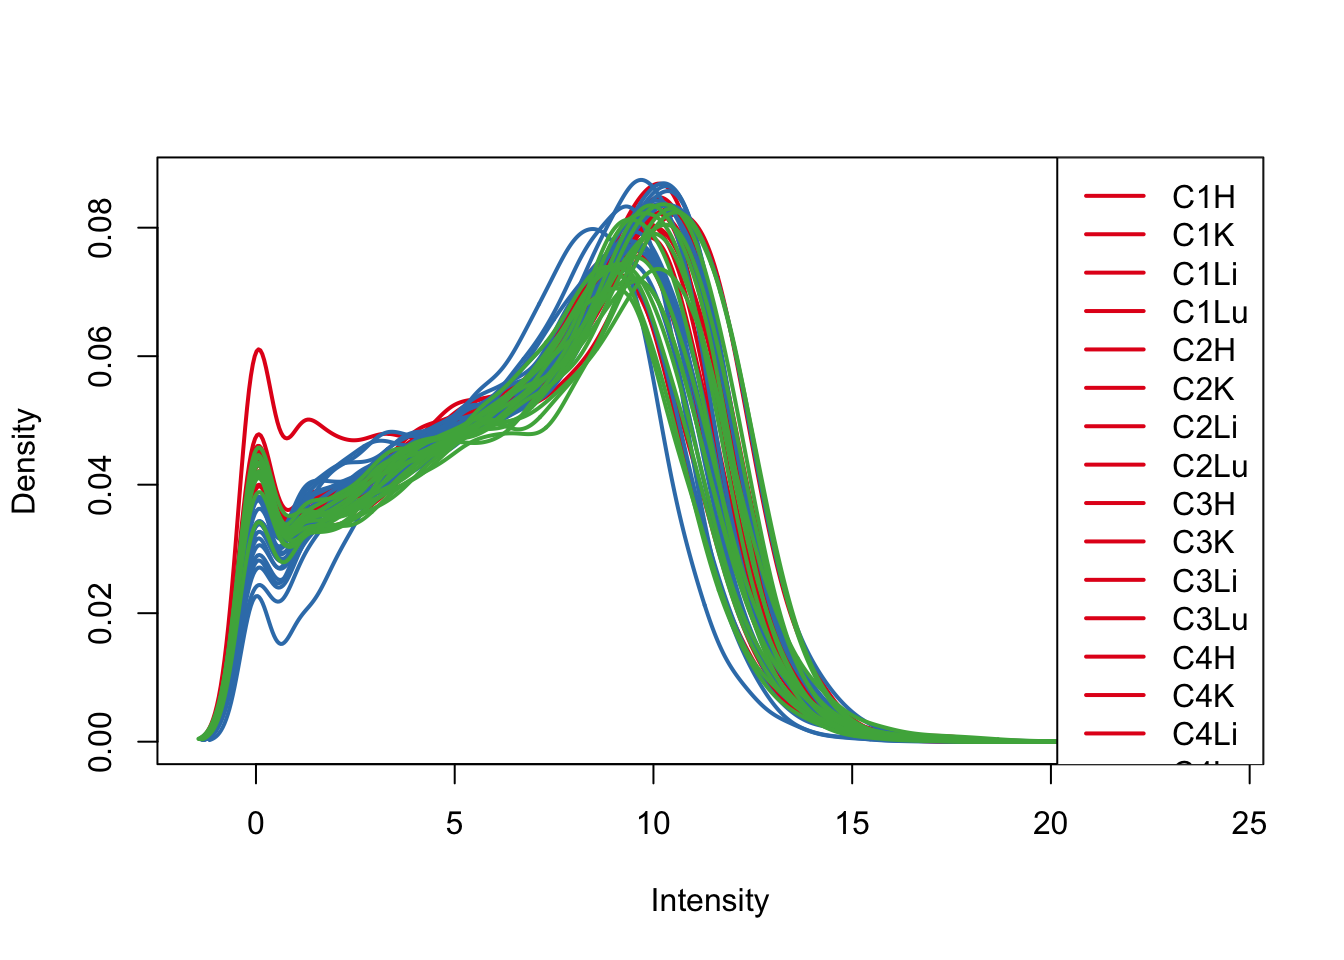
plotDensities(log_counts_genes, col=pal[as.numeric(samples$Tissue)], legend="topright")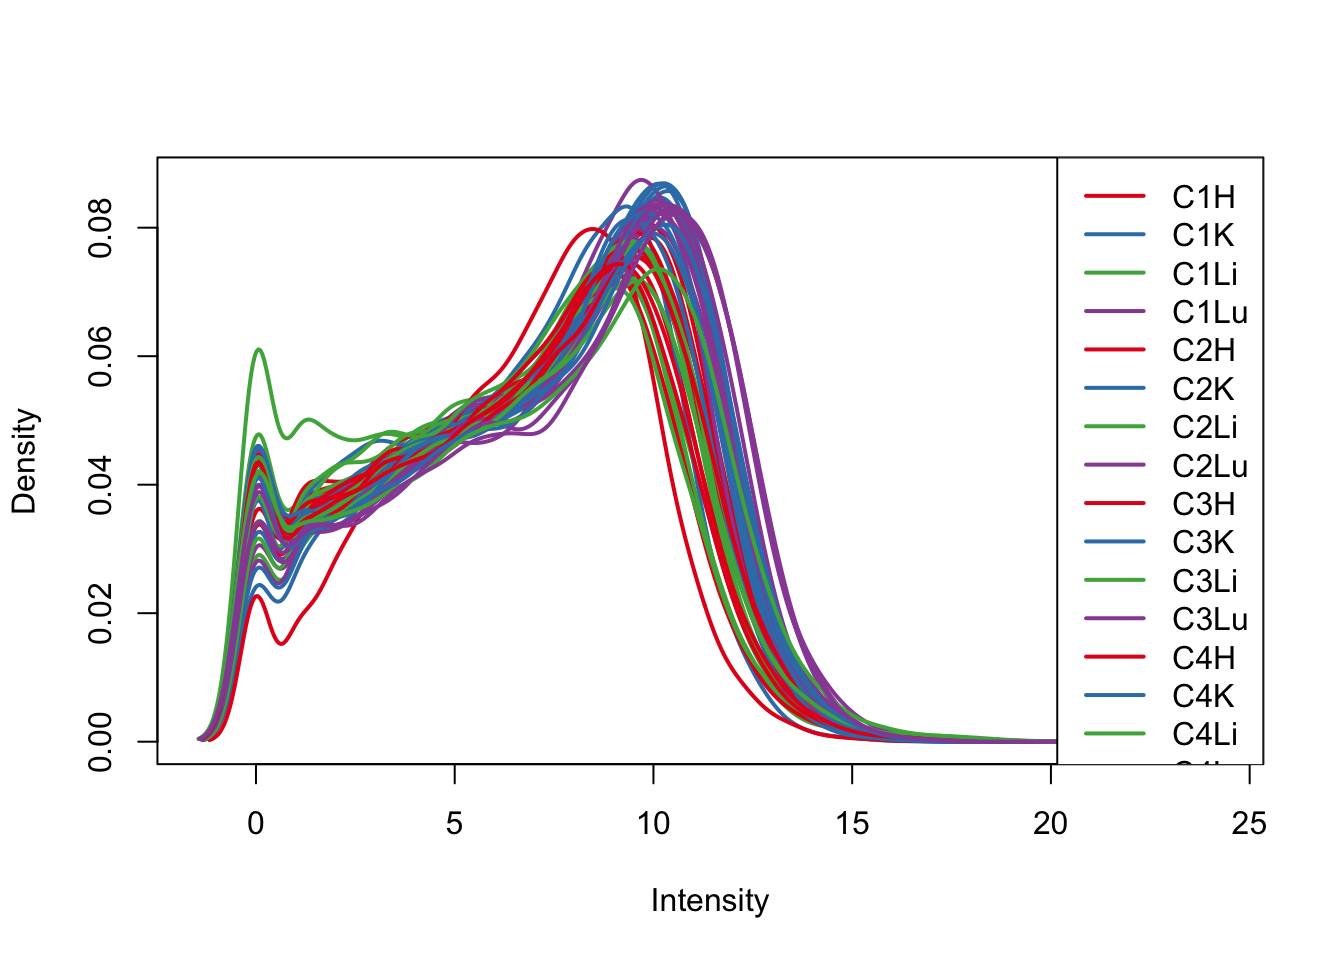
all_hearts <- c(1,5,9,13,17, 21,25,29,33,37,41,45)
all_kidneys <- c(2,6,10,14,18, 22,26,30,34,38,42,46)
all_livers <- c(3,7,11,15,19, 23,27,31,35,39,43,47)
all_lungs <- c(4,8,12,16,20, 24,28,31,36,40,44,48)

# Look at all species for each tissue

col = as.data.frame(pal[as.numeric(samples$Species)])

plotDensities(log_counts_genes[,all_hearts], col=col[all_hearts, ], legend="topright")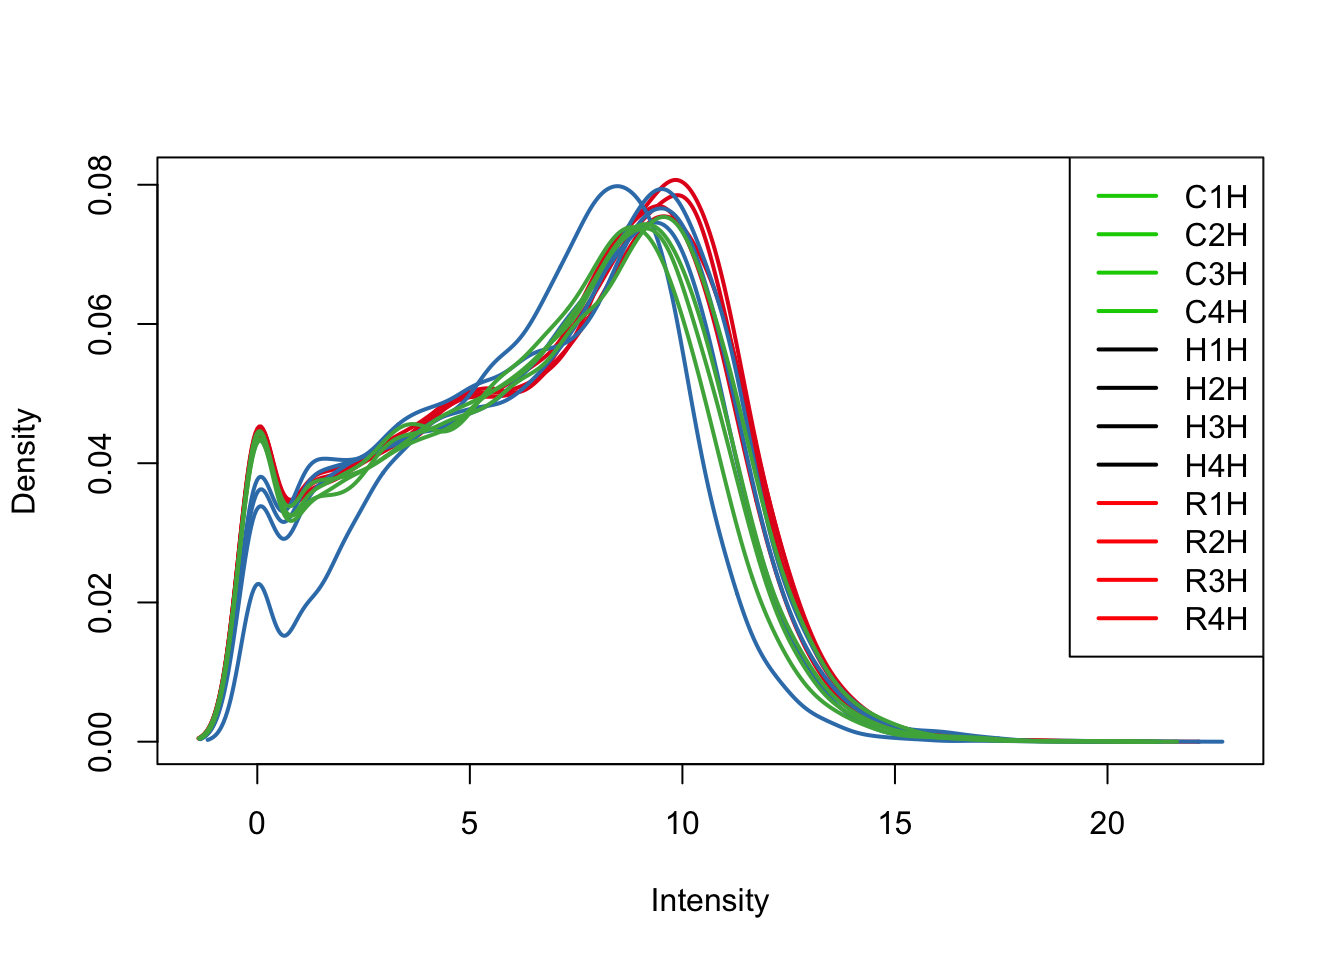
plotDensities(log_counts_genes[,all_kidneys], col=col[all_kidneys, ], legend="topright")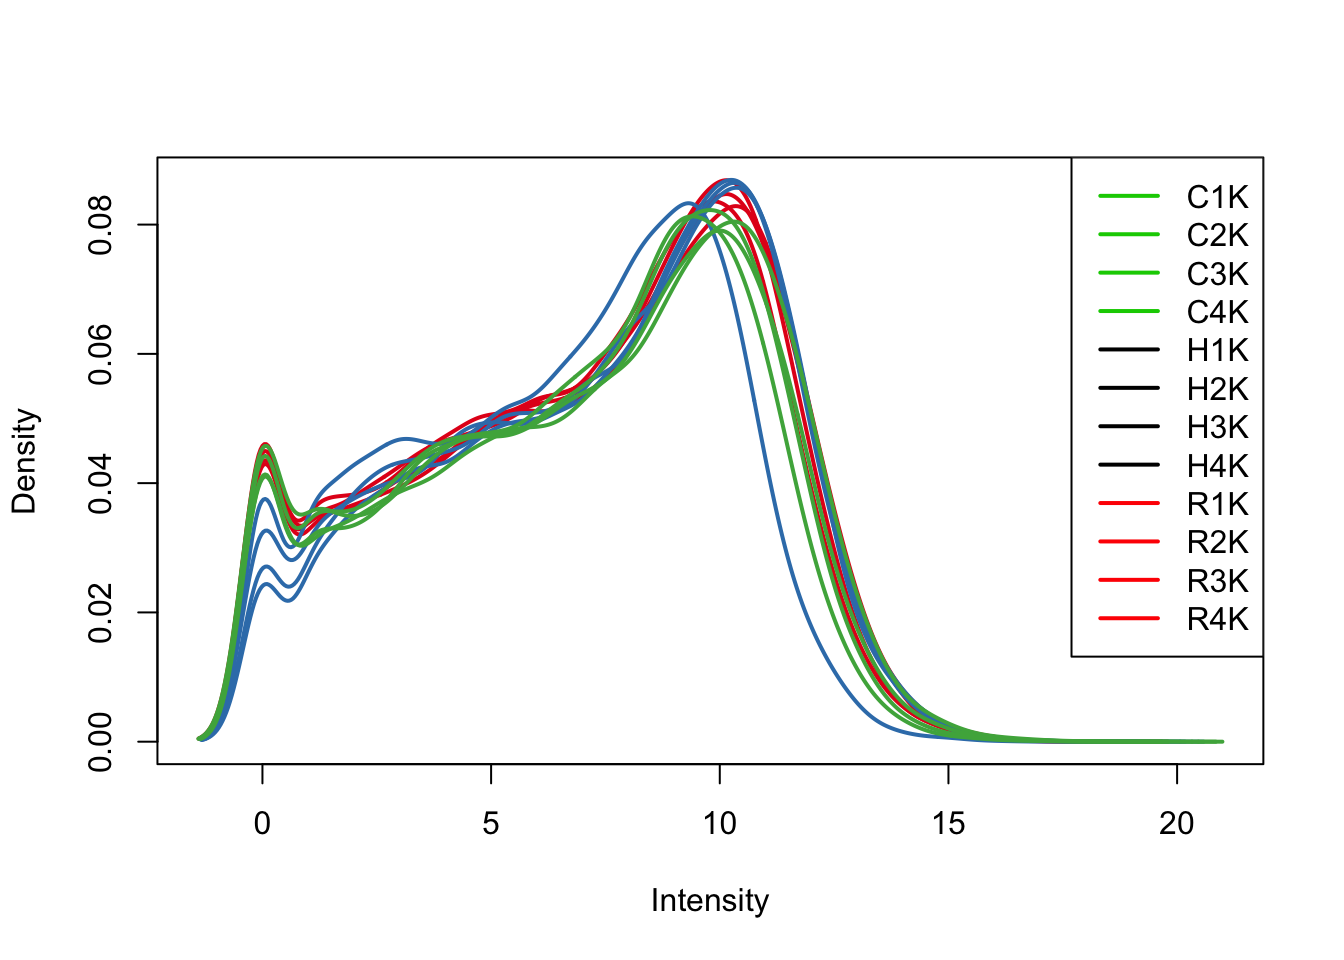
plotDensities(log_counts_genes[,all_livers], col=col[all_livers, ], legend="topright")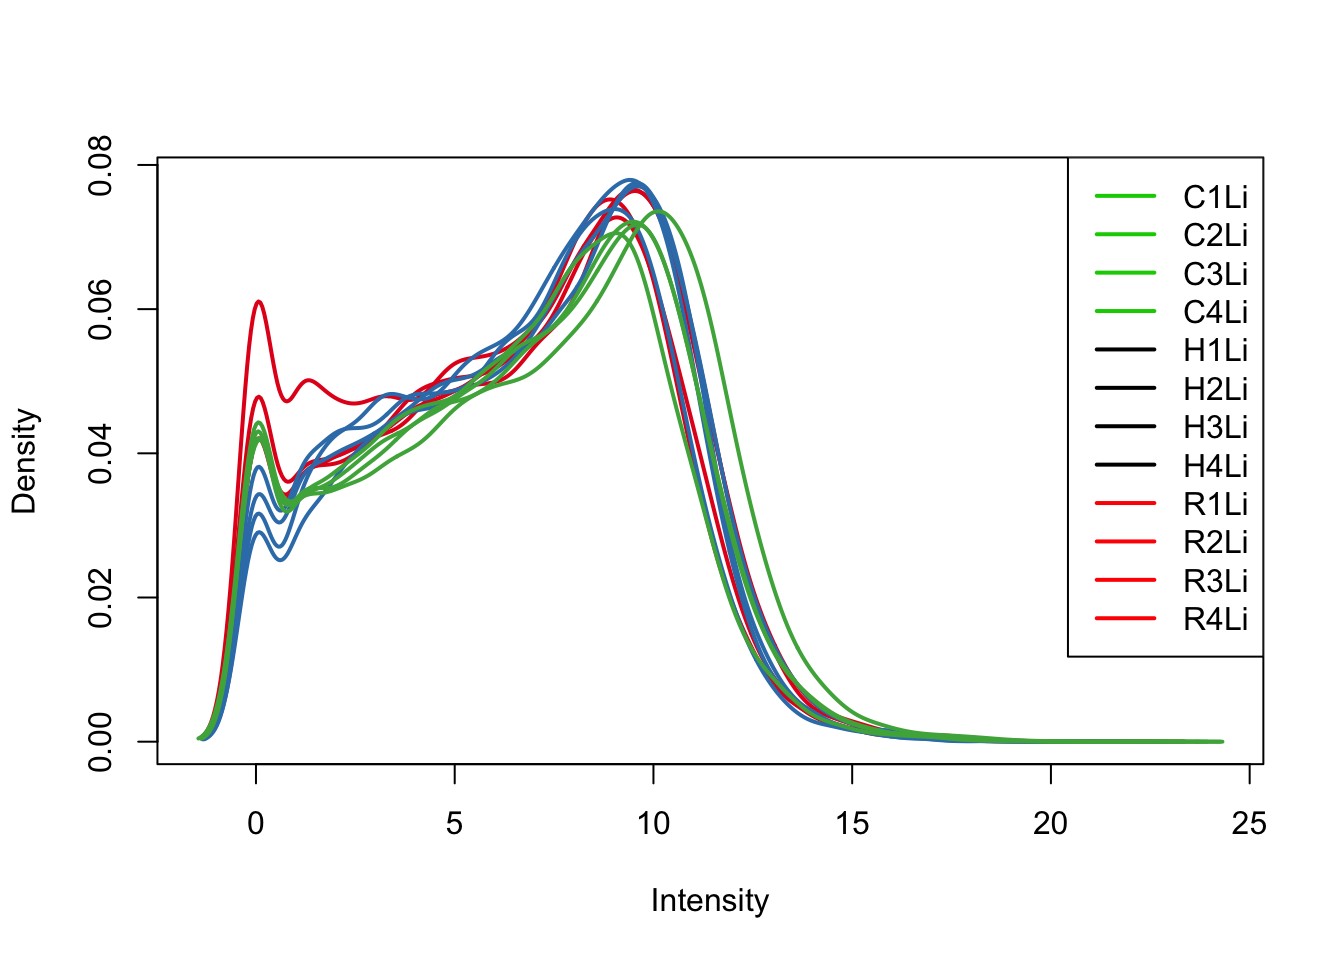
plotDensities(log_counts_genes[,all_lungs], col=col[all_lungs, ], legend="topright")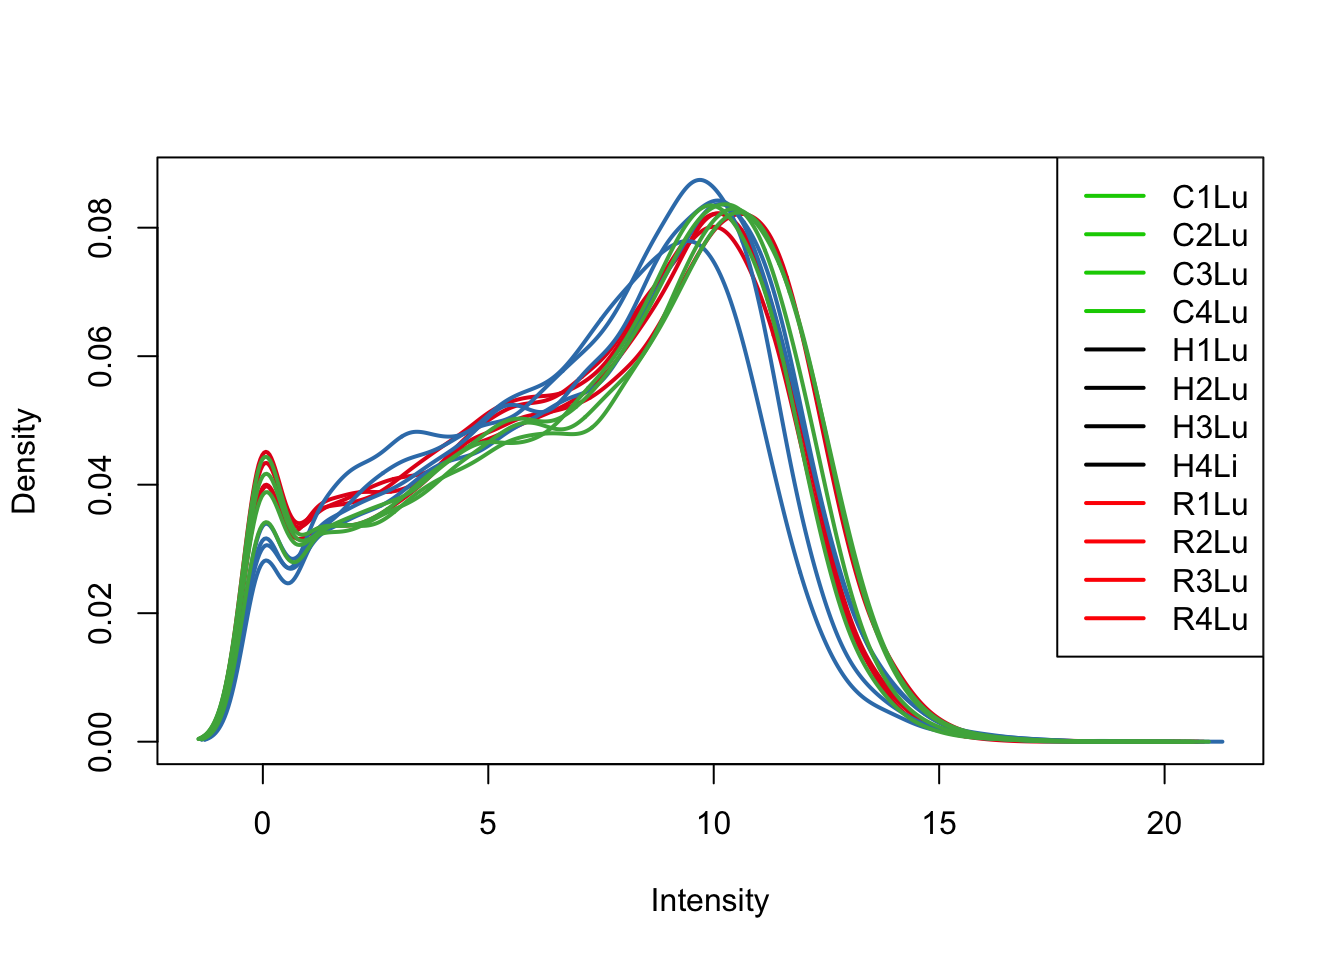
# Look at all tissues in each species
col = as.data.frame(pal[as.numeric(samples$Tissue)])

plotDensities(log_counts_genes[,1:16], col=col[1:16, ], legend="topright")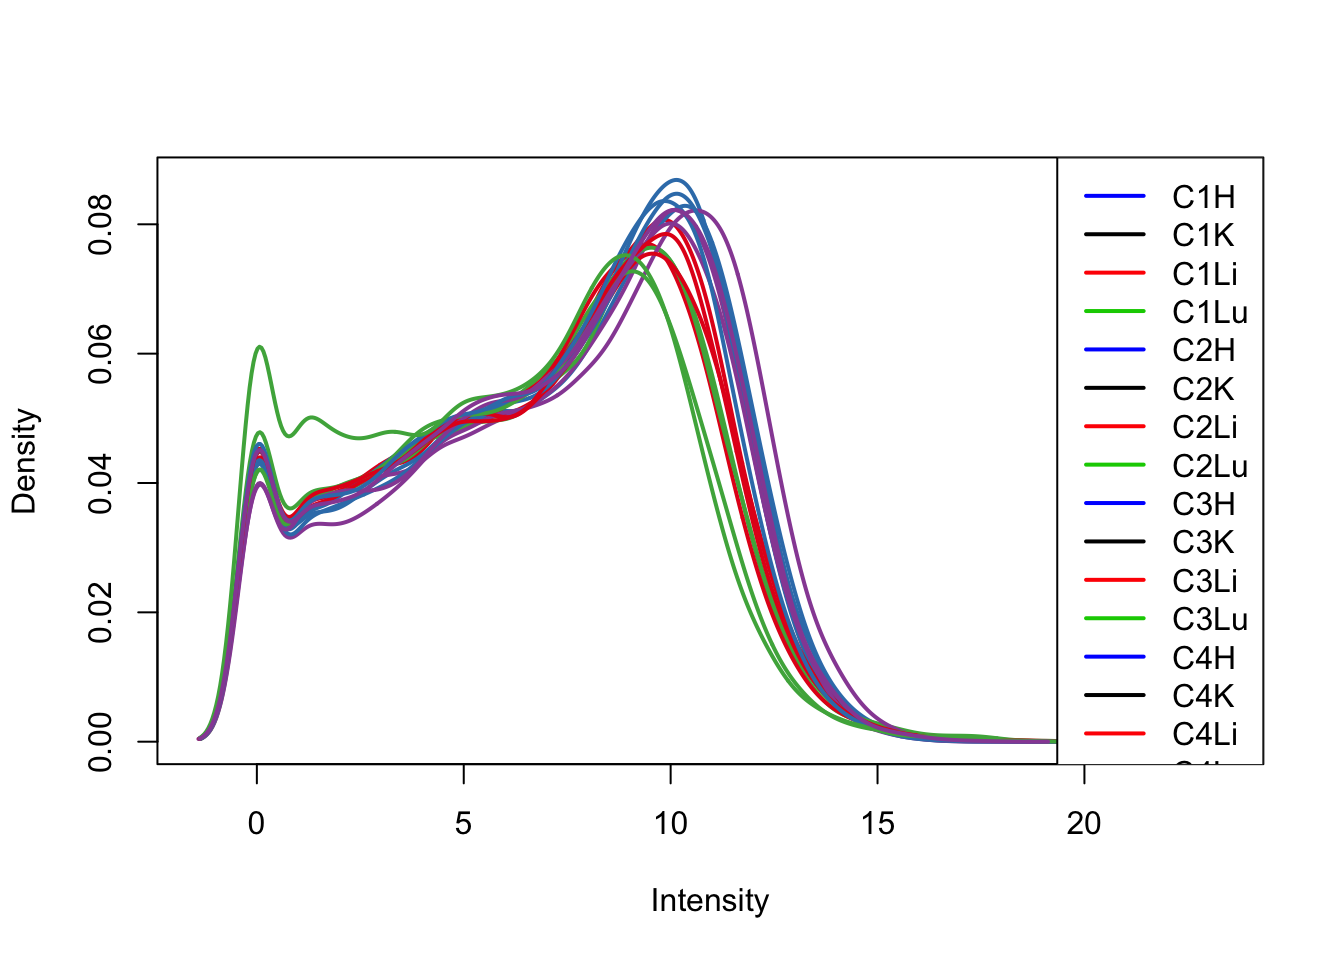
plotDensities(log_counts_genes[,17:32], col=col[17:32, ], legend="topright")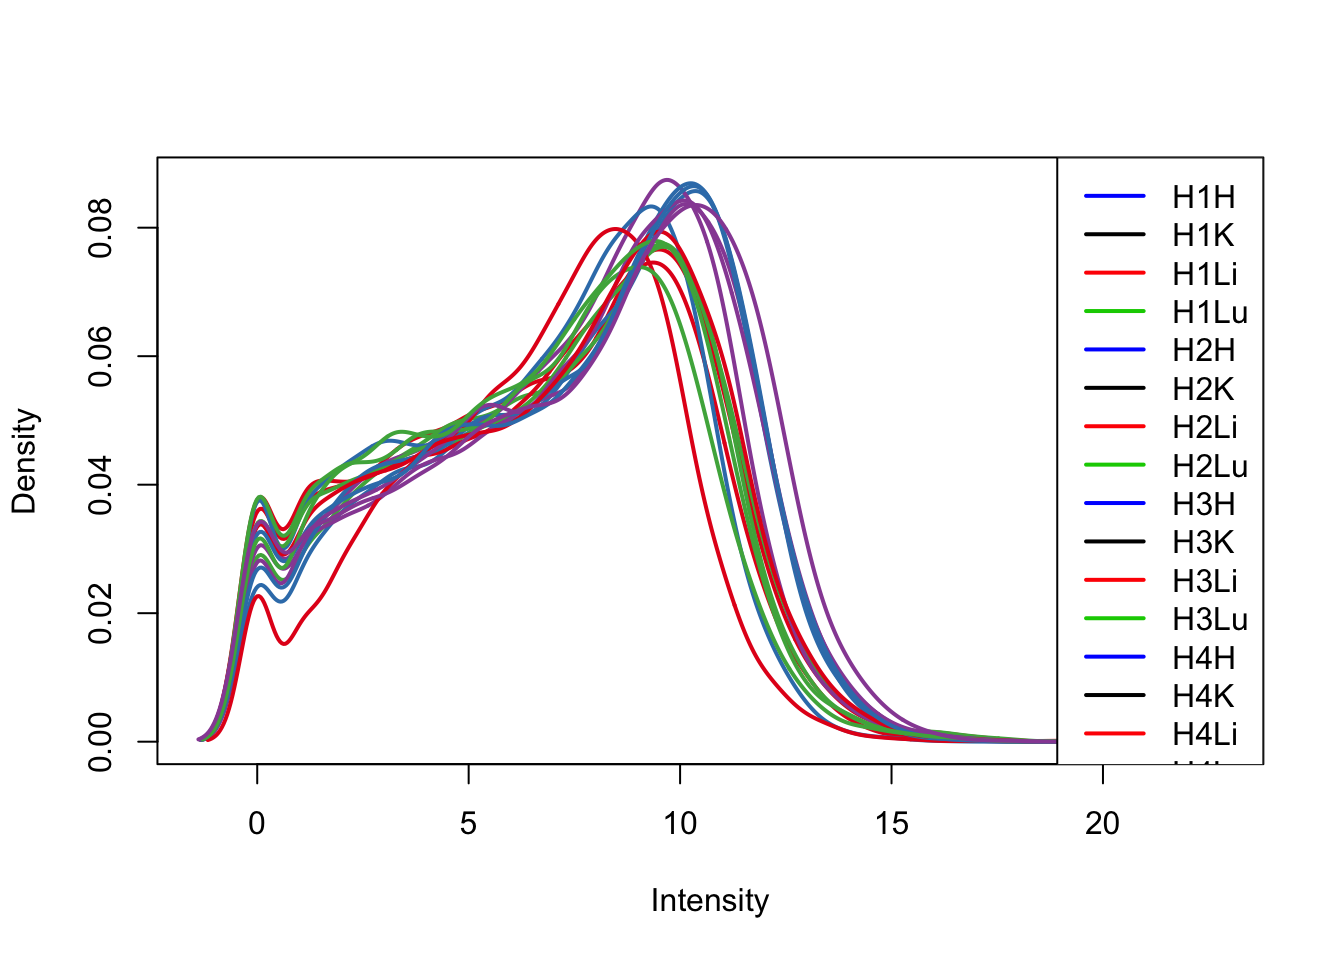
plotDensities(log_counts_genes[,33:48], col=col[33:48, ], legend="topright")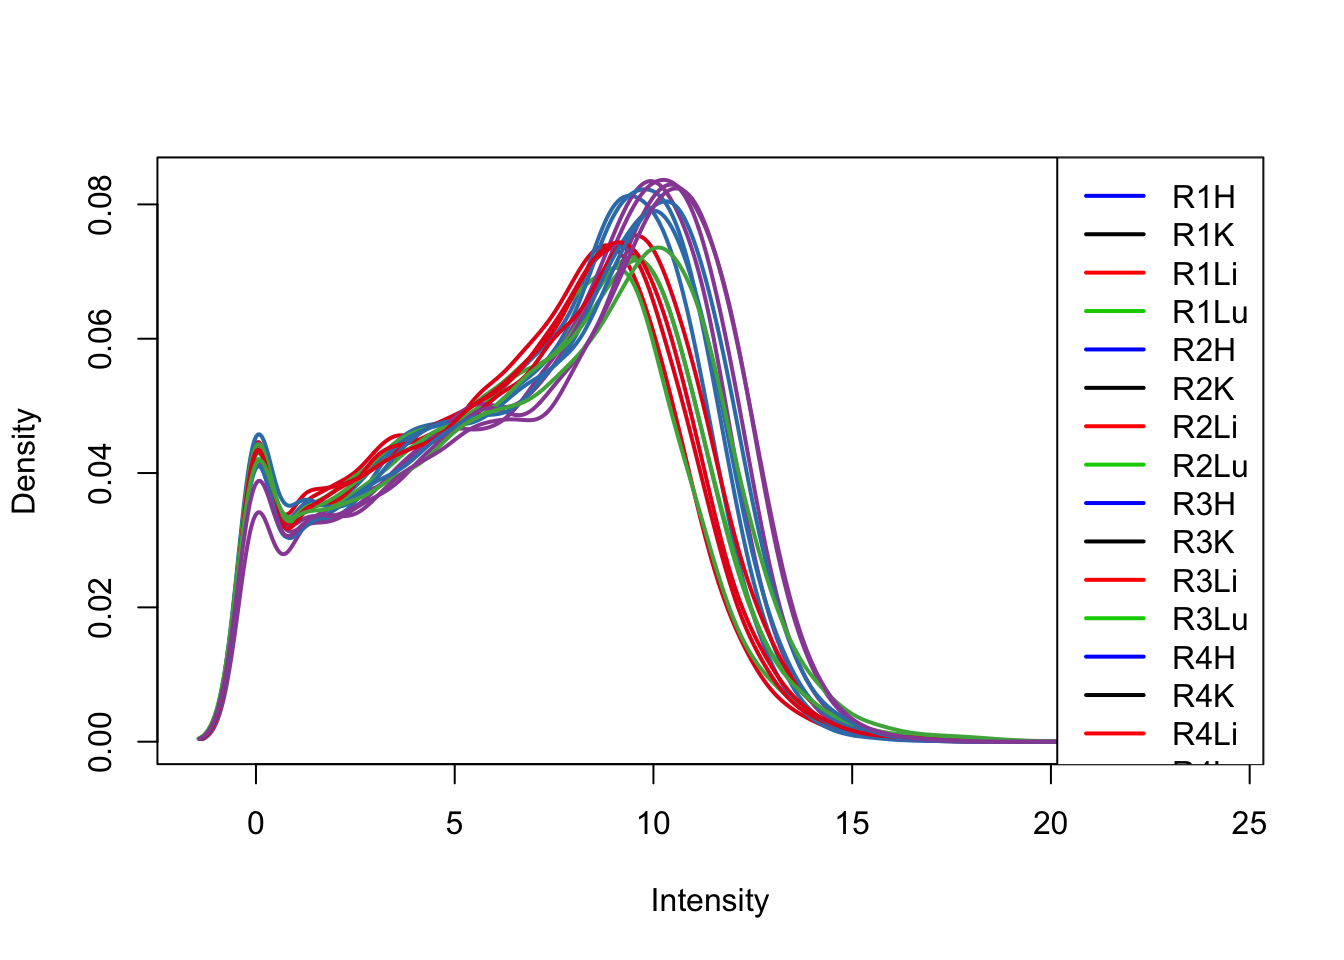
log2(CPM)
cpm <- cpm(counts_genes, log=TRUE)
head(cpm)
## C1H C1K C1Li C1Lu C2H
## ENSG00000000003 4.564233 6.789813 7.694441 5.773165 4.4726734
## ENSG00000000005 2.412927 -1.244922 -1.959985 -3.017812 0.4520966
## ENSG00000000419 5.837153 5.523265 5.371259 5.770149 5.4670113
## ENSG00000000457 4.555262 5.520025 5.336291 5.264139 4.6200607
## ENSG00000000460 1.502012 2.174569 1.515462 2.600163 1.4472195
## ENSG00000000938 5.606913 4.124798 4.525030 7.842364 2.3194663
## C2K C2Li C2Lu C3H C3K
## ENSG00000000003 6.4669354 7.304196 4.912173 4.660650 6.8047482
## ENSG00000000005 -0.8965488 -2.731302 -1.691078 -1.564830 0.3681473
## ENSG00000000419 5.4907323 5.088292 5.547574 5.421215 5.5778059
## ENSG00000000457 5.6797526 5.820056 5.333629 4.363949 5.6026369
## ENSG00000000460 2.3578775 1.601344 2.370642 1.326532 1.8589657
## ENSG00000000938 4.5683827 4.663360 8.431227 4.710417 4.6218065
## C3Li C3Lu C4H C4K C4Li C4Lu
## ENSG00000000003 7.030339 6.248752 4.177820 6.829993 7.655935 5.802391
## ENSG00000000005 -4.372920 -3.440579 3.790089 -1.156918 -4.284858 -2.109757
## ENSG00000000419 5.659722 5.969468 5.727458 5.584174 5.083884 5.693946
## ENSG00000000457 5.744087 5.541725 4.587350 5.349447 5.799782 5.635966
## ENSG00000000460 1.591935 2.496838 1.398885 2.152351 1.411153 2.848369
## ENSG00000000938 4.450615 7.533144 3.581034 3.947330 3.782970 8.089986
## H1H H1K H1Li H1Lu H2H H2K
## ENSG00000000003 6.265972 7.273215 6.015802 5.452655 3.659762 7.5802425
## ENSG00000000005 -6.758868 5.321511 -6.758868 -1.815873 -3.935356 0.8394441
## ENSG00000000419 5.639117 5.996667 5.522744 6.164538 5.584985 5.8363059
## ENSG00000000457 4.774197 4.693423 4.393684 4.855725 3.385361 4.5329953
## ENSG00000000460 4.613997 3.174875 4.429190 3.671471 1.870941 2.3524392
## ENSG00000000938 3.947240 4.467732 3.919882 8.231888 5.538700 4.1147845
## H2Li H2Lu H3H H3K H3Li
## ENSG00000000003 6.608150 4.459975 3.5039978 7.4343966 7.237241
## ENSG00000000005 -6.758868 -6.758868 -6.7588684 0.4219297 -6.758868
## ENSG00000000419 5.807652 5.592389 5.7112724 6.1977404 5.718164
## ENSG00000000457 4.420058 4.480725 4.4010065 5.0655337 4.495164
## ENSG00000000460 2.627178 2.831689 -0.1149462 3.3331039 2.739612
## ENSG00000000938 5.959507 7.247870 4.0572218 2.9855411 5.242440
## H3Lu H4H H4K H4Li H4Lu
## ENSG00000000003 5.505916 4.140116 6.68759194 6.352921 4.840593
## ENSG00000000005 -6.758868 -3.029836 -0.04309948 -6.758868 -4.032121
## ENSG00000000419 5.225654 6.100413 5.92387644 5.596977 5.727622
## ENSG00000000457 4.214922 3.168382 4.40317072 4.938968 4.550754
## ENSG00000000460 2.672800 1.486298 2.29833654 2.900790 2.981219
## ENSG00000000938 7.128595 4.774406 4.13651206 6.661918 8.626265
## R1H R1K R1Li R1Lu R2H
## ENSG00000000003 4.0140571 7.214370 7.348500 6.314288 4.323540
## ENSG00000000005 -6.7588684 -6.758868 -4.336084 -2.520248 -3.190336
## ENSG00000000419 5.1216748 5.673236 4.840308 5.285743 4.993661
## ENSG00000000457 3.9429078 5.306239 4.158047 5.236055 4.009887
## ENSG00000000460 0.9433609 1.835933 -1.144673 2.878777 1.115058
## ENSG00000000938 1.4957372 2.845279 2.819237 6.914082 2.025755
## R2K R2Li R2Lu R3H R3K
## ENSG00000000003 7.433444 7.7041221 6.093623 4.139888 7.337622
## ENSG00000000005 -2.052171 -2.1130703 -4.529840 -4.490910 -4.332980
## ENSG00000000419 5.343035 4.7871522 5.320362 5.133729 5.538911
## ENSG00000000457 5.454042 4.5751901 5.704555 3.912325 5.311336
## ENSG00000000460 1.618307 0.5650698 2.833271 1.328409 2.045608
## ENSG00000000938 2.980647 2.7370070 7.022367 2.541959 2.438501
## R3Li R3Lu R4H R4K R4Li
## ENSG00000000003 7.196496 5.890311 4.5640628 7.294732 6.9008780
## ENSG00000000005 -4.008903 -3.404423 -2.7768148 -1.860417 -5.1464301
## ENSG00000000419 4.984542 5.392903 5.0988865 5.415999 4.6598892
## ENSG00000000457 4.353890 5.602235 4.1812679 5.344557 4.5139560
## ENSG00000000460 0.412811 3.013578 0.7612432 1.709171 0.7331316
## ENSG00000000938 2.631430 7.282752 2.1468329 2.510574 3.7052381
## R4Lu
## ENSG00000000003 5.760683
## ENSG00000000005 -6.758868
## ENSG00000000419 5.441185
## ENSG00000000457 5.227764
## ENSG00000000460 3.246643
## ENSG00000000938 7.234341# Look at all species for each tissue
col = as.data.frame(pal[as.numeric(samples$Species)])
plotDensities(cpm[,all_hearts], col=col[all_hearts, ], legend="topright")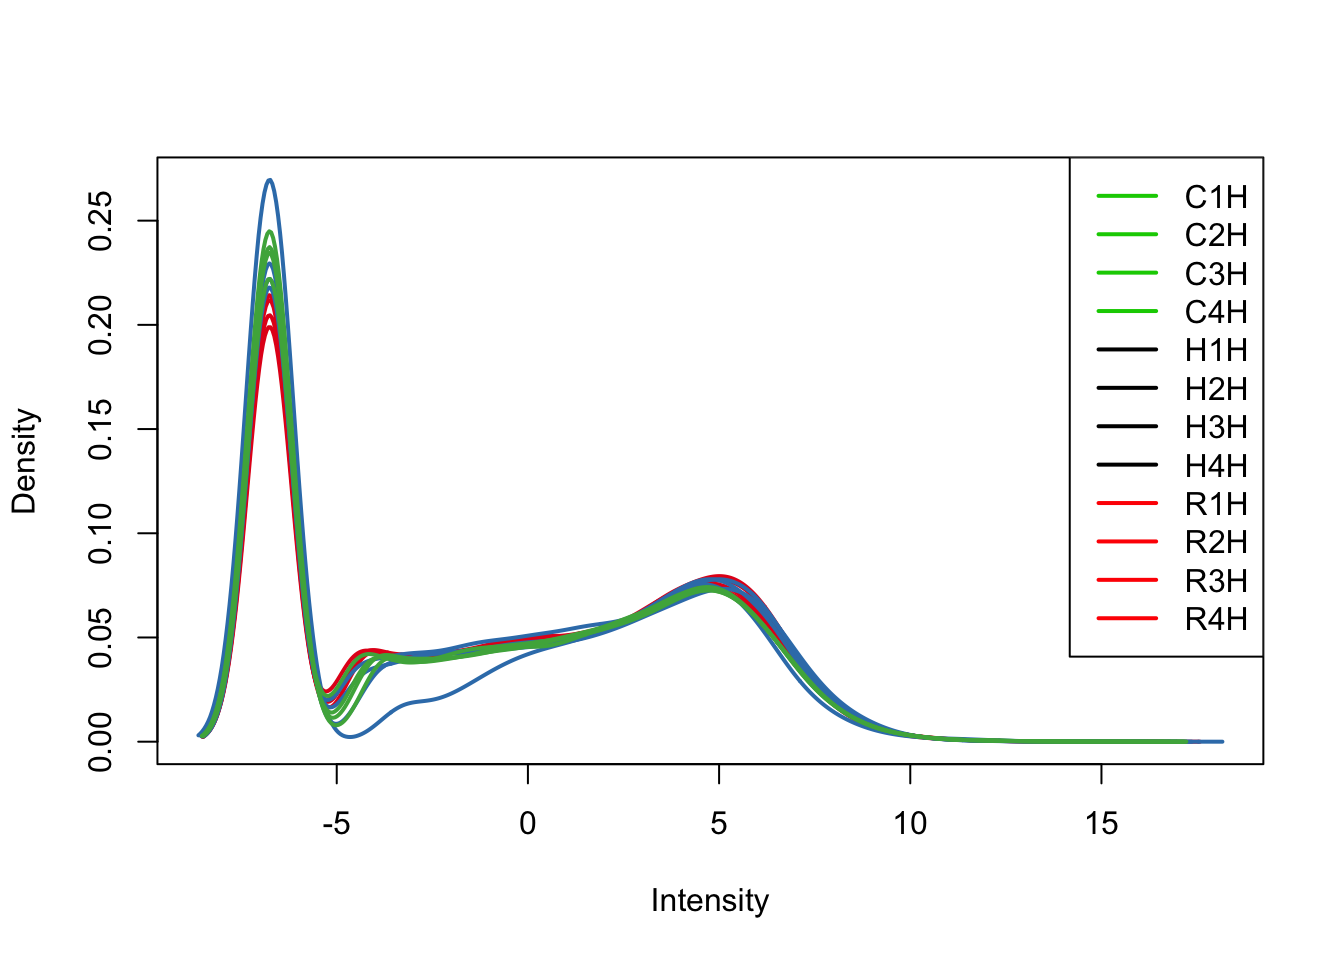
plotDensities(cpm[,all_kidneys], col=col[all_kidneys, ], legend="topright")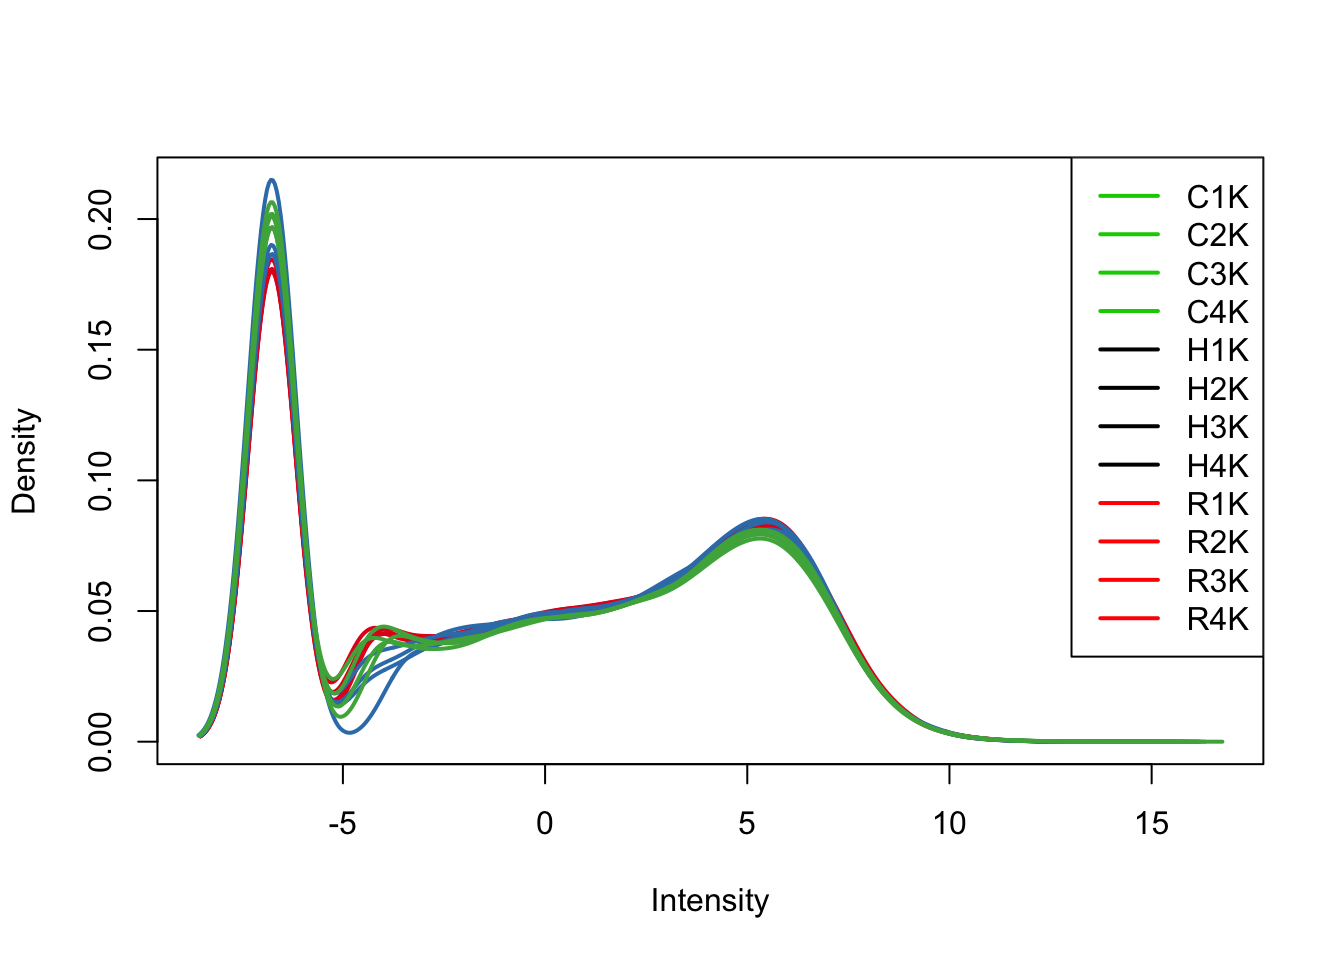
plotDensities(cpm[,all_livers], col=col[all_livers, ], legend="topright")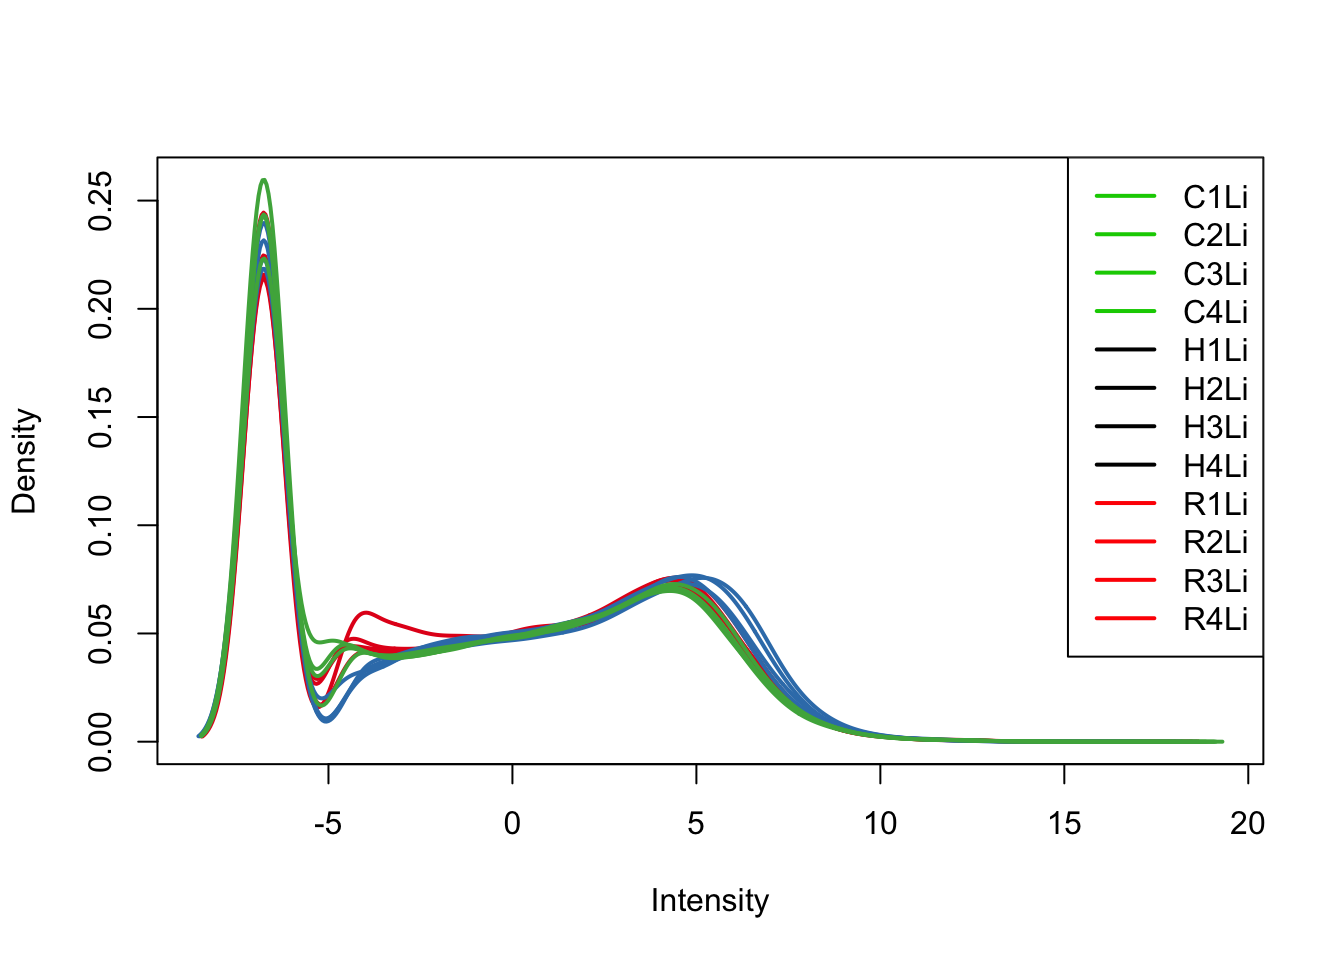
plotDensities(cpm[,all_lungs], col=col[all_lungs, ], legend="topright")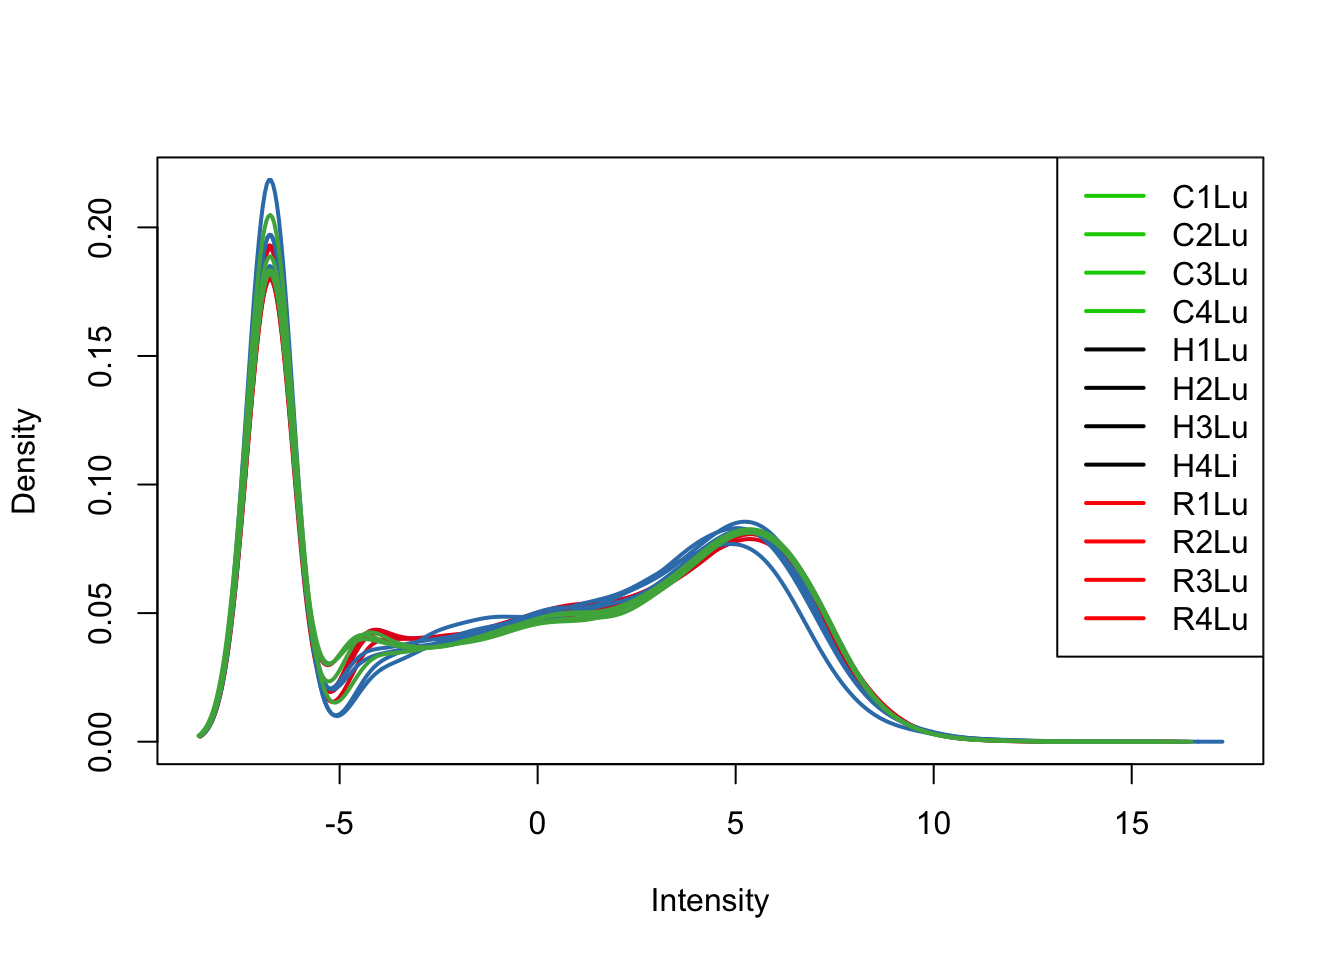
# Look at all tissues in each species
col = as.data.frame(pal[as.numeric(samples$Tissue)])

plotDensities(cpm[,1:16], col=col[1:16, ], legend="topright")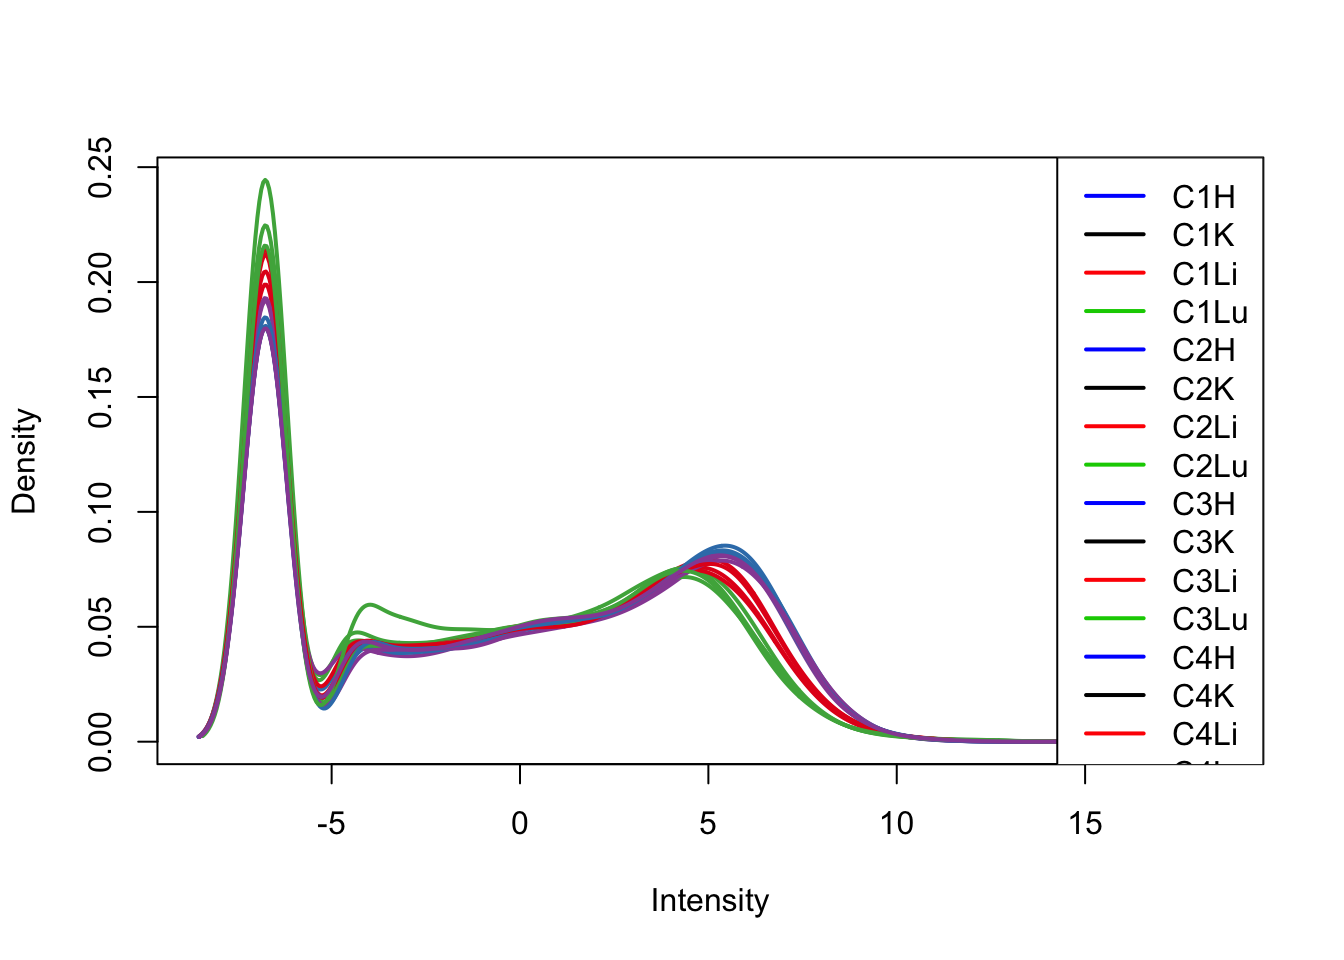
plotDensities(cpm[,17:32], col=col[17:32, ], legend="topright")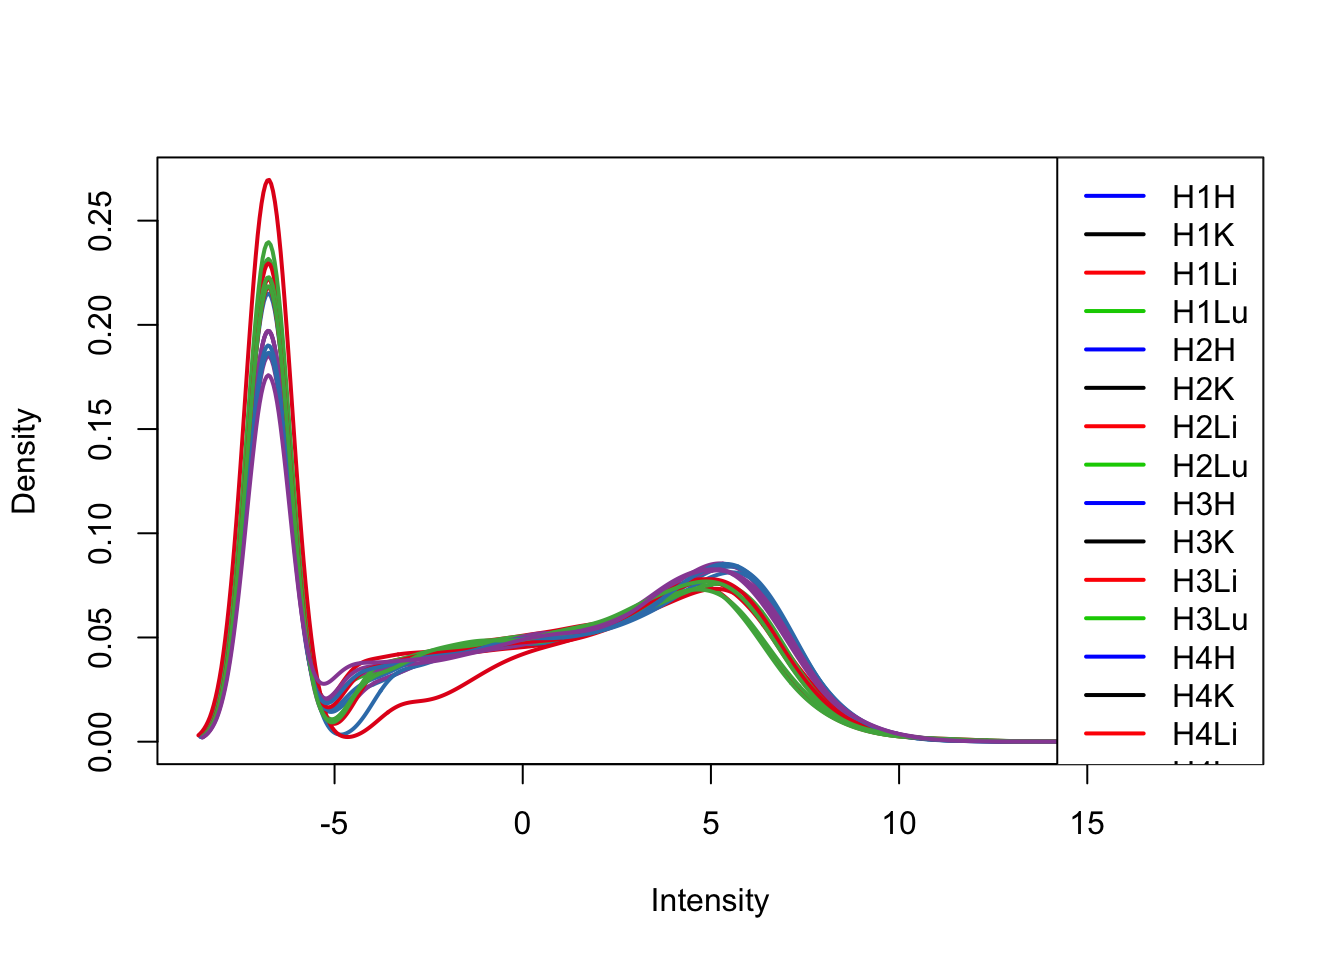
plotDensities(cpm[,33:48], col=col[33:48, ], legend="topright")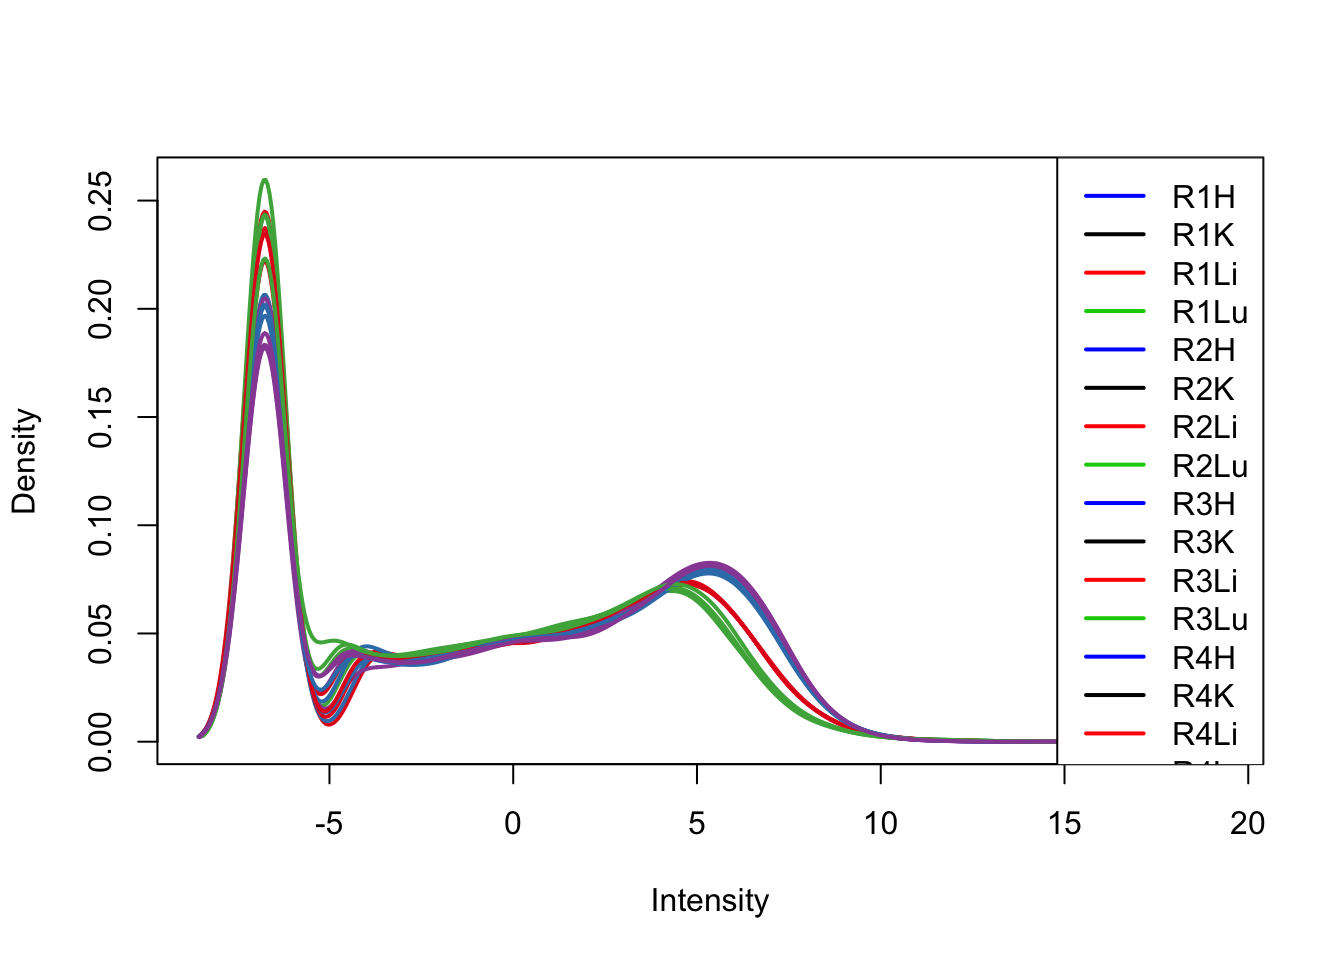
TMM/log2(CPM)
## Create edgeR object (dge) to calculate TMM normalization
dge_original <- DGEList(counts=as.matrix(counts_genes), genes=rownames(counts_genes), group = as.character(t(labels)))
dge_original <- calcNormFactors(dge_original)

tmm_cpm <- cpm(dge_original, normalized.lib.sizes=TRUE, log=TRUE, prior.count = 0.25)
head(cpm)
## C1H C1K C1Li C1Lu C2H
## ENSG00000000003 4.564233 6.789813 7.694441 5.773165 4.4726734
## ENSG00000000005 2.412927 -1.244922 -1.959985 -3.017812 0.4520966
## ENSG00000000419 5.837153 5.523265 5.371259 5.770149 5.4670113
## ENSG00000000457 4.555262 5.520025 5.336291 5.264139 4.6200607
## ENSG00000000460 1.502012 2.174569 1.515462 2.600163 1.4472195
## ENSG00000000938 5.606913 4.124798 4.525030 7.842364 2.3194663
## C2K C2Li C2Lu C3H C3K
## ENSG00000000003 6.4669354 7.304196 4.912173 4.660650 6.8047482
## ENSG00000000005 -0.8965488 -2.731302 -1.691078 -1.564830 0.3681473
## ENSG00000000419 5.4907323 5.088292 5.547574 5.421215 5.5778059
## ENSG00000000457 5.6797526 5.820056 5.333629 4.363949 5.6026369
## ENSG00000000460 2.3578775 1.601344 2.370642 1.326532 1.8589657
## ENSG00000000938 4.5683827 4.663360 8.431227 4.710417 4.6218065
## C3Li C3Lu C4H C4K C4Li C4Lu
## ENSG00000000003 7.030339 6.248752 4.177820 6.829993 7.655935 5.802391
## ENSG00000000005 -4.372920 -3.440579 3.790089 -1.156918 -4.284858 -2.109757
## ENSG00000000419 5.659722 5.969468 5.727458 5.584174 5.083884 5.693946
## ENSG00000000457 5.744087 5.541725 4.587350 5.349447 5.799782 5.635966
## ENSG00000000460 1.591935 2.496838 1.398885 2.152351 1.411153 2.848369
## ENSG00000000938 4.450615 7.533144 3.581034 3.947330 3.782970 8.089986
## H1H H1K H1Li H1Lu H2H H2K
## ENSG00000000003 6.265972 7.273215 6.015802 5.452655 3.659762 7.5802425
## ENSG00000000005 -6.758868 5.321511 -6.758868 -1.815873 -3.935356 0.8394441
## ENSG00000000419 5.639117 5.996667 5.522744 6.164538 5.584985 5.8363059
## ENSG00000000457 4.774197 4.693423 4.393684 4.855725 3.385361 4.5329953
## ENSG00000000460 4.613997 3.174875 4.429190 3.671471 1.870941 2.3524392
## ENSG00000000938 3.947240 4.467732 3.919882 8.231888 5.538700 4.1147845
## H2Li H2Lu H3H H3K H3Li
## ENSG00000000003 6.608150 4.459975 3.5039978 7.4343966 7.237241
## ENSG00000000005 -6.758868 -6.758868 -6.7588684 0.4219297 -6.758868
## ENSG00000000419 5.807652 5.592389 5.7112724 6.1977404 5.718164
## ENSG00000000457 4.420058 4.480725 4.4010065 5.0655337 4.495164
## ENSG00000000460 2.627178 2.831689 -0.1149462 3.3331039 2.739612
## ENSG00000000938 5.959507 7.247870 4.0572218 2.9855411 5.242440
## H3Lu H4H H4K H4Li H4Lu
## ENSG00000000003 5.505916 4.140116 6.68759194 6.352921 4.840593
## ENSG00000000005 -6.758868 -3.029836 -0.04309948 -6.758868 -4.032121
## ENSG00000000419 5.225654 6.100413 5.92387644 5.596977 5.727622
## ENSG00000000457 4.214922 3.168382 4.40317072 4.938968 4.550754
## ENSG00000000460 2.672800 1.486298 2.29833654 2.900790 2.981219
## ENSG00000000938 7.128595 4.774406 4.13651206 6.661918 8.626265
## R1H R1K R1Li R1Lu R2H
## ENSG00000000003 4.0140571 7.214370 7.348500 6.314288 4.323540
## ENSG00000000005 -6.7588684 -6.758868 -4.336084 -2.520248 -3.190336
## ENSG00000000419 5.1216748 5.673236 4.840308 5.285743 4.993661
## ENSG00000000457 3.9429078 5.306239 4.158047 5.236055 4.009887
## ENSG00000000460 0.9433609 1.835933 -1.144673 2.878777 1.115058
## ENSG00000000938 1.4957372 2.845279 2.819237 6.914082 2.025755
## R2K R2Li R2Lu R3H R3K
## ENSG00000000003 7.433444 7.7041221 6.093623 4.139888 7.337622
## ENSG00000000005 -2.052171 -2.1130703 -4.529840 -4.490910 -4.332980
## ENSG00000000419 5.343035 4.7871522 5.320362 5.133729 5.538911
## ENSG00000000457 5.454042 4.5751901 5.704555 3.912325 5.311336
## ENSG00000000460 1.618307 0.5650698 2.833271 1.328409 2.045608
## ENSG00000000938 2.980647 2.7370070 7.022367 2.541959 2.438501
## R3Li R3Lu R4H R4K R4Li
## ENSG00000000003 7.196496 5.890311 4.5640628 7.294732 6.9008780
## ENSG00000000005 -4.008903 -3.404423 -2.7768148 -1.860417 -5.1464301
## ENSG00000000419 4.984542 5.392903 5.0988865 5.415999 4.6598892
## ENSG00000000457 4.353890 5.602235 4.1812679 5.344557 4.5139560
## ENSG00000000460 0.412811 3.013578 0.7612432 1.709171 0.7331316
## ENSG00000000938 2.631430 7.282752 2.1468329 2.510574 3.7052381
## R4Lu
## ENSG00000000003 5.760683
## ENSG00000000005 -6.758868
## ENSG00000000419 5.441185
## ENSG00000000457 5.227764
## ENSG00000000460 3.246643
## ENSG00000000938 7.234341# Plot library size
boxplot_library_size <- ggplot(dge_original$samples, aes(x = samples$Tissue, y = dge_original$samples$lib.size, fill = samples$Species)) + geom_boxplot()
boxplot_library_size + labs(title = "Library size by tissue") + labs(y = "Library size") + labs(x = "Tissues") + guides(fill=guide_legend(title="Species"))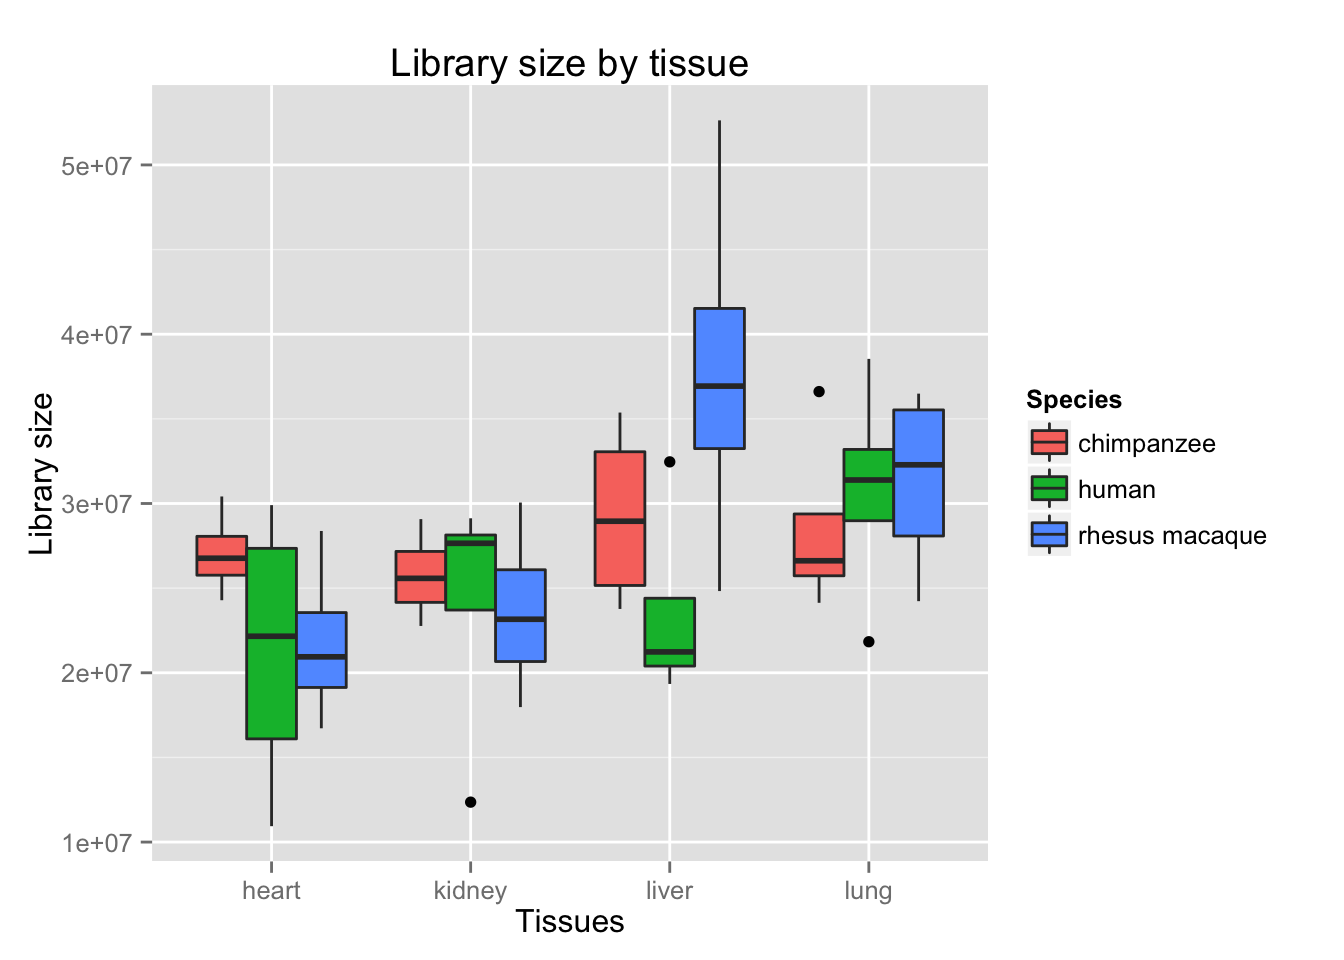
col = as.data.frame(pal[as.numeric(samples$Species)])

plotDensities(tmm_cpm[,all_hearts], col=col[all_hearts, ], legend="topright")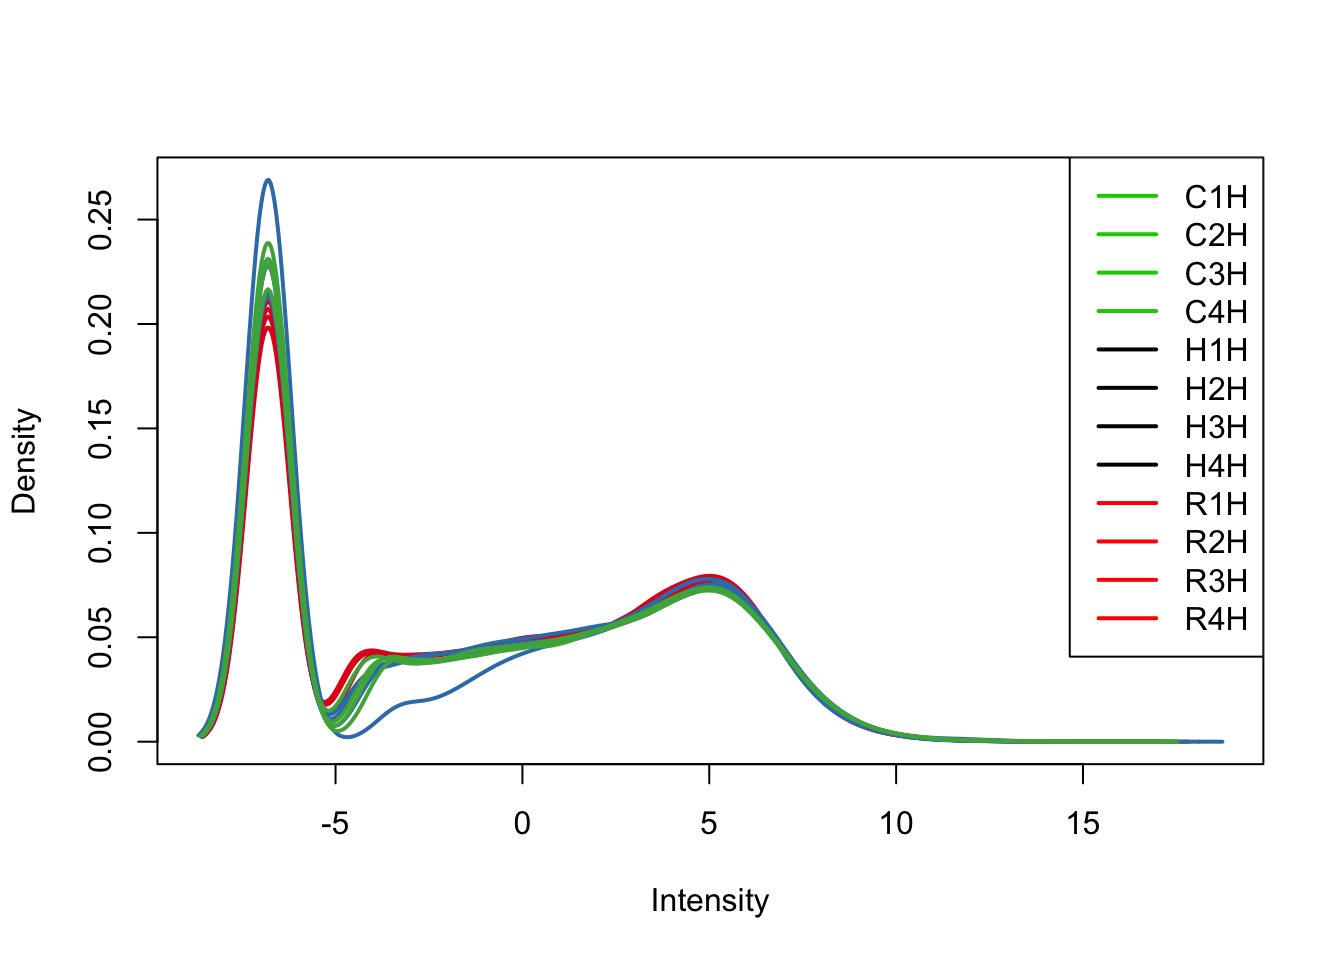
plotDensities(tmm_cpm[,all_kidneys], col=col[all_kidneys, ], legend="topright")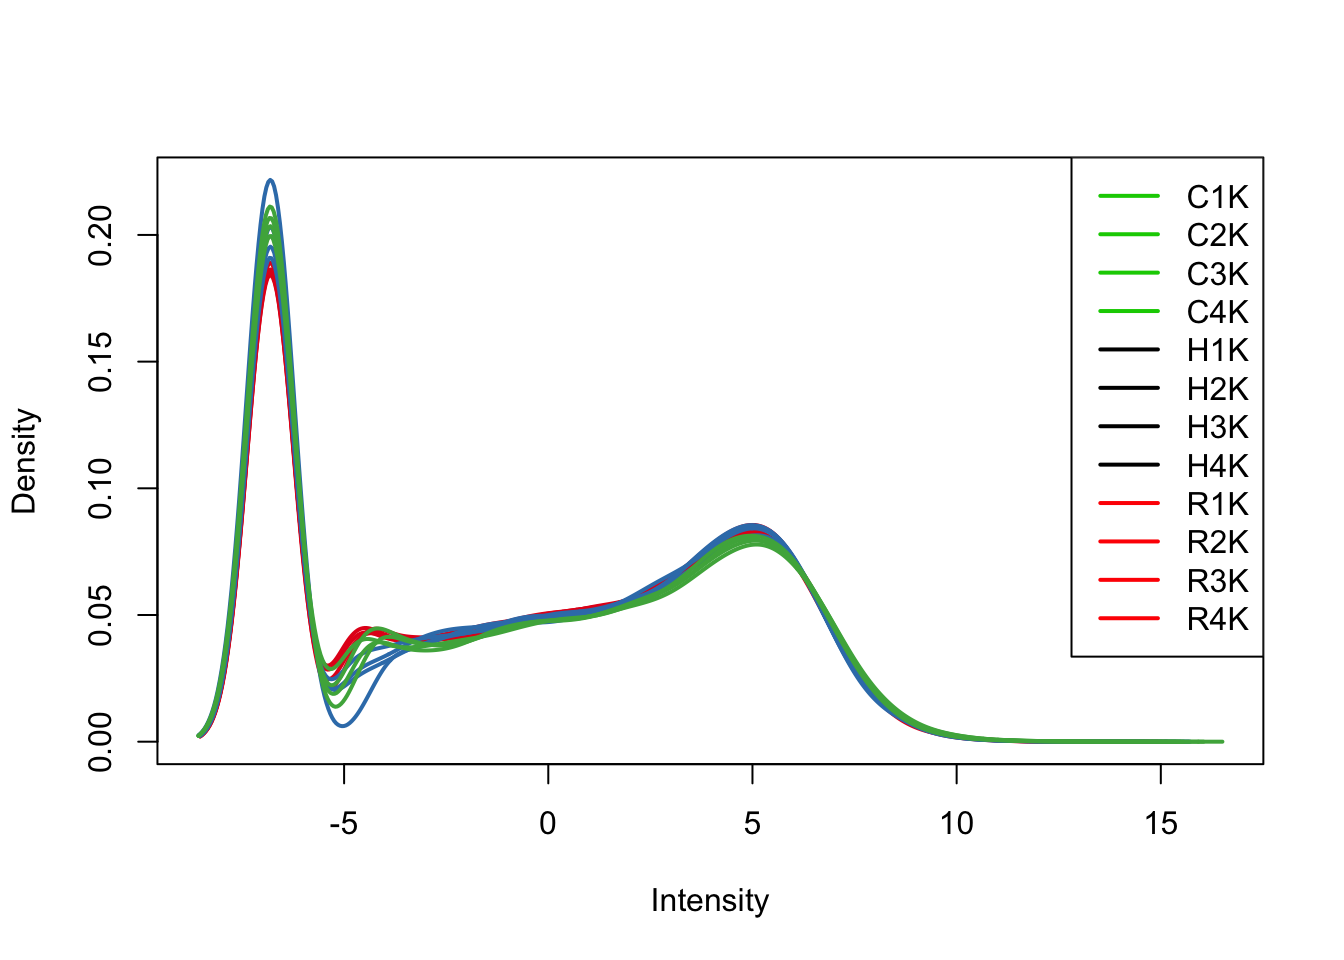
plotDensities(tmm_cpm[,all_livers], col=col[all_livers, ], legend="topright")
plotDensities(tmm_cpm[,all_lungs], col=col[all_lungs, ], legend="topright")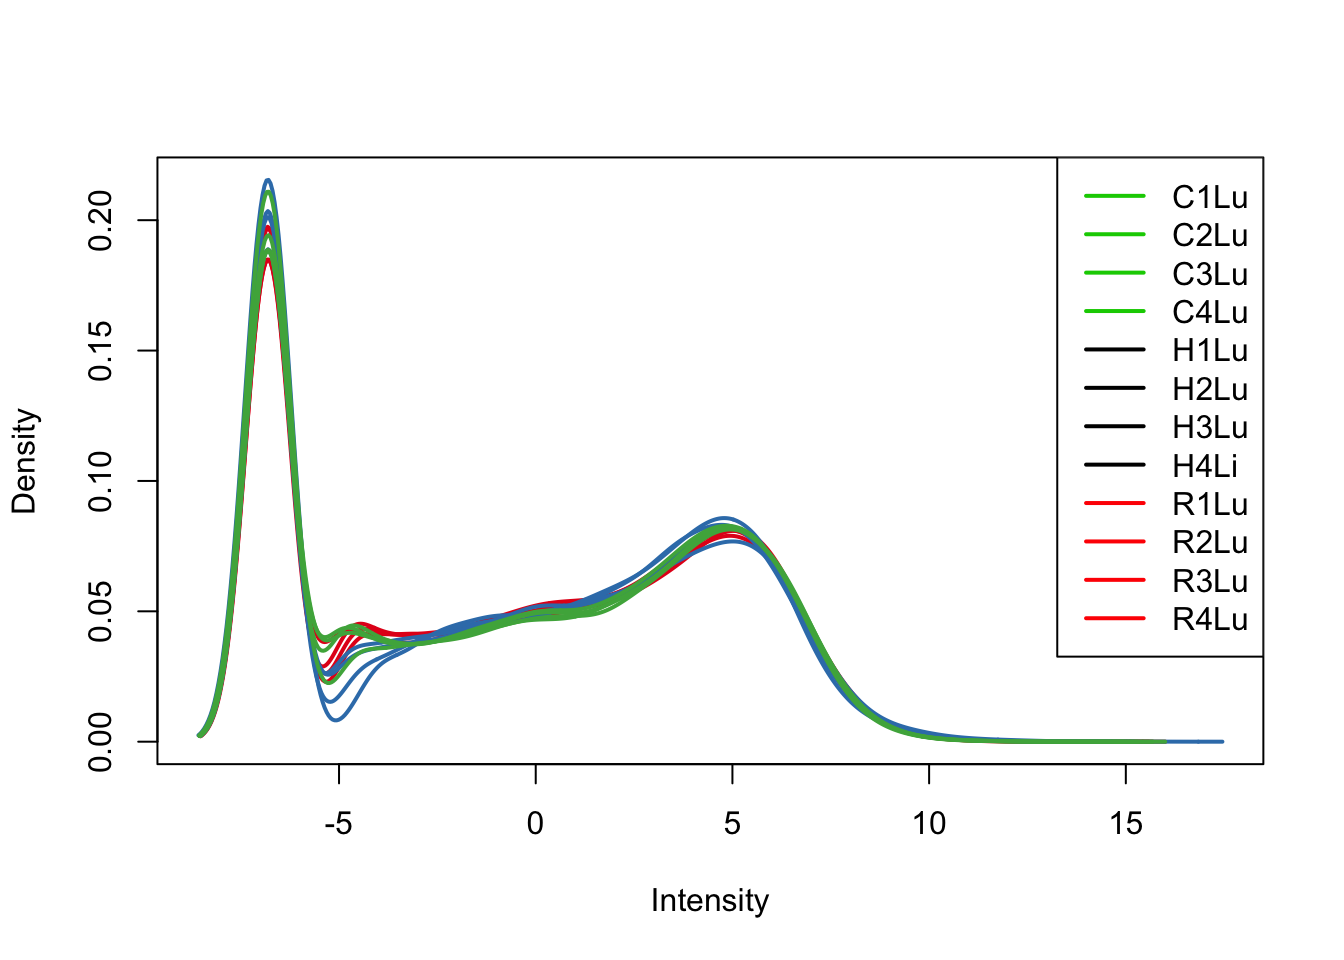
# Look at all tissues in each species
col = as.data.frame(pal[as.numeric(samples$Tissue)])

plotDensities(tmm_cpm[,1:16], col=col[1:16, ], legend="topright")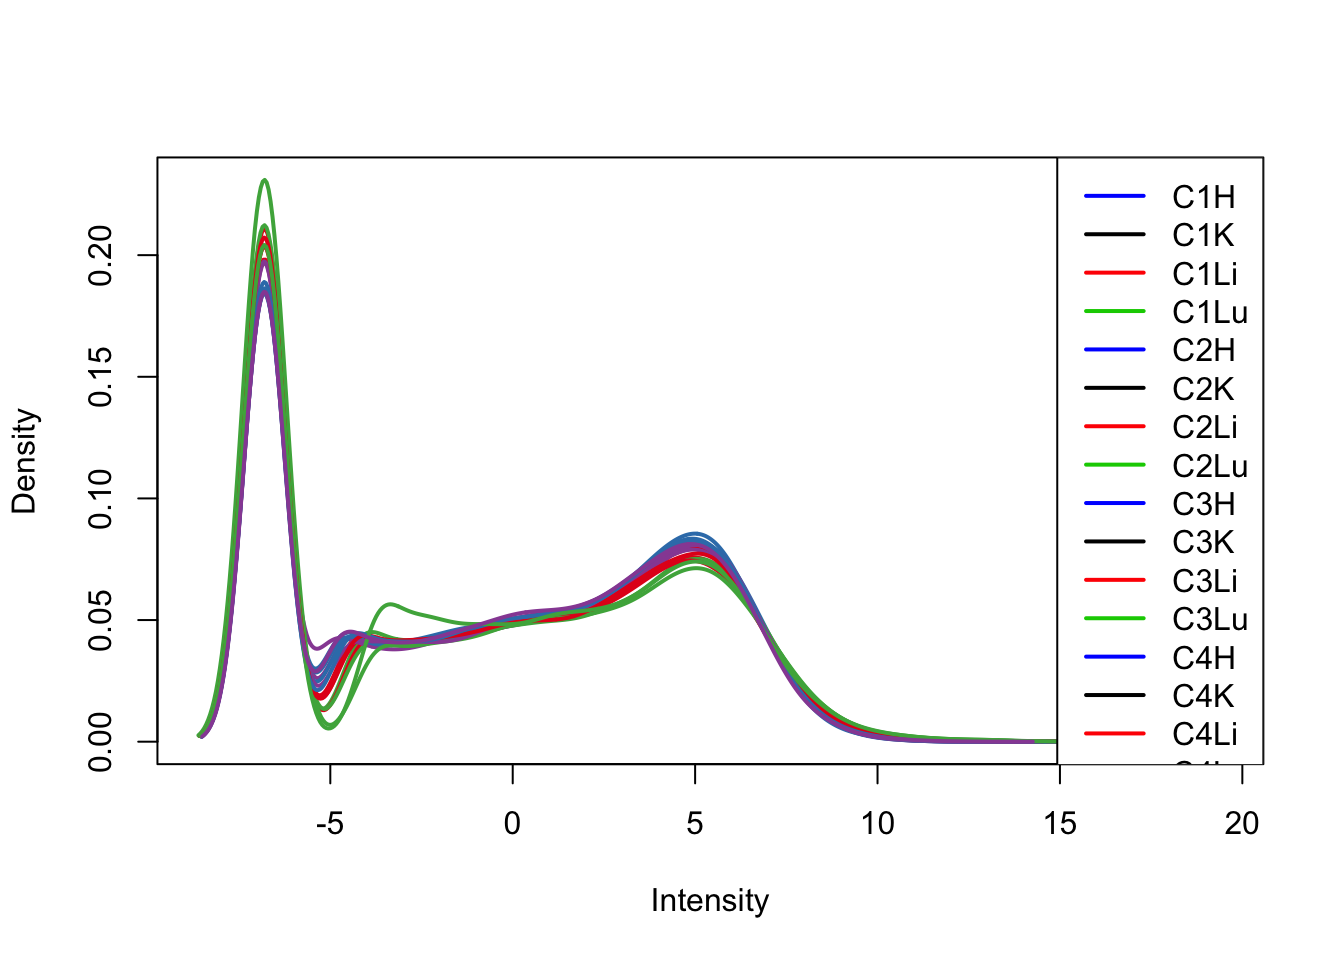
plotDensities(tmm_cpm[,17:32], col=col[17:32, ], legend="topright")
plotDensities(tmm_cpm[,33:48], col=col[33:48, ], legend="topright")
TMM/log2(CPM) with H1H Removed
We can see from the data that H1H doesn’t look like the other (human) hearts. We will remove it here.
# Remove H1H

dge <- dge_original[,-17]
labels <- as.data.frame(labels)
labels_47 <- labels[-17,]
labels_47 <- as.character(labels_47)

species <- as.data.frame(samples$Species)
tissues <- as.data.frame(samples$Tissue)

boxplot_library_size <- ggplot(dge$samples, aes(x = tissues[-17,], y = dge$samples$lib.size, fill = species[-17,])) + geom_boxplot()

boxplot_library_size + labs(title = "Library size by tissue") + labs(y = "Library size") + labs(x = "Tissues") + guides(fill=guide_legend(title="Species"))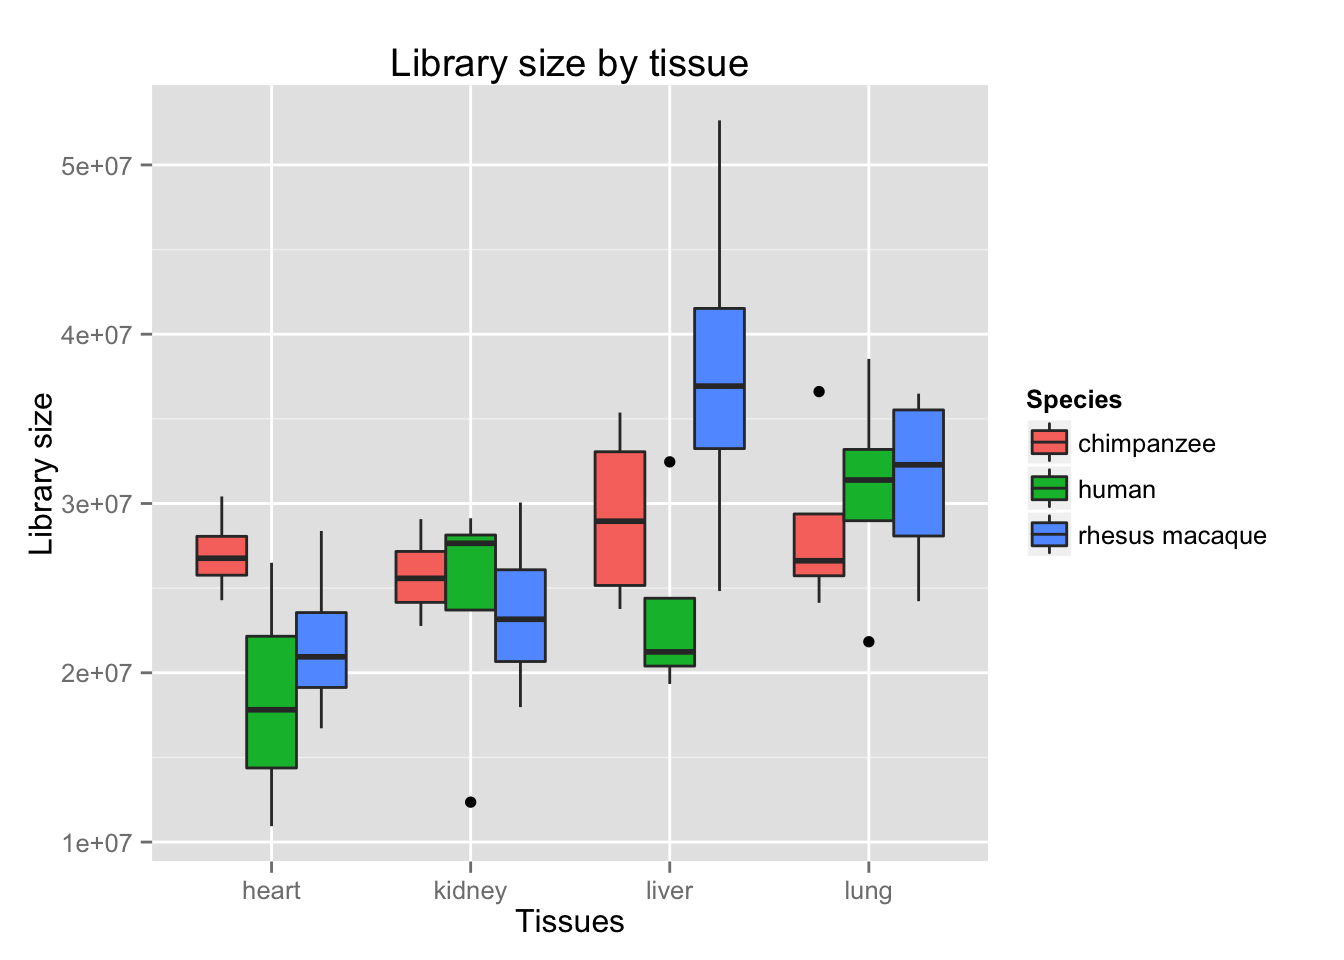
# Update these values (because H1H was dropped)

all_hearts <- c(1,5,9,13,20,24,28,32,36,40,44)
all_kidneys <- c(2,6,10,14,17,21,25,29,33,37,41,45)
all_livers <- c(3,7,11,15,18,22,26,30,34,38,42,46)
all_lungs <- c(4,8,12,16,19,23,27,31,35,39,43,47)

tmm_cpm <- cpm(dge, normalized.lib.sizes=TRUE, log=TRUE, prior.count = 0.25)
head(cpm)
## C1H C1K C1Li C1Lu C2H
## ENSG00000000003 4.564233 6.789813 7.694441 5.773165 4.4726734
## ENSG00000000005 2.412927 -1.244922 -1.959985 -3.017812 0.4520966
## ENSG00000000419 5.837153 5.523265 5.371259 5.770149 5.4670113
## ENSG00000000457 4.555262 5.520025 5.336291 5.264139 4.6200607
## ENSG00000000460 1.502012 2.174569 1.515462 2.600163 1.4472195
## ENSG00000000938 5.606913 4.124798 4.525030 7.842364 2.3194663
## C2K C2Li C2Lu C3H C3K
## ENSG00000000003 6.4669354 7.304196 4.912173 4.660650 6.8047482
## ENSG00000000005 -0.8965488 -2.731302 -1.691078 -1.564830 0.3681473
## ENSG00000000419 5.4907323 5.088292 5.547574 5.421215 5.5778059
## ENSG00000000457 5.6797526 5.820056 5.333629 4.363949 5.6026369
## ENSG00000000460 2.3578775 1.601344 2.370642 1.326532 1.8589657
## ENSG00000000938 4.5683827 4.663360 8.431227 4.710417 4.6218065
## C3Li C3Lu C4H C4K C4Li C4Lu
## ENSG00000000003 7.030339 6.248752 4.177820 6.829993 7.655935 5.802391
## ENSG00000000005 -4.372920 -3.440579 3.790089 -1.156918 -4.284858 -2.109757
## ENSG00000000419 5.659722 5.969468 5.727458 5.584174 5.083884 5.693946
## ENSG00000000457 5.744087 5.541725 4.587350 5.349447 5.799782 5.635966
## ENSG00000000460 1.591935 2.496838 1.398885 2.152351 1.411153 2.848369
## ENSG00000000938 4.450615 7.533144 3.581034 3.947330 3.782970 8.089986
## H1H H1K H1Li H1Lu H2H H2K
## ENSG00000000003 6.265972 7.273215 6.015802 5.452655 3.659762 7.5802425
## ENSG00000000005 -6.758868 5.321511 -6.758868 -1.815873 -3.935356 0.8394441
## ENSG00000000419 5.639117 5.996667 5.522744 6.164538 5.584985 5.8363059
## ENSG00000000457 4.774197 4.693423 4.393684 4.855725 3.385361 4.5329953
## ENSG00000000460 4.613997 3.174875 4.429190 3.671471 1.870941 2.3524392
## ENSG00000000938 3.947240 4.467732 3.919882 8.231888 5.538700 4.1147845
## H2Li H2Lu H3H H3K H3Li
## ENSG00000000003 6.608150 4.459975 3.5039978 7.4343966 7.237241
## ENSG00000000005 -6.758868 -6.758868 -6.7588684 0.4219297 -6.758868
## ENSG00000000419 5.807652 5.592389 5.7112724 6.1977404 5.718164
## ENSG00000000457 4.420058 4.480725 4.4010065 5.0655337 4.495164
## ENSG00000000460 2.627178 2.831689 -0.1149462 3.3331039 2.739612
## ENSG00000000938 5.959507 7.247870 4.0572218 2.9855411 5.242440
## H3Lu H4H H4K H4Li H4Lu
## ENSG00000000003 5.505916 4.140116 6.68759194 6.352921 4.840593
## ENSG00000000005 -6.758868 -3.029836 -0.04309948 -6.758868 -4.032121
## ENSG00000000419 5.225654 6.100413 5.92387644 5.596977 5.727622
## ENSG00000000457 4.214922 3.168382 4.40317072 4.938968 4.550754
## ENSG00000000460 2.672800 1.486298 2.29833654 2.900790 2.981219
## ENSG00000000938 7.128595 4.774406 4.13651206 6.661918 8.626265
## R1H R1K R1Li R1Lu R2H
## ENSG00000000003 4.0140571 7.214370 7.348500 6.314288 4.323540
## ENSG00000000005 -6.7588684 -6.758868 -4.336084 -2.520248 -3.190336
## ENSG00000000419 5.1216748 5.673236 4.840308 5.285743 4.993661
## ENSG00000000457 3.9429078 5.306239 4.158047 5.236055 4.009887
## ENSG00000000460 0.9433609 1.835933 -1.144673 2.878777 1.115058
## ENSG00000000938 1.4957372 2.845279 2.819237 6.914082 2.025755
## R2K R2Li R2Lu R3H R3K
## ENSG00000000003 7.433444 7.7041221 6.093623 4.139888 7.337622
## ENSG00000000005 -2.052171 -2.1130703 -4.529840 -4.490910 -4.332980
## ENSG00000000419 5.343035 4.7871522 5.320362 5.133729 5.538911
## ENSG00000000457 5.454042 4.5751901 5.704555 3.912325 5.311336
## ENSG00000000460 1.618307 0.5650698 2.833271 1.328409 2.045608
## ENSG00000000938 2.980647 2.7370070 7.022367 2.541959 2.438501
## R3Li R3Lu R4H R4K R4Li
## ENSG00000000003 7.196496 5.890311 4.5640628 7.294732 6.9008780
## ENSG00000000005 -4.008903 -3.404423 -2.7768148 -1.860417 -5.1464301
## ENSG00000000419 4.984542 5.392903 5.0988865 5.415999 4.6598892
## ENSG00000000457 4.353890 5.602235 4.1812679 5.344557 4.5139560
## ENSG00000000460 0.412811 3.013578 0.7612432 1.709171 0.7331316
## ENSG00000000938 2.631430 7.282752 2.1468329 2.510574 3.7052381
## R4Lu
## ENSG00000000003 5.760683
## ENSG00000000005 -6.758868
## ENSG00000000419 5.441185
## ENSG00000000457 5.227764
## ENSG00000000460 3.246643
## ENSG00000000938 7.234341# Update the samples file so that H1H is deleted
samples <- samples[-17,]
col = as.data.frame(pal[as.numeric(samples$Species)])
plotDensities(tmm_cpm[,all_hearts], col=col[all_hearts, ], legend="topright")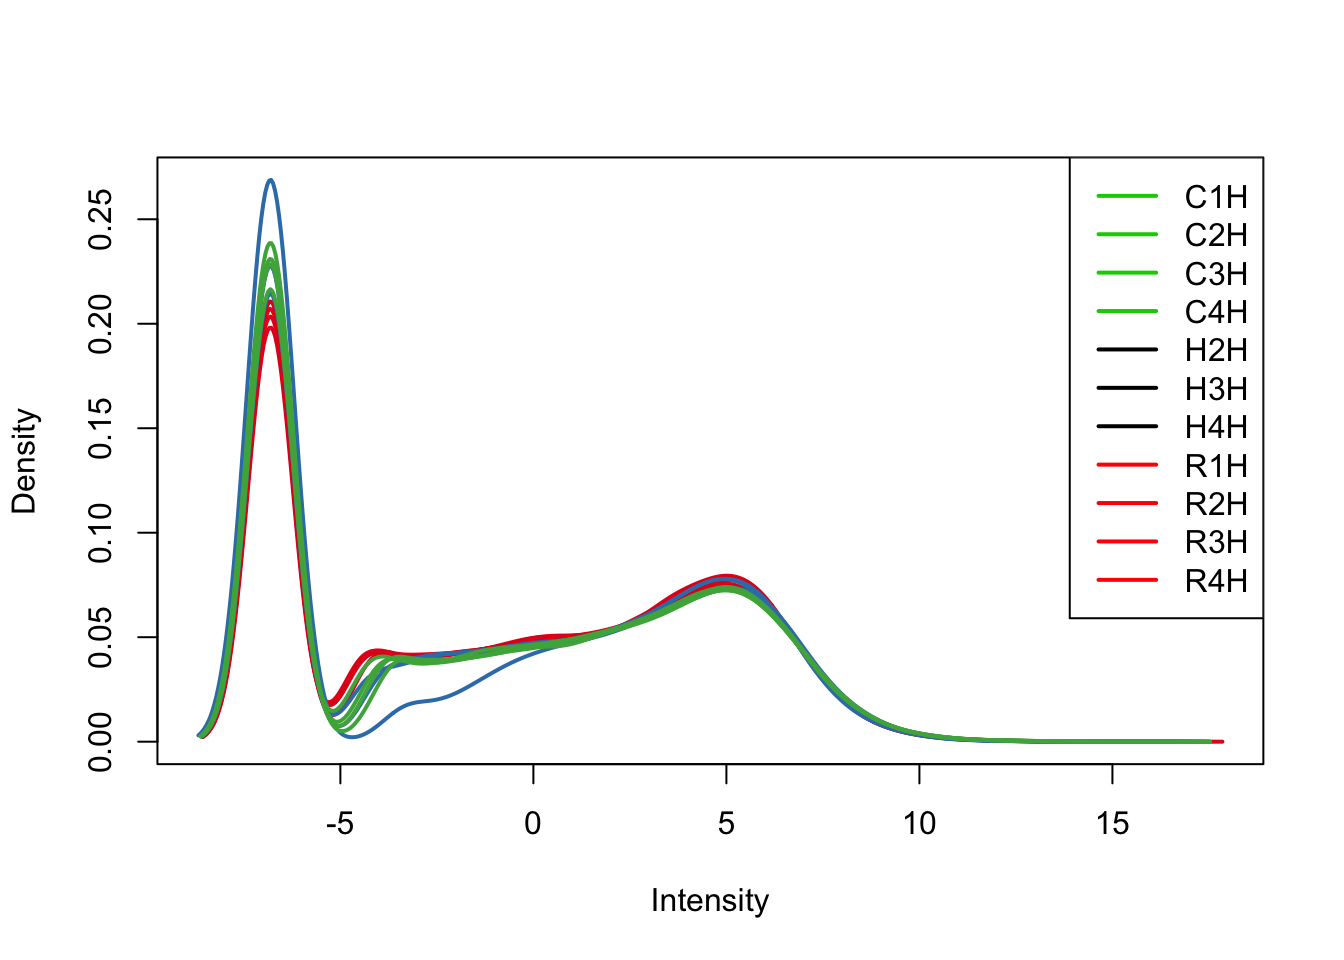
plotDensities(tmm_cpm[,all_kidneys], col=col[all_kidneys, ], legend="topright")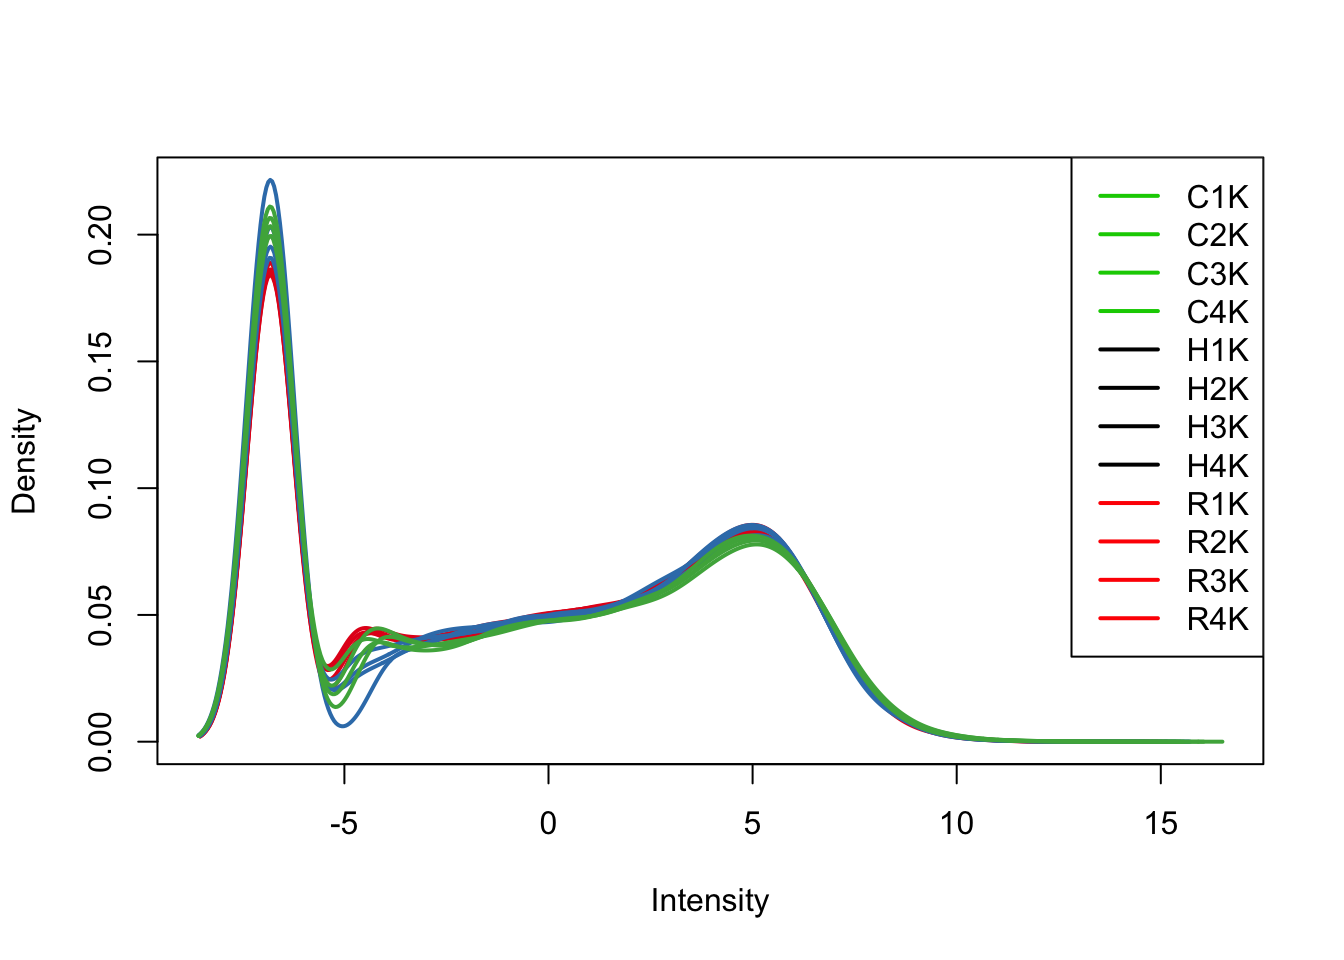
plotDensities(tmm_cpm[,all_livers], col=col[all_livers, ], legend="topright")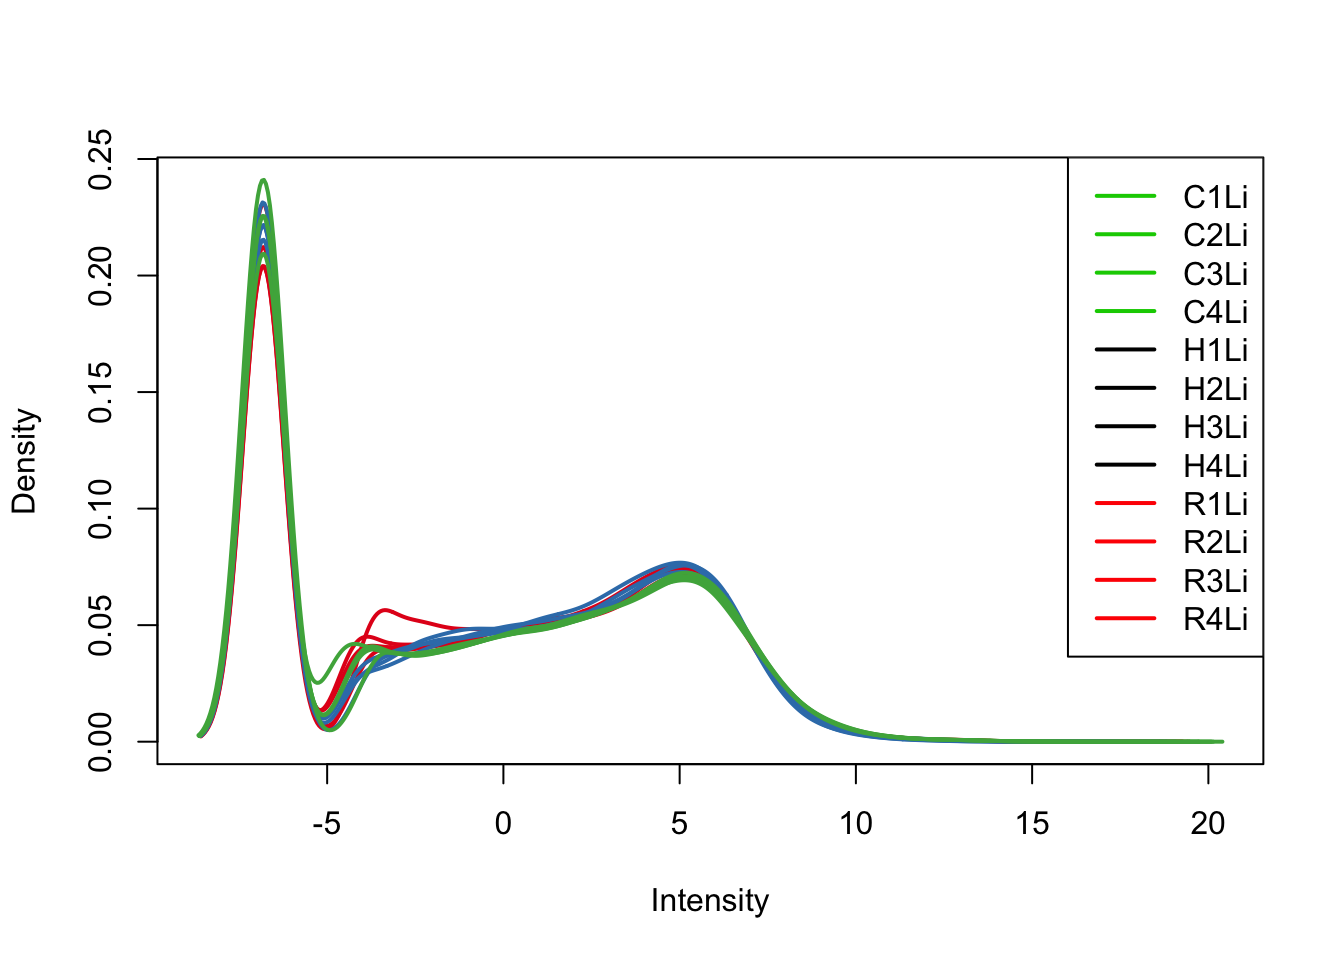
plotDensities(tmm_cpm[,all_lungs], col=col[all_lungs, ], legend="topright")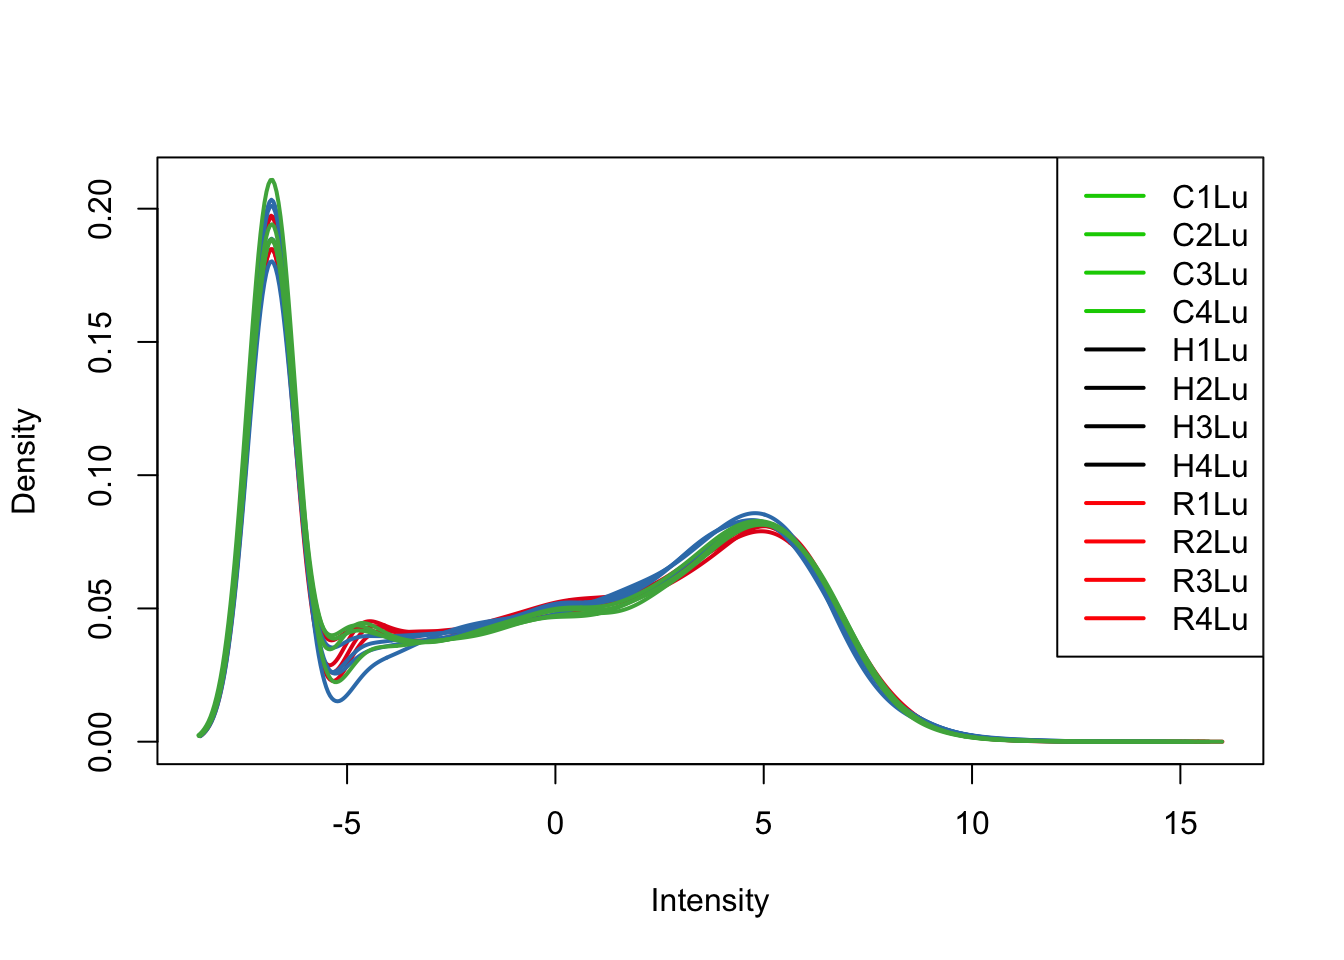
# Look at all tissues in each species
col = as.data.frame(pal[as.numeric(samples$Tissue)])

plotDensities(tmm_cpm[,1:16], col=col[1:16, ], legend="topright")
plotDensities(tmm_cpm[,17:31], col=col[17:31, ], legend="topright")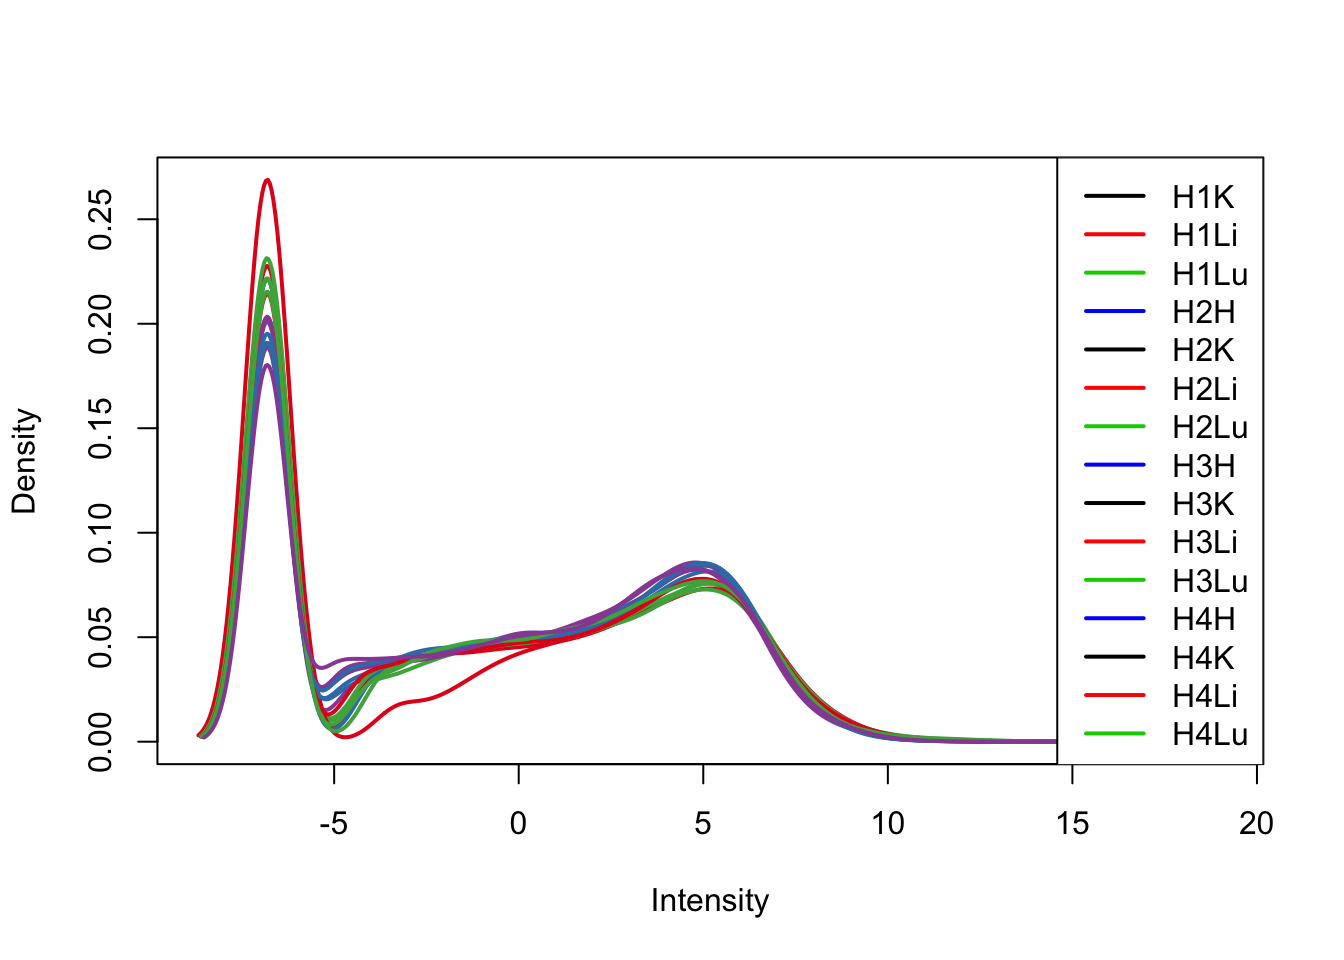
plotDensities(tmm_cpm[,32:47], col=col[32:47, ], legend="topright")